Archive:The EU in the world - health
Data extracted in April 2018.
Planned article update: June 2019.
Highlights
Lowest health expenditure per inhabitant in 2015 among G20 members in India.
The gender gap in life expectancy at birth in 2015 was far higher in Russia than in other G20 members.
Among G20 members the lowest proportions of people being overweight or obese in 2016 were in India, both for men and for women.
Life expectancy at birth, 2015
This article is part of a set of statistical articles based on Eurostat’s publication The EU in the world 2018.
The article focuses on public health issues such as healthcare expenditure, provision and resources, as well as the health status of populations and causes of death in the European Union (EU) and the 15 non-EU members of the Group of Twenty (G20). It gives an insight into health in the EU in comparison with the major economies in the rest of the world, such as its counterparts in the so-called Triad — Japan and the United States — and the BRICS composed of Brazil, Russia, India, China and South Africa.
Full article
Expenditure on health
Lowest health expenditure per inhabitant in 2015 in India
Healthcare systems are organised and financed in different ways. Monetary and non-monetary statistics may be used to evaluate how a healthcare system aims to meet basic needs for healthcare, through measuring financial, human and technical resources within the healthcare sector. Public expenditure on healthcare is often funded through government financing (general taxation) or social security funds. Private expenditure on healthcare mainly comes from direct household payments (also known as out-of-pocket expenditure) and private health insurance.
The United States had by far the highest expenditure on health relative to gross domestic product (GDP), 16.8 % in 2015 (see Figure 1). Six other G20 members committed between 8 % and 11 % of their GDP to health in 2015: Japan, Canada, the EU-28 (excluding Malta), Australia, Brazil and South Africa. These were followed by a group of six members — South Korea, Argentina, Mexico, Saudi Arabia, Russia and China — where health expenditure was between 5 % and 7 % of GDP. The remaining G20 members — Turkey, India and Indonesia — spent 3-4 % of their GDP on health.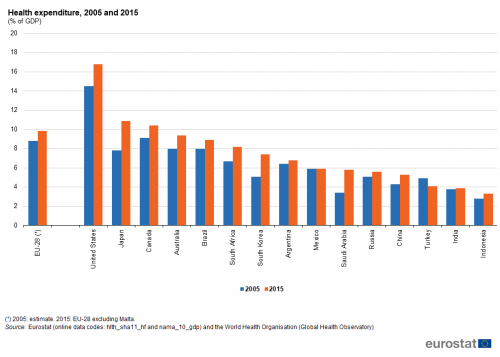
(% of GDP)
Source: Eurostat (hlth_sha11_hf) and (nama_10_gdp) and the World Health Organisation (Global Health Observatory)
Between 2005 and 2015 the level of expenditure on health relative to GDP increased in all G20 members except for Turkey. The largest increases in percentage point terms were reported for Japan, Saudi Arabia, South Korea and the United States.
Figure 2 shows the absolute level of health expenditure per inhabitant; note that this is shown in United States dollars, having been converted using purchasing power parities rather than market exchange rates and so reflects differences in general (rather than specifically for healthcare) price levels among the G20 members. The information presented confirms the notably higher level of expenditure on health in the United States, as well as relatively high levels in Canada, Australia, Japan, the EU-28, Saudi Arabia and South Korea. By contrast, Indonesia and India recorded by far the lowest levels of health expenditure per inhabitant among the G20 members.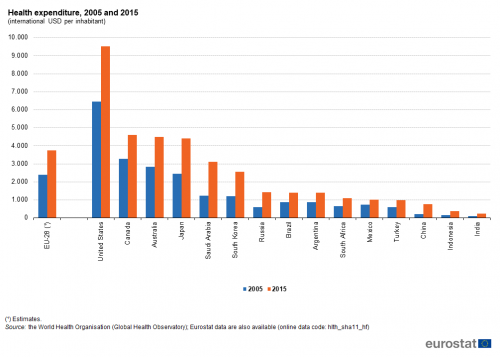
(international USD per inhabitant)
Source: Eurostat (hlth_sha11_hf)
Healthcare resources
The number of hospital beds per 100 000 inhabitants in the EU-28 in 2015 was the fourth highest among G20 members
The need for hospital beds may be influenced by the relative importance of in-patient care on one hand and day care and out-patient care on the other, as well as the use of technical resources. The number of hospital beds per 100 000 inhabitants averaged 515 in the EU-28 in 2015. Comparing the most recent data for G20 members, this ratio for the EU-28 was the fourth highest, a long way below the ratios observed in Japan, South Korea and Russia; the lowest availability of hospital beds relative to the size of the population was in India, with 70 beds per 100 000 inhabitants (see Table 1).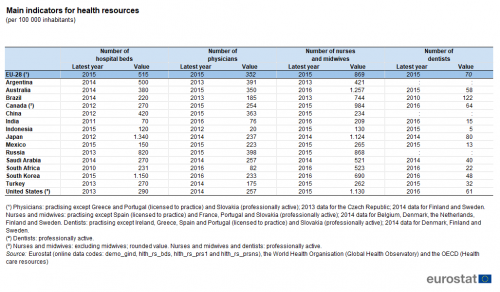
(per 100 000 inhabitants)
Source: Eurostat (demo_gind), (hlth_rs_bds), (hlth_rs_prs1) and (hlth_rs_prsns), the World Health Organisation (Global Health Observatory) and the OECD (Health care resources)
One of the key indicators for measuring healthcare personnel is the total number of physicians, expressed per 100 000 inhabitants. The variation between the G20 members in the number of physicians was relatively low in comparison with the other personnel indicators shown in Table 1. The highest number of physicians relative to the overall population size among the G20 members was recorded in Russia, followed closely by Argentina and then China, the EU-28 and Australia. South Africa, India and Indonesia recorded less than 100 physicians per 100 000 inhabitants.
Among the three indicators concerning healthcare personnel, the number of dentists per 100 000 inhabitants showed the greatest variation among the G20 members when taking account of their relatively low overall number. For example, Indonesia recorded an average of 5 dentists per 100 000 inhabitants in 2015, while in Brazil there were more than 120 dentists per 100 000 inhabitants in 2010. The average for the EU-28 was 70 dentists per 100 000 inhabitants in 2015.
Life expectancy
The gender gap in life expectancy at birth in 2015 was far higher in Russia than in other G20 members
Among the G20 members, the highest life expectancy at birth in 2015 was recorded in Japan (84 years), while life expectancy also reached or passed 80 years in Australia, South Korea, Canada and the EU-28. In three G20 members, life expectancy at birth remained in 2015 below 70 years: 69 years in Indonesia, 68 years in India and 63 years in South Africa. The relatively low life expectancy for South Africa may be largely attributed to the impact of an HIV/AIDS epidemic: in 2016, 19 % of the population aged 15-49 had the human immunodeficiency virus (HIV). In all G20 members, life expectancy was higher for females than for males (see Figure 3): this gender gap ranged from three years in Saudi Arabia, India and China to seven years in South Korea, South Africa, Argentina and Brazil, with a much larger gap (12 years) in Russia.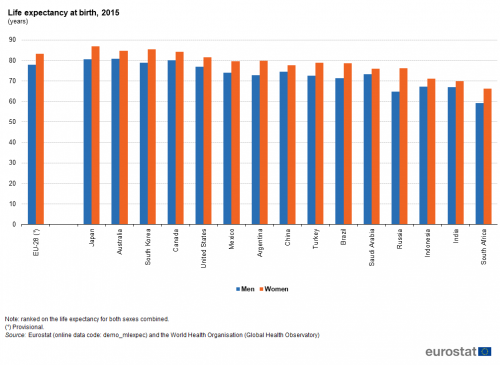
(years)
Source: Eurostat (demo_mlexpec) and the World Health Organisation (Global Health Observatory)
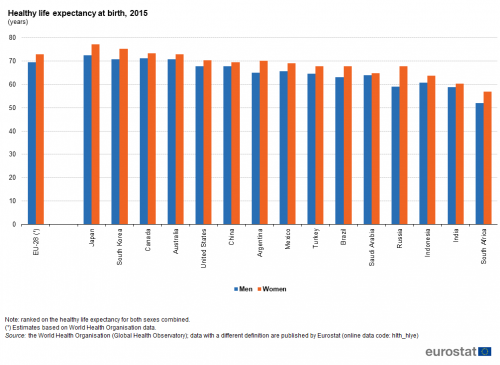
Combining the data presented in Figures 3 and 4 indicates that healthy life (years) made up 86 % to 90 % of life expectancy at birth in all non-EU G20 members, with the lowest share in Saudi Arabia and the highest in China.
Mortality
Almost all maternal deaths — those related to pregnancy and childbirth — occur in emerging and developing countries, with maternal mortality rates generally higher in their rural areas and among poorer communities. Most maternal deaths are preventable and according to the World Health Organisation the main causes are: severe bleeding (mostly bleeding after childbirth); infections (usually after childbirth); high blood pressure during pregnancy (pre-eclampsia and eclampsia); complications from delivery; and unsafe abortions.
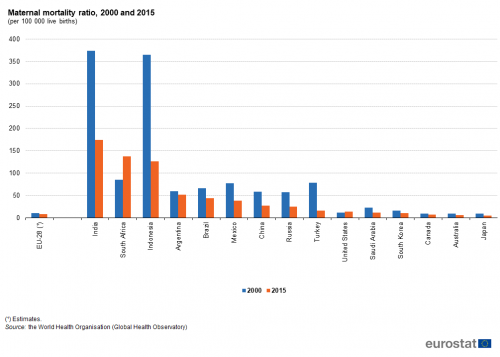
The maternal mortality ratio shows the ratio between the number of maternal deaths and the number of live births (see Figure 5). While this ratio was relatively low in about half of the G20 members in 2015, it exceeded 100 per 100 000 live births in India, South Africa and Indonesia, was just above 50 per 100 000 live births in Argentina, and was at least 25 per 100 000 live births in Brazil, Mexico, China and Russia. The lowest ratios in 2015 — below 10 maternal deaths per 100 000 live births — were reported in the EU-28, Canada, Australia and Japan.Between 2000 and 2015, the maternal mortality ratio fell in most G20 members, the exceptions being South Africa, where the rate increased greatly, and the United States, where an already quite low ratio rose slightly. Elsewhere, particularly large falls in the maternal mortality ratio were observed in China, Russia, Mexico, Turkey, Indonesia and India.
The infant mortality rate presents the ratio between the number of deaths of children aged less than one year and the number of live births in the same reference period; the resulting value is generally expressed per 1 000 live births. The progress made in medical healthcare services is reflected in the rapid decrease of infant mortality rates; indeed, all of the G20 members recorded falls in infant mortality rates between 2006 and 2016, as shown in Figure 6. The largest relative falls were recorded by China and Turkey, where the infant mortality rates fell by around 50 %.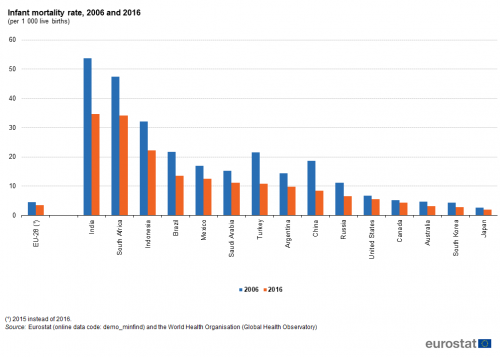
(per 1 000 live births)
Source: Eurostat (demo_minfind) and the World Health Organisation (Global Health Observatory)
The latest data available, for 2016, show that the lowest infant mortality rates among G20 members were recorded in Japan, South Korea, Australia, the EU-28 and Canada, all under 5.0 deaths per 1 000 live births. By contrast, infant mortality rates in South Africa and India were more than eight times as high as in these five G20 members with the lowest rates, and were more than 10 deaths per 1 000 live births above the rate in Indonesia which had the third highest rate.
Non-medical health determinants
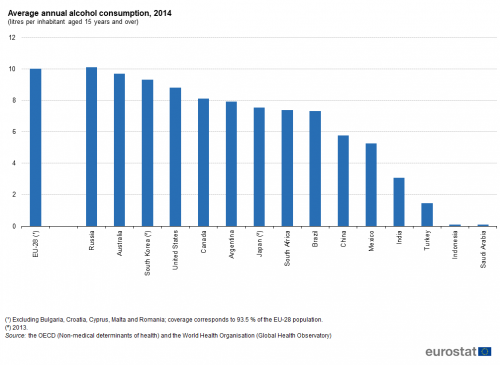
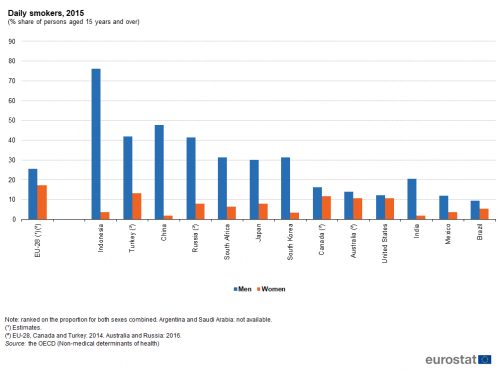
Figures 7 to 9 provide information on three non-medical health determinants, namely alcohol consumption, smoking and being overweight or obese. Russia and the EU-28 recorded the highest annual alcohol consumption among G20 members in 2014, around 10 litres of alcohol per inhabitant, closely followed by Australia and South Korea. Relatively low average levels of alcohol consumption were recorded for India and Turkey, and the lowest average levels for Indonesia and Saudi Arabia; these low levels may be influenced to a large degree by the predominant religious beliefs in these countries.Lowest proportions of people being overweight or obese in 2016 were in India, both for men and for women
The most frequently used measure for assessing whether someone is overweight or obese is based on the body mass index (BMI), which evaluates weight in relation to height. According to the World Health Organisation, adults with a BMI between 25 and 30 are considered as overweight and those with an index over 30 are considered obese. Note that the data presented in Figure 9 may be based on measured results or self-reported data.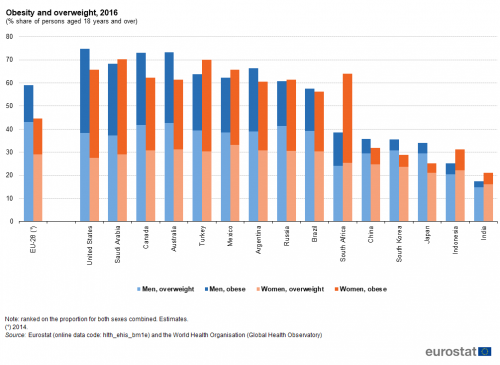
(% share of persons aged 18 years and over)
Source: Eurostat (hlth_ehis_bm1e) and the World Health Organisation (Global Health Observatory)
The highest proportions of men that were either obese or overweight were observed for the United States (75 % of the male population), Australia and Canada (both 73 %). By contrast, the highest proportions for women were observed for Saudi Arabia and Turkey (both 70%), followed by the United States (66%). By far the lowest proportions for men were observed for Indonesia (25 %) and India (18 %), while for women the lowest proportions were recorded in Japan (25 %) and India (21 %).
The proportion of overweight or obese men was greater than the equivalent proportion of women in a small majority of G20 members, with this gap between the sexes rising to more than 10.0 points in the EU-28, Australia and Canada. In the G20 members where the proportion of overweight or obese people was higher for women than for men, the differences were generally quite small, with the notable exception of South Africa where the gap was 25 points.
Among the G20 members there is far greater variability in the proportion of the population who were obese than among the proportion who were overweight. China, India, Indonesia, Japan and South Korea recorded particularly low proportions of their populations who were considered obese, all less than 10 % for both men and for women. Among men, the proportion considered to be obese was smaller than the proportion that were overweight in all G20 members. Among women this situation was also observed in a majority of the G20 members, but not in Canada and Russia where the two proportions were nearly the same, nor in Turkey, the United States, Saudi Arabia and South Africa where the proportion of women who were obese was notably larger than the proportion that were overweight.
Source data for tables and graphs
Data sources
The statistical data in this article were extracted during April 2018.
The indicators are often compiled according to international — sometimes worldwide — standards. Although most data are based on international concepts and definitions there may be certain discrepancies in the methods used to compile the data.
EU data
Nearly all of the indicators presented for the EU have been drawn from Eurobase, Eurostat’s online database. Eurobase is updated regularly, so there may be differences between data appearing in this article and data that is subsequently downloaded. In exceptional cases some indicators for the EU have been extracted from international sources.
G20 members from the rest of the world
For the 15 non-EU G20 members, the data presented have mainly been compiled by the World Health Organisation; some data have been compiled by the OECD. For some of the indicators shown a range of international statistical sources are available, each with their own policies and practices concerning data management (for example, concerning data validation, correction of errors, estimation of missing data, and frequency of updating). In general, attempts have been made to use only one source for each indicator in order to provide a comparable dataset for the members.
Context
Health issues cut across a range of topics — including the provision of healthcare and protection from illness and accidents, such as consumer protection (food safety issues), workplace safety, environmental or social policies. The health statistics presented in this article address public health issues such as healthcare expenditure and resources, life expectancy and mortality, as well as a number of determinants of the health status of a population.
In many developed countries life expectancy at birth rose rapidly during the last century due to a number of factors, including reductions in infant mortality, rising living standards, improved lifestyles and better education, as well as advances in healthcare and medicine. Life expectancy at birth is one of the most commonly used indicators for analysing mortality and reflects the mean (additional) number of years that a person of a certain age can expect to live, if subjected throughout the rest of their life to the current mortality conditions.
Indicators of health expectancies, such as healthy life years (also called disability-free life expectancy) have been developed to study whether extra years of life gained through increased longevity are spent in good or bad health. These focus on the quality of life spent in a healthy state, rather than total life spans. Disability-free life expectancy is the number of years that a person is expected to continue to live in a healthy condition, in other words without limitation in functioning and without disability.
Direct access to
- The EU in the world 2018
- Sustainable Development in the European Union — Monitoring report on progress towards the SDGs in an EU context
- Globalisation patterns in EU trade and investment
- 40 years of EU-ASEAN cooperation — 2017 edition
- Key figures on the enlargement countries — 2017 edition
- Asia-Europe Meeting (ASEM) — A statistical portrait — 2016 edition
- The European Union and the African Union — 2016 edition
- Euro-Mediterranean statistics — 2015 edition
- The European Union and the BRIC countries
- The European Union and the Republic of Korea — 2012
- Health status (hlth_state)
- Healthy life years (hlth_hly)
- Healthy life years (from 2004 onwards) (hlth_hlye)
- Healthy life years (hlth_hly)
- Health determinants (hlth_det)
- Body mass index (BMI) (hlth_bmi)
- Body mass index (BMI) by sex, age and educational attainment level (hlth_ehis_bm1e)
- Body mass index (BMI) (hlth_bmi)
- Health care (hlth_care), see:
- Health care expenditure (SHA2011) (hlth_sha11)
- Health care expenditure — summary tables (hlth_sha11_sum)
- Health care expenditure by financing scheme (hlth_sh11a_hf)
- Health care expenditure — summary tables (hlth_sha11_sum)
- Health care resources (hlth_res)
- Health care staff (hlth_staff)
- Nursing and caring professionals (hlth_rs_prsns)
- Health personnel (excluding nursing and caring professionals) (hlth_rs_prs1)
- Health care facilities (hlth_facil)
- Hospital beds by type of care (hlth_rs_bds)
- Health care staff (hlth_staff)
- Mortality (demo_mor), see:
- Infant mortality rates (demo_minfind)
- Life expectancy by age and sex (demo_mlexpec)
- Main GDP aggregates (nama_10_ma)
- GDP and main components (output, expenditure and income) (nama_10_gdp)
- OECD
- World Health Organisation (WHO)
