Archive:Farm structure statistics
- Data from September 2009, most recent data: Further Eurostat information, Main tables and Database.
The structure of agriculture in the Member States of the European Union (EU) varies considerably. Among other factors, this reflects differences in geology, topography, climate and natural resources, as well as the diversity of regional activities, infrastructure and social customs. The 'Survey on the structure of agricultural holdings', also known as the Farm structure survey (FSS), helps assess the agricultural situation across the EU, monitoring trends and transitions in the structure of agricultural holdings, while also modelling the impact of external developments or policy proposals. This article presents some elements of the FSS.
Main statistical findings
Farm structure at EU level
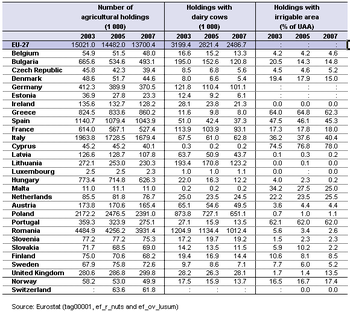
There were 7.3 million commercial agricultural holdings in the EU in 2007, with a further 6.4 million small holdings (those below a threshold of 1 European size unit (ESU)). Almost half (48 %) of the small holdings in the EU, principally being subsistence in nature, were found in Romania. A little over one third of all the EU’s commercial agricultural holdings (of a size greater than 1 ESU) in the EU were in Poland (15.4 %) and Italy (18.9 %) in 2007. A further one third of commercial holdings were located in Spain (12.9 %), Romania (11.9 %) and Greece (9.7 %).
Among most Member States and across the EU-27 as a whole, there was a further steady decline in the number of agricultural holdings during the period between 2003 and 2007. In this four-year period, the number of agricultural holdings in the EU-27 declined by 1.3 million (or 8.8 %), of which almost half were commercial holdings. There were particularly fast structural changes in Estonia, where the number of holdings declined by more than one third (-36.7 %), as well as in Bulgaria (-25.9 %), Portugal (-23.4 %) and Hungary (-19.0 %).
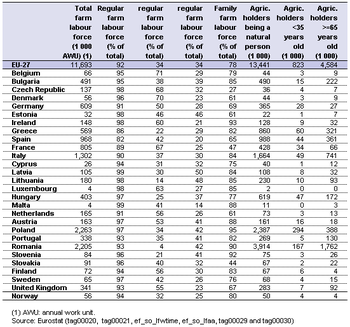
The total farm labour force in the EU-27 was the equivalent of 11.7 million full-time workers, of which 9.0 million worked on commercial holdings. Agriculture remains very much a family-oriented activity in the majority of Member States; almost four fifths (78 %) of the total agricultural labour force were farm holders or members of their family. The main exceptions were Slovakia (44 %) and the Czech Republic (27 %), where there is a different ownership structure to the majority of Member States. Just over one third (34 %) of the regular agricultural labour force in the EU-27 was female, although in the Baltic Member States this share was closer to half, reaching 50 % in Latvia. There were relatively few (6.1 %) agricultural holders in the EU-27 under the age of 35 years, but a relatively large proportion (34.1 %) over the age of 65 years. Graph 1 indicates the proportion of farm holdings with other gainful economic activity.
Besides agricultural activity, other gainful activities were also conducted by about one in every ten (9.9 %) of the EU’s agricultural holdings in 2007, this proportion being slightly higher (13.5 %) among commercial holdings. A little over one quarter (27.6 %) of all holdings in Finland reported another gainful activity in 2007, with rates above 20 % also being recorded in Austria, Germany, Sweden, the United Kingdom, Denmark and France.
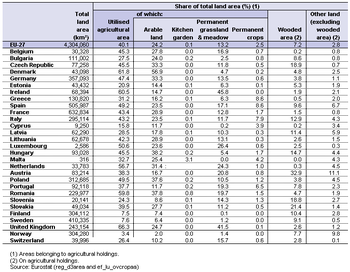
Two fifths (an estimated 40.1 %) of the total land area of the EU was utilised agricultural area in 2007. This proportion rose to two thirds (an estimated 66.5 %) of the land area of the United Kingdom, but was less than one tenth of the total in Sweden and Finland. Arable land (which includes cereals and other arable land) accounted for a little less than one quarter (24.2 %) of the total land area of the EU, with permanent grassland (which is composed of pasture, meadow and rough grazing) accounting for 13.2 % of the total land area. During the ten years through until 2007, the make-up of land use in the EU-27 did not change very much.
Farm structure by country
As farm structure often has country-specific characteristics, reporting at the level of Member States makes excellent sense. Therefore a brief but nevertheless comprehensive insight into the farm structure in the Member States is provided in separate articles, one for each country (to be completed):
- Farm structure in Austria
- Farm structure in Belgium
- Farm structure in Bulgaria
- Farm structure in Cyprus
- Farm structure in Denmark
- Farm structure in Estonia
- Farm structure in Finland
- Farm structure in France
- Farm structure in Germany
- Farm structure in Greece
- Farm structure in Hungary
- Farm structure in Ireland
- Farm structure in Italy
- Farm structure in Lithuania
- Farm structure in Luxembourg
- Farm structure in Malta
- Farm structure in Norway
- Farm structure in Portugal
- Farm structure in Romania
- Farm structure in Slovakia
- Farm structure in Spain
- Farm structure in Sweden
- Farm structure in the United Kingdom
Farm Structure Evolution (surveys 2003, 2005, 2007)
The present analysis engages in an outline of the tendencies of the last three of these surveys (2003, 2005 and 2007) which were carried out in all EU Member States and also in Norway and in Switzerland. This section of the article presents a brief analysis of the main trends of the key indicators summarised in a few tables and graphs.
In several countries the large number of small units impacts heavily on the statistical results, especially those based on the numbers of holdings (e.g. averages). In order to improve their comparability this analysis focuses on agricultural holdings of at least 1 ESU . A brief overview of small holdings is nevertheless given at the end of this sub-chapter.
Agricultural holdings
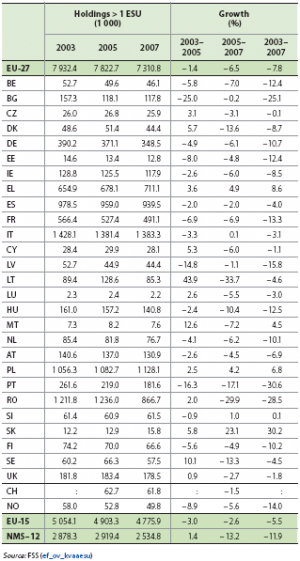
In the 2003 FSS the number of holdings with at least 1 ESU in the EU-27 was 7.93 million. There has been a general tendency for a decrease in the number of holdings in the last years. For the total EU-27, the decrease was 1.4% between 2003 and 2005, while in 2007 the reduction was even greater reaching 6.5%.
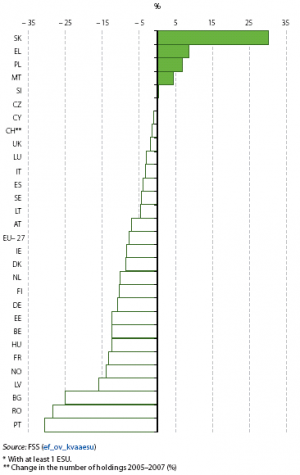
With exception of Slovakia, Greece, Poland, Malta and Slovenia, where the number of holdings have increased in the period 2003 -2007, all other MS registered a decrease. In the case of the two new MS (Bulgaria and Romania) and also Portugal the number of agricultural holdings was reduced by over 25% between 2003 and 2007.
The drop in the number of agricultural holdings can be linked to the technical developments of the agricultural sector linked with restructuring of the holdings, as well as the ageing of the holders, often leading to the disappearance of the smaller holdings. This general tendency of abandonment of the smaller units is followed by an increase in the number of the larger holdings.
Utilised Agricultural Area (UAA)
The total UAA of EU-27 was around 160 million ha (1.6 million km2), which represents over one third of the territory of the EU in 2007. In the EU-27 as a whole, the UAA has been relatively stable, revealing only a slight decrease (-0.5%) from 2003 to 2007. However, analysing the numbers by member state the situation is very heterogeneous. The highest increases are observed in some of the new MS, this is the case of Estonia (20.6%), Latvia (18.9%), Lithuania (16.8%), Bulgaria (9%) and Poland (7.5%). This trend can be explained by the new economic and political situation where the incentives of the CAP intensify the use of land for agriculture . On the other hand, other new MS have an opposite tendency. It is the case for Romania and Slovakia where the UAA dropped 10.6 and 9.8% respectively. These countries face a deep restructuring process in what concerns their agricultural sectors. Privatization and redistribution of agricultural land are still having a restructuring effect on the agriculture of these new MS.
Livestock
As with the average UAA per holding, the average LSU per holding has also increased on average for the total of the EU-27. Even with the decrease of the number of LSU (from 136.4 million in 2003 to 132.6 million in 2007) the average number of LSU per holding has increased from 17.2 in 2003 to 18.1 in 2007. With the exception of Romania, The reduction of LSU per holding occurred in the countries where it was lower (Greece, Slovenia Malta and Cyprus) and also in the Czech Republic and Slovakia where privatisation process in the agricultural sector is reducing the numbers of livestock per farm.
Similarly to the UAA, the four countries that contribute most to the total amount of EU-27 livestock are France (17%), Germany (13.5%), Spain (11%), and the United Kingdom (10.5%). These four MS represent more than half (52%) of the livestock of the EU-27.
From 2003 to 2007 the changes between the various categories of livestock have not been significant. There is a slight increase of the pig livestock, and a small decrease of the poultry and rabbits.
If we analyse the figures by country and livestock type, we can perceive some tendencies. The importance of cattle in the percentage of livestock has reduced in the "old" MS. In Denmark, Finland, and the Netherlands the percentage of cattle in the total amount of LSU has reduced by more than 2 percentual points. Norway also reduced the percentage of cattle from 52.9 to 50.2% from 2003 to 2007. On the contrary, the new MS have increased the share of cattle. An increase of 2 percentual points or more of the share of cattle was observed for Bulgaria, Romania, Slovakia, Lithuania, Poland and Slovenia. Portugal with an increase of 3.7 percentual points, and Estonia with a decrease of 2.3 percentual points are the exceptions to the rule. In Luxembourg and Ireland more than 80% of the total LSU belongs to the cattle category.
More than half (57.4%) of the livestock of Greece are sheep and goats. In this category, there has been a great increase in Romania from 13% to 19.8% from 2003 to 2007 and in Cyprus the sheep and goats have dropped from 24.3 to 21.3% in the share of total livestock.
Economic size
In spite of the general reduction of the crop area and of livestock, from 2003 to 2007, the total Standard Gross Margin has increased from 145 million to almost 152 million ESU (174 000 to 182 400 million €). France, Germany and Italy combined represent almost half (47% in 2007) of the total SGM of the EU-27, and this percentage has been stable since 2003. On average the European agricultural holding has raised from 18.3 ESU (21 960 €) in 2003, to 20.8 ESU (24 960€) in 2007.
The change in SGM is very diverse within the countries. There are 16 EU countries with a positive evolution in which the SGM has increased from 2003 to 2007. Among these countries 9 belong to the new MS. The Baltic countries have had particularly outstanding increases: Lithuania (47.7%), Estonia (41.0%) and Latvia (36.5%). On the other side, Malta (-34.4%), Romania (-32.5%), Portugal (-22.7%), United Kingdom (-13.4%), Germany (-12.9%) and Ireland (-10.6%) have all had a decrease of over 10%.
In what concerns the average SGM per holding, there is also considerable heterogeneity amongst the countries. In 2007 the average SGM per holding in Romania was 3 ESU (3600 €) while in the Netherlands it was 111.3 ESU (133 560 €). The analysis of the change in the average SGM per holding, between 2003 and 2007, showed that 20 of the EU MS and Norway have had an increase.
Labour Force
In what regards the labour force, the FSS results for the EU-27 in 2007 show that 16.4 million persons worked regularly on the 7.3 million agricultural holdings of at least 1 ESU. There has been a clear reduction in the number of persons working in agriculture from 2003 to 2007(-11.8%).
Farm work (including work by the non-regular labour force) in 2007 represented 9.0 million AWUs, i.e. the equivalent of 9 million people working full-time.
75.5% AWU on the holdings came from the family labour force. In all the countries, with the exception of Malta (where the AWU was the same) and Poland (with a 3.3% increase), there was a decrease in the AWU from 2003 to 2007. The family labour force became more significant in the Czech Republic and in Slovakia (again due to the privatisation in agriculture structure), contrary to the situation in Bulgaria, Austria and Poland where the share of non-family labour force has increased from 2003 to 2007.
Small holdings
Until now this part of the article has only been focusing on the agricultural holdings with a SGM of over 1 ESU (1200 €). In this sub-chapter the analysis will be done using the total number of holdings included in the three last FSS, with a focus on the importance of the small holdings (holdings with a SGM under 1 ESU). Although in 2007 they only accounted for 7% of the UAA, 2.5% of the total LSU and 1.6% of the SGM of EU-27, they cannot be overlooked when investigating the social structure of European agriculture, since they account for 47% of the holdings, 39% of the regular farm workers and 23% of the total farm work (AWU).
The total number of small holdings sums up to slightly over 13.7 million when we include the all of the holdings obtained in FSS 2007. Close to half (6.3 million) of the holdings are under the 1 ESU threshold. In the EU-27 there has been a gradual decrease (-10% in EU 27) of the number of holdings with less than 1 ESU and an increase (10% in EU-27) in the higher economic class (over 100 ESU). This trend is contradicted in some MS where there is an opposite development, as is the case of the United Kingdom, Ireland, Sweden and Denmark. These countries have seen the number of their small farms increase while the number of the larger ones has decreased.
In 7 of the 12 new MS (Romania, Poland, Hungary, Slovakia, Bulgaria, Latvia and Lithuania) the farms with less than 1 ESU represented more than half of the holdings counted in the FSS 2007. In 2007 the Romanian farms under 1ESU represented 23% of the total number of the EU agricultural holdings. The tendency in the Romania farm structure is the reduction of the number of the farms in all of the economic size categories, but overall the percentage of the smaller farms in the total number of farms has grown from 73 to 78% from 2003 to 2007.
Since 2005, the Netherlands do not include farms with less that 1 ESU in the FSS, because they do not represent more than 1 % of the economic agricultural activity, and therefore can be excluded from the universe. In other MS, such as Luxembourg, Denmark, Norway and Finland these small farms have very little significance, being always under 5% of the total farms and summing up to less than 4000 holdings altogether.
In the EU-27, the total UAA of the holdings with less than 1 ESU reaches 11.6 million ha in 2007, which represents 6.8% of the total UAA. This percentage in 2007 varies from close to zero percent (0.02%) in Norway to up to 31 % in Romania. In addition to Romania there are six other MS where the percentage of UAA covered by the small farms is higher than 10%, (Latvia, Lithuania, Austria, Malta, United Kingdom and Poland). The old MS in this group owe their high percentage to the extensive grassland farms, where in general there is no livestock (they therefore contribute to the structure without having actual production). Both Austria and the United Kingdom also have the highest UAA per holding in the category less than 1 ESU (17.8 and 14.8 ha respectively). The holdings with less than 1 ESU in Bulgaria, Malta and Hungary all have the average UAA per holding below 0.5 ha.
Although the number of farms with less than 1 ESU has decreased from 2003 to 2007, the corresponding UAA has increased, which has boosted the average UAA per holding of this type of farms.
In what concerns the livestock figures, the holdings with less than 1 ESU follow the general tendency of decrease in the number of LSU. In fact from 2003 to 2007, the total LSU on holdings with less than 1 ESU fell by 26%. Although presenting a clear reduction of the number of LSU since 2003, the small holdings in Romania, Bulgaria and Hungary present, in 2007, the highest EU-27 values in the percentage of their total national LSU (31%, 26% and 13 % respectively). Unlike the UAA per holding, which has increased in the small farms, the LSU per holding has dropped in the EU 27 average between 2003 and 2007.
The economic importance of the holding with less than 1 ESU is very small compared with the SGM of the total farms (1.61%). The percentage of the small holdings' SGM in the total SGM of the EU-27 has decreased from 2003 to 2007. The figures for Romania continue to stand out from the rest of the countries; these semi-subsistence or subsistence farms represent almost one third of the SGM of Romanian agriculture, according to FSS 2007 results. In Bulgaria and Lithuania the share of the small farms' SGM is around 12%, in all the other countries this value is under 10%. The SGM per holding in the farms with less than 1 ESU has decreased between 2003 and 2007. The average EU-27 small farm has a SGM value of 0.39 ESU (468 €), ranging from 0.13 ESU (156 €) in the United Kingdom to 0.70 (840 €) ESU in Germany.
According to the FSS 2007 figures, the holdings with less than 1 ESU represented 23% of the European agricultural labour force, i.e. 2.7 million AWU. Seven new MS are Above the EU-27 average, of which Romania and Bulgaria (with 56% and 55% respectively). For EU-27 the percentage of AWU from small farms has been stable throughout the three surveys (2003, 2005 and 2007).
The labour intensity of the small farms has also been stable at EU-27 level, registering only a slight decrease from 0.44 AWU in 2003 and 2005 to 0.42 AWU in 2007. But at national level there are many differences in the number of AWU per small farm and also in the changes over time. The AWU per holding varied 0.06 AWU in Malta to 1 AWU in Norway in 2007. Small farms occupy more than half of a full time worker during a full year in 11 countries.
When analysing the number of persons that work on small farms the situation changes and the values indicate a stronger impact of these holdings in the general agriculture structure of the EU. Close to 40 % of the persons working in the European holdings work in a farm with less than 1 ESU, which in absolute numbers corresponds to over 10 million people. Compared to the figures of the AWU, there has been a stronger tendency for the reduction of the share of persons working on the small farms between 2003 and 2007.
The average number of persons working on farms with less than 1 ESU was 1.6 in 2007. This indicator has shown similar values over the years with exception of the Czech Republic and the Scandinavian countries (Denmark, Norway, and Finland) and Sweden where the number of persons per holding in the small farms has increased considerably.
On average, a person working on a small farm in the EU works 26% of his full time working days, while on the farms with a SGM of at least 1 ESU this percentage is 55%.
In FSS 2005 and 2007 the number of farms producing mainly for own consumption (consuming over 50% of their production) was surveyed in 16 of the 27 EU countries where this characteristic was significant, which includes all the new MS and the old Mediterranean MS (Greece , Italy , Spain and Portugal). With the exception of Malta, the percentage of holdings consuming more than 50% of their production was higher in the size class under 1 ESU than in the total of the holdings. The figures in table 1.4.7 contribute to point out the farm structure situation and the divergence between the EU-15 and the new MS. The subsistence and semi-subsistence farming is a major component of the agricultural structure of the NMS-12. The FSS has recorded an overall decrease in the total number of these farms (-8%) from 2005 to 2007, however, in the farms under 1 ESU this reduction was smaller (-4%).
Data sources and availability
A comprehensive Farm structure survey (FSS) is carried out by Member States every 10 years (the full scope being the agricultural census) and intermediate sample surveys are carried out three times between these basic surveys. The Member States collect information from individual agricultural holdings and, observing strict rules of confidentiality, data are forwarded to Eurostat. The information collected covers:
- land use;
- livestock numbers;
- rural development;
- management and farm labour input (including age, gender and relationship to the holder).
The survey data are then aggregated to different geographic levels (Member States, regions, and for basic surveys also districts) and arranged by size class, area status, legal status of holding, objective zone and farm type.
The basic unit underlying the FSS is the agricultural holding, a technical-economic unit under single management engaged in agricultural production. The FSS covers all agricultural holdings with a utilised agricultural area (UAA) of at least one hectare (ha) and those holdings with a UAA of less than 1 ha if their market production exceeds certain natural thresholds.
Built-up and related land comprises residential land, industrial land, quarries, pits and mines, commercial land, land used by public services, land of mixed use, land used for transport and communications, for technical infrastructure, recreational and other open land. Scattered farm buildings, yards and annexes are excluded. Some figures may refer to the closest year for which data is available (the limit being +/- one or two years before or after).
'Other gainful activity' is any activity other than that relating to farm work, including activities carried out on the holding itself (camp sites, accommodation for tourists, etc.) or that use its resources (machinery, etc.) or products (such as processing farm products, renewable energy production, etc.), and which have an economic impact on the holding. Other gainful activity is carried out by the holder, his/her family members, or one or more partners on a group holding.
The farm labour force is made-up of all individuals who have completed their compulsory education (having reached school-leaving age) and who carried out farm work on the holding under survey during the 12 months up to the survey day. The figures include the holders, even when not working on the holding, whereas their spouses are counted only if they carry out farm work on the holding. The holder is the natural person (sole holder or group of individuals) or the legal person (e.g. a co-operative or other institution) on whose account and in whose name the holding is operated and who is legally and economically responsible for the holding, i.e. the entity or person that takes the economic risks of the holding. For group holdings, only the main holder (one person) is counted. The regular labour force covers the family labour force (even those who were working accidentally on the holding) and permanently employed (regular) non-family workers. The family labour force includes the holder and the members of his/her family who carried out farm work (including all persons of retiring age who continue to work on the holding). One annual work unit (AWU) corresponds to the work performed by one person who is occupied on an agricultural holding on a full-time basis. Full-time means the minimum hours required by the national provisions governing contracts of employment. If these provisions do not explicitly indicate the number of hours, then 1 800 hours are taken to be the minimum (225 working days of eight hours each).
Context
Rural development policy aims to improve competitiveness in agriculture and forestry, improve the environment and countryside, improve the quality of life in rural areas and encourage the diversification of rural economies. As agriculture has modernised and the importance of industry and services within the economy has increased, so agriculture has become much less important as a source of jobs. Consequently, increasing emphasis is placed on the role farmers can play in rural development, including forestry, biodiversity, the diversification of the rural economy to create alternative jobs and environmental protection in rural areas. The FSS continues to be adapted to provide timely and relevant data to help analyse and follow these developments.
Further Eurostat information
Publications
- Agriculture – Main statistics 2005-2006((Pocketbook)
Main tables
- Agriculture (t_agri), see:
- Structure of agricultural holdings (t_ef)
Database
- Agriculture (agri), see:
- Structure of agricultural holdings (ef)
- Overview of agricultural holdings (ef_ov)
- Land Use (ef_lu)
- Livestock (ef_ls)
- Special interest topics (ef_so)
- Standard gross margin (SGM) coefficients used for typology (ef_tsgm)
- Standard output (SO) coefficients used for typology (ef_tso)
- Structure of agricultural holdings by region, main indicators (ef_r_main)
Dedicated section
Other information
- Farm structure – Methodology of Community surveys
- Regulation 571/88 of 29 February 1988 on the organization of Community surveys on the structure of agricultural holdings between 1988 and 1997
- Commission Decision 85/377/EEC of 7 June 1985 establishing a Community typology for agricultural holdings
- Commission decision 115/2000 of 24 November 1999 relating to the definitions of the characteristics, the list of agricultural products, the exceptions to the definitions and the regions and districts regarding the surveys on the structure of agricultural holdings
Source data for tables and graphs (MS Excel)
