Achieve gender equality and empower all women and girls (statistical annex)
- Data from early October 2018. Most recent data: Further Eurostat information, Main tables. Planned article update: November 2018.
This article provides an overview of statistical data on SDG 5 ‘gender equality’ in the European Union (EU). It is based on the set of EU SDG indicators for monitoring of progress towards the UN Sustainable Development Goals (SDGs) in an EU context.
This article is part of a set of statistical articles, which are based on the Eurostat publication ’ Sustainable development in the European Union — Monitoring report on progress towards the SDGs in an EU context (2017 edition)’. This report is the first edition of Eurostat’s future series of monitoring reports on sustainable development, which provide a quantitative assessment of progress of the EU towards the SDGs in an EU context.
Physical and sexual violence to women experienced within 12 months prior to the interview
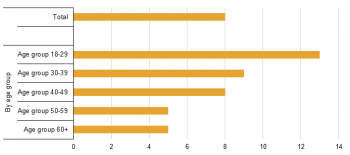
In 2012, 8 % of women in the EU had experienced physical or sexual violence by a partner or a non-partner in the 12 months prior to the interview.
(% of women)
Source: Eurostat online data code (sdg_05_10)

(% of women)
Source: Eurostat online data code (sdg_05_10)
The indicator ‘physical and sexual violence by a partner or a non-partner’ is based on results from a survey by the European Union Agency for Fundamental Rights (FRA). Women were asked whether they had experienced physical and/or sexual violence in the past 12 months prior to the interview. The data presented here includes women who stated that they have experienced physical and/or sexual violence ‘once’, ‘2–5 times’ or ‘6 or more times’. Partners include people with whom the respondents were, or had been, married, living together without being married or involved in a relationship without living together. Non-partners include all perpetrators other than women’s current or previous partner [1].
In 2012, 8 % of women in the EU had experienced physical and/or sexual violence by a partner or a non-partner in the 12 months prior to the interview. Looking at longer life spans, every third woman (33 %) in the EU reported having experienced physical or sexual violence by a partner or a non-partner since the age of 15.
In 2012, younger women reported more often having experienced physical and/or sexual violence by a partner or a non-partner in the past 12 months [2].
Prevalence rates do not only vary greatly within countries but also across countries, as shown in Figure 5.2. However, caution is needed when comparing prevalence rates across countries, because in some countries there is a stigma associated with disclosing cases of violence against women in certain settings and to certain people, including interviewers [3]. In addition, it can also be observed that Member States that rank highest in terms of gender equality tend also to have a greater prevalence of violence against women in the FRA survey, indicating there is a greater awareness and willingness in these countries to disclose experiences of violence to an interviewer [4].
Other possible explanations for observed differences between Member States in prevalence rates for violence against women may include the age structure of the society, the overall violence crime rate in a country or different drinking patterns. Alcohol is often put forward as an explanation for women’s experiences of violence, particularly in intimate partner relationships. However, further research is needed to be able to understand the context in which violence occurs and to the possible explanations for reported rates in the survey [5].
Gender employment gap
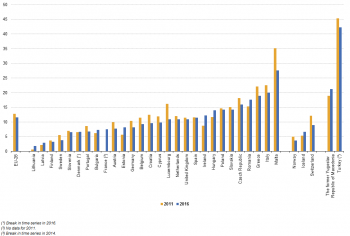
While women still tend to be less employed than men, the gender employment gap narrowed between 2005 and 2016.

(percentage points)
Source: Eurostat online data code (sdg_05_30)
(percentage points)
Source: Eurostat online data code (sdg_05_30)
The gender employment gap is defined as the difference between the employment rates of men and women aged 20 to 64. The employment rate is calculated by dividing the number of people aged 20 to 64 in employment by the total population of the same age group. The indicator is based on the EU Labour Force Survey (EU-LFS).
While the gender employment gap in the EU decreased almost continuously between 2005 and 2016, women still tend to have much lower employment rates than men. A number of factors contribute to this trend. As mentioned above, there is a considerable gender gap with regard to inactivity due to caring responsibilities. Parenthood is also an important reason for employment differences between men and women. This is especially the case in countries where childcare services or facilities taking care of elderly and other dependent relatives are unaffordable or absent [6]. In addition, the longer women are out of the labour market or remain unemployed due to care duties, the harder it becomes for them to find a job.
The gender employment gap narrowed by 4.3 percentage points between 2005 and 2016. The strongest reduction occurred during the economic crisis, partly because traditionally male-dominated industries, such as construction and automobile, were the most affected [7]. The gap continued to shrink until 2014, but has remained stable since then.
Data on the G20 members and their gender gap with regard to the activity rate makes it possible to view the EU in a global context. The data is not directly comparable because the activity rate is the share of economically active people (employed and unemployed) in the total population aged 15 to 64. In 2014, men had higher activity rates than women in all G20 members [8]. In addition, only in Canada and South Africa (2013 data) was the difference between male and female activity rates less than 10 percentage points. In comparison, the EU had a gender activity gap of 11.6 percentage points [9]. The highest gender difference existed in Saudi Arabia with 42 percentage points, followed by Turkey with 37 percentage points and Mexico and Indonesia (2013 data) with 31 percentage points [10]. These big gender gaps correspond to particularly low activity rates of women in these countries [11].
In 2016, the gender employment gap varied by a considerable 25.8 percentage points across Member States. In addition, eight countries reported a widening of the gender employment gap in the past five years, by up to 3.5 percentage points.
The four countries with the biggest gap in 2016 also had employment rates of women below 60 %. However, the gender gap in the Czech Republic reflected a particularly high male employment rate. In addition, Finland and Lithuania had similar female employment rates, but ranked very differently with regard to gender employment gap.
Gender pay gap in unadjusted form
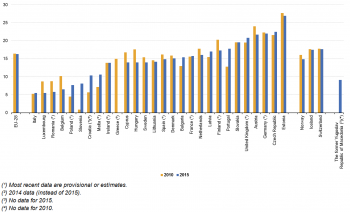
Women’s gross hourly earnings were on average 16.3 % lower than those of men in 2015. The situation has not improved significantly since 2010.

(% of average gross hourly earnings of male)
Source: Eurostat online data code (sdg_05_20)
(% of average gross hourly earnings of male)
Source: Eurostat online data code (sdg_05_20)
The gender pay gap in unadjusted form represents the difference between average gross hourly earnings of male paid employees and of female paid employees as a percentage of average gross hourly earnings of male paid employees. The indicator has been defined as unadjusted because it gives an overall picture of gender inequalities in terms of pay and measures a concept which is broader than the concept of equal pay for equal work. A part of the earnings difference can be explained by individual characteristics of employed men and women such as level of education or position and by sectoral and occupational gender segregations. The gender pay gap is based on the methodology of the structure of earnings survey (SES) [12], which is carried out every four years. The most recent reference years available for the SES are 2010 and 2014. Eurostat based the gender pay gap for these years on this survey. For the intermediate years (2011–2013 and 2015–2017), Member States provided Eurostat with gender pay gap estimates benchmarked to the SES results.
In 2015, women's gross hourly earnings were on average 16.3 % below those of men in the EU. The gender pay gap in 2015 was still similar to the 2010 gap. There are various reasons for the existence and size of a gender pay gap such as the kind of jobs held by women in terms of sectors or occupations, consequences of breaks in career or part-time work due to childbearing and decisions in favour of family life. Thus, the pay gap is linked to a number of legal, social and economic factors which go far beyond the single issue of equal pay for equal work.
In 2015, the gender pay gap was generally much lower for new labour market entrants and tended to widen with age. In all Member States, except Spain, the gender pay gap in the financial and insurance activities was higher than in the business economy as a whole. The majority of EU countries also recorded higher gender pay gaps in the private sector than in the public sector.
A slowdown in pay convergence can also be noticed in the OECD [13]. The data available refer to median wages of full-time employees in 2010, thus a direct comparison with the numbers in this chapter is not possible. On average, OECD countries had a gender pay gap of about 16 % among full-time employees in 2010, and the gap increased with age and during childbearing. In many OECD countries, the wage gap at the top of the earnings distribution was also wider than at the median point.
Across Member States, the gender pay gap varied considerably in 2015, by 21.4 percentage points. In addition, 11 countries reported a widening of the gender pay gap in the past five years, by up to 7.2 percentage points. Between countries, the proportion of women working and their characteristics differ significantly, particularly because of institutions and attitudes governing the balance between private and work life, which have an impact on the careers and thus the pay of women [14].
Inactive population due to caring responsibilities
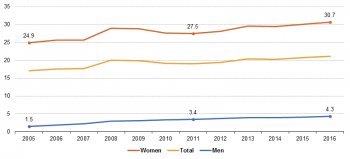
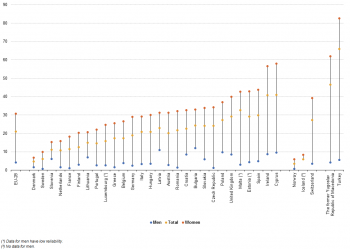
Caring responsibilities were by far the main reason for inactivity among women in 2016. The gender gap has increased considerably since 2005.
(% of inactive population aged 20 to 64)
Source: Eurostat online data code (sdg_05_40)
(% of inactive population aged 20 to 64)
Source: Eurostat online data code (sdg_05_40)
The economically inactive population comprises individuals that are not actively seeking work, so they are neither employed nor unemployed and considered to be outside the labour force. This definition used in the European Union Labour Force Survey (EU-LFS) is based on the guidelines of the International Labour Organization (ILO) [15]. While several reasons may exist why somebody is not seeking employment, only the main one is considered. Inactivity due to caring responsibilities refers to the reasons ‘looking after children or incapacitated adults’ and ‘other family or personal responsibilities’. In this section, data are presented on the share of inactive people aged 20 to 64 stating that their main reason for being inactive was caring responsibilities.
Inactivity due to caring responsibilities was the main reason for women not being part of the labour force, with almost every third women (30.7 %) reporting this reason in 2016. In contrast, only 4.3 % of inactive men reported to be so due to caring responsibilities. For them, the main reasons for being inactive were illness or disability (26.4%), retirement (25.1 %) or being in education or training (21.2 %).
The share of men out of the labour force due to caring responsibilities steadily increased between 2005 and 2016. However, as the share of inactive women due to caring responsibilities increased even more over the same period, the gender gap increased from 23.4 percentage points in 2005 to 26.4 percentage points in 2016.
In 2016, there were considerable differences among the EU countries with regard to inactivity due to caring responsibilities. The share of inactive women due to caring responsibilities varied between 6.9 % and 58.0 % for EU countries and the share of men between 0.7 % and 12.0 %. The gender gap also varied considerably and was generally higher for countries where more inactive women stated that caring responsibilities was the main reason. The gender gap was nine times higher in the EU country with the most women out of the labour force due to caring responsibilities than in the country with the fewest. Childcare services have shown to strongly influence the participation of women in the labour market [16].
Seats held by women in national parliaments and governments
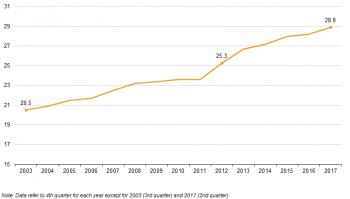
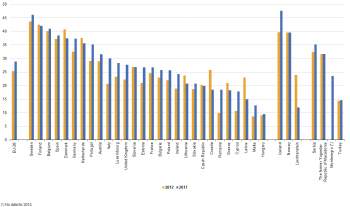
Less than one in three seats in national parliaments was held by women in 2017, but the share has steadily increased since 2003.
(% of seats)
Source: Eurostat online data code (sdg_05_50)
(% of seats)
Source: Eurostat online data code (sdg_05_50)
The national parliament is the national legislative assembly, consisting of one or two chambers/houses. The indicator presented here refers to the proportion of women in national parliaments in both chambers (lower house and an upper house, where relevant). The count of members of a parliament includes the president/speaker/leader of the parliament [17]. The data presented in this section stem from the European Institute for Gender Equality Gender Statistics Database.
Women held 28.9 % of seats in national parliaments in the EU in the second quarter of 2017. The share has increased almost steadily since 2003, when women accounted for about one-fifth of members in national parliaments. However, the share of men in national parliaments is still considerably higher across the EU as a whole and there was no single EU country where women held more seats than men.
The EU average was higher than the global average. The global average proportion of women holding seats in parliaments was 23.3 % in 2016, representing an increase of six percentage points over the past decade [18]. Factors contributing to this under-representation include that women are seldom leaders of major political parties, which are instrumental in forming future political leaders, or gender norms and expectations reducing the pool of female candidates for selection as electoral representatives. The share of female members of government (senior and junior ministers) in the EU increased from 23.3 % in 2003 to 27.7 % in 2017. The number of female presidents and prime ministers in EU countries was also higher in 2017 than in 2003. In 2017, there were three female heads of government (10.7 %) in comparison to none in 2003. In the time period considered, the share of female heads of government was never higher than 14.3 %, meaning that there were never more than four women in this executive position at the same time.
Women were also under-represented in political leadership positions worldwide. The number of female heads of state or governments has increased over the past 20 years, but women in these positions still remain a minority [19]. As of March 2015, there were 19 countries with a female head of state or government, a slight improvement compared to 12 female heads of state or government in 1995. In addition, only 18 % of appointed ministers were women in 2015, and they were usually tasked with social issues [20].
The share of seats held by women in national parliaments varied considerably between EU countries in 2017. In Sweden, almost half of the seats were held by women, which was only outperformed by the EFTA country Iceland. In Hungary, the share of women in parliaments was almost five times lower. Between 2012 and 2017, the proportion of seats held by women in national parliaments increased in the majority of EU countries. However, the proportion decreased in eight EU countries, by up to 7 percentage points. Effectively designed electoral gender quotas [21] as well as proportional representation systems [22] may explain the higher representation of women in some cases.
Positions held by women in senior management
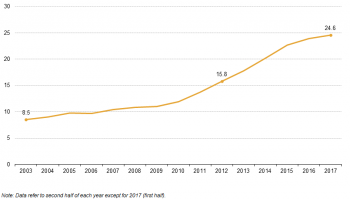
Despite a steady increase since 2003, less than a quarter of the board members of the largest listed companies were women in 2017.
(% of board members)
Source: Eurostat online data code (sdg_05_60)
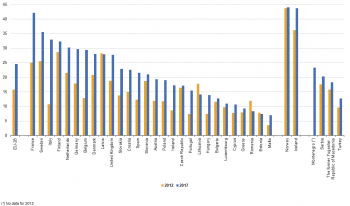
(% of board members)
Source: Eurostat online data code (sdg_05_60)
The indicator ‘proportion of women in senior management’ positions measures the share of female board members in the largest publicly listed companies. Publicly listed means that the shares of the company are traded on the stock exchange. The ‘largest’ companies are taken to be the members (max. 50) of the primary blue-chip index, which is an index maintained by the stock exchange and covers the largest companies by market capitalisation and/or market trades. Only companies which are registered in the country concerned are counted [23]. Board members cover all members of the highest decision-making body in each company (such as chairperson, non-executive directors, senior executives and employee representatives, where present). The highest decision-making body is usually termed the supervisory board (in case of a two-tier governance system) or the board of directors (in a unitary system) [24]. The data presented in this section stem from the European Institute for Gender Equality Gender Statistics Database.
The share of women in boards of the largest listed companies was 24.6 % in 2017. In the years between 2003 and 2017, there was an almost steady increase of a total of 16.1 percentage points. However, the numbers mean that three out of four board members of largest listed companies are still men.
The data on board members provide evidence of the positive impact of legislative action on the issue of female representation in boards [25].
The share of women is even lower if the members of the second highest decision-making body of the largest listed companies (such as management board in case of a two-tier governance system and executive/management committee in a unitary system) are considered in addition to board members. In 2017, the share of female members in the two highest decision-making bodies was 15.6 % across the EU; in 2012, it was 10.4 %. The fact that senior management positions are more likely to be held by men is one of the reasons for the gender pay gap [26].
At the global level, data confirm that the ‘glass ceiling’ exists in the largest corporations and prevents women rising beyond a certain level in the hierarchy. In 2014, less than 4 % of CEOs of the world’s 500 leading corporations were women [27]. Data provided in 2014 show that the share of women among corporate board members of large companies was also very low. Among countries for which data exist, Norway had the highest proportion of seats held by women on executive boards with 41 % [28]. Qatar, Saudi Arabia and the United Arab Emirates had 1 % or fewer women on corporate boards [29].
The share of female board members varied considerably between EU countries. In 2017, France was the closest to parity in boards with 42.1 % female members. In the same year, Malta had only 7.0 % female board members. In countries with binding legislative measures (Belgium, Germany, France and Italy), the proportion of female board members increased by 23.8 percentage points between 2010 and 2016; in countries without such measures, the increase was only 7.6 percentage points in the same time span [30].
The shares of women varied also considerably when taking into account not only the board members but also the members of the second highest decision-making body of the largest listed companies. In 2017, women made up almost one-third of members in Estonia (31.7 %) but only 5.5 % in Austria. Between 2012 and 2017, the share of women in these positions increased in all but two EU countries.
It is interesting to note that Estonia had the highest share of women when considering the members of both decision-making body in 2017, but had the second lowest share of female board members in 2017. Another interesting case is Italy that was among the countries with the lowest share of women considering members of both decision-making bodies in 2017 (10.1 %), but had the third highest share of female board members in 2017.
Context
<context of data collection and statistical results: policy background, uses of data, …>
See also
- Name of related Statistics Explained article
- Name of related online publication in Statistics Explained (online publication)
- Name of related Statistics in focus article in Statistics Explained
- Subtitle of Statistics in focus article=PDF main title - Statistics in focus x/YYYY
Further Eurostat information
Data visualisation
- Regional Statistics Illustrated - select statistical domain 'xxx' (= Agriculture, Economy, Education, Health, Information society, Labour market, Population, Science and technology, Tourism or Transport) (top right)
Publications
Publications in Statistics Explained (either online publications or Statistics in focus) should be in 'See also' above
Main tables
- Title(s) of second level folder (if any)
- Title(s) of third level folder (if any)
Database
- Title(s) of second level folder (if any)
- Title(s) of third level folder (if any)
Dedicated section
Methodology / Metadata
More detailed information on EU SDG indicators for monitoring of progress towards the UN Sustainable Development Goals (SDGs), such as indicator relevance, definitions, methodological notes, background and potential linkages, can be found on page xx-xx of the publication ’ Sustainable development in the European Union — Monitoring report on progress towards the SDGs in an EU context (2017 edition)’.
- Crime and criminal justice (ESMS metadata file — crim_esms)
- Title of the publication
Source data for tables, figures and maps (MS Excel)
Other information
<Regulations and other legal texts, communications from the Commission, administrative notes, Policy documents, …>
- Regulation (EC) No 1737/2005 (generating url [http://eur-lex.europa.eu/LexUriServ/LexUriServ.do?uri=CELEX:32005R1737:EN:NOT Regulation (EC) No 1737/2005]) of DD Month YYYY on ...
- Directive 2003/86/EC (generating url [http://eur-lex.europa.eu/LexUriServ/LexUriServ.do?uri=CELEX:32003L0086:EN:NOT Directive 2003/86/EC]) of DD Month YYYY on ...
- Commission Decision 2003/86/EC (generating url [http://eur-lex.europa.eu/LexUriServ/LexUriServ.do?uri=CELEX:32003D0086:EN:NOT Commission Decision 2003/86/EC]) of DD Month YYYY on ...
<For other documents such as Commission Proposals or Reports, see EUR-Lex search by natural number>
<For linking to database table, otherwise remove: {{{title}}} ({{{code}}})>
External links
Notes
- European Union Agency for Fundamental Rights (2017), Survey data explorer – Violence against women survey, Physical and/or sexual violence by a partner or a non-partner since the age of 15. ↑
- European Union Agency for Fundamental Rights (2014), Violence against women: an EU-wide survey, Main results, Publications Office of the European Union, Luxembourg, p. 25. ↑
- European Union Agency for Fundamental Rights (2014), Violence against women: an EU-wide survey, Main results, Publications Office of the European Union, Luxembourg, p. 25–26, 32. ↑
- Ibid. ↑
- Ibid. ↑
- European Commission’s Expert Group on Gender and Employment Issues (2009), The provision of childcare services: A comparative review of 30 European countries, Office for Official Publications of the European Communities, Luxembourg, p. 23-24. ↑
- European Commission (2009), Economic Crisis in Europe: Causes, Consequences and Responses, Directorate-General for Economic and Financial Affairs, p. 36. ↑
- Eurostat (2016), The EU in the world, 2016 edition, Publications Office of the European Union, Luxembourg, p. 67–68. ↑
- Eurostat (2016), The EU in the world, 2016 edition, Publications Office of the European Union, Luxembourg, p. 67–68. ↑
- Eurostat (2016), The EU in the world, 2016 edition, Publications Office of the European Union, Luxembourg, p. 68. ↑
- Eurostat (2016), The EU in the world, 2016 edition, Publications Office of the European Union, Luxembourg, p. 68. ↑
- According to Regulation (EC) No 530/1999, the new unadjusted gender pay gap is based on the methodology of the structure of earnings survey (SES) from reference year 2006 onwards. ↑
- OECD (2012), Closing the Gender Gap: Act Now, OECD Publishing, p. 166–169. ↑
- Eurostat (2017), Gender pay gap statistics, Statistics Explained. ↑
- See also ILO (2015), Key Indicators of the Labour Market — 13. Persons outside the labour force, ILO, Geneva ↑
- European Commission (2015), Labour Market Participation of Women, European Semester Thematic Fiche, S. 4. ↑
- European Institute for Gender Equality (2017), National parliaments: presidents and members, Metadata. ↑
- European Parliamentary Research Service and European University Institute (2017), Empowering women in the EU and beyond, p. 1. ↑
- Only elected Heads of State have been considered. Countries with Kings or Queens, Governor-Generals or Sultans are excluded in the count of Heads of State. ↑
- UNSTAT (2015), Power and Decision-Making: Politics and governance, p. 2. ↑
- L. Freidenvall, D. Dahlerup and E. Johansson (2013), Electoral Gender Quota, Systems and their Implementation in Europe, Brussels, p. 5. ↑
- European Parliament (2017), Women in parliaments, At a glance, Infographic, p. 2. ↑
- Therefore, the number of companies covered by the data may be lower than the number of constituents in the relevant blue-chip index. ↑
- European Institute for Gender Equality (2017), Largest listed companies: presidents, board members and employee representatives, Metadata. ↑
- European Commission (2017), 2017 Report on equality between women and men in the EU, Publication Office of the European Union, Luxembourg, p. 29. ↑
- European Commission (2017), Employment and Social Developments in Europe, Annual Review 2017, Publications Office of the European Union, Luxembourg, p. 34. ↑
- United Nations, Department of Economic and Social Affairs, Statistics Division (2015), The World’s Women 2015: Trends and Statistics, p. 138. ↑
- United Nations, Department of Economic and Social Affairs, Statistics Division (2015), The World’s Women 2015: Trends and Statistics, p. 136. ↑
- United Nations, Department of Economic and Social Affairs, Statistics Division (2015), The World’s Women 2015: Trends and Statistics, p. 136. ↑
- European Commission (2017), 2017 Report on equality between women and men in the EU, Publication Office of the European Union, Luxembourg, p. 29. ↑
[[Category:<subtheme category name(s)>|SDG 5 - Gender equality (statistical annex)]] [[Category:<statistical article>|SDG 5 - Gender equality (statistical annex)]]


