Archive:Extra-EU trade in manufactured goods
- Data from April 2017. Most recent data: Further Eurostat information, Main tables and Database. Planned update: April 2018
This article focuses on the structure and evolution of the European Union (EU) international trade in manufactured goods: imports and exports at EU level.
The Standard international trade classification (SITC) distinguishes four main categories (sections) of manufactured goods:
- chemicals (SITC 5);
- manufactured goods classified chiefly by material (SITC 6);
- machinery and vehicles (SITC 7);
- miscellaneous manufactured articles (SITC 8).
Sections 6 and 8 are often grouped together as 'other manufactured goods'. This grouping is also used in this article.
Main statistical findings
Manufactured goods are the main type of goods traded by the EU. In 2016 they made up 83 % of all EU exports. The three categories of manufactured goods: 'Chemicals', 'Machinery and vehicles' and 'Other manufactured goods' had shares of 18 %, 42 % and 23 % respectively. Regarding EU imports the share of manufactured goods was lower than for exports with 68 %. The shares for the categories 'Machinery and vehicles' (32 %) and 'Chemicals' (11 %) were lower than in exports, while the share for 'Other manufactured goods' (26 %) was a little higher than in exports.
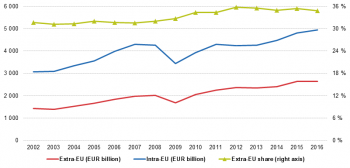
Figure 1 shows that intra-EU trade has consistently been about twice as high as extra-EU trade since 2002, although the share of extra-EU trade has been around 3 percentage points higher in the last years compared to the beginning of the period. During the financial crisis of 2008 both imports and exports decreased, without their relative shares changing very much.
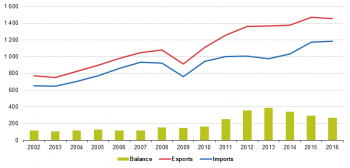
Since 2002 imports and exports have nearly doubled in value (see Figure 2). Between 2002 and 2013 exports grew somewhat more than imports, leading to a record trade balance of EUR 388 billion in 2013, before dropping again to EUR 269 billion in 2016. Between 2015 and 2016 exports fell slightly for the first time since 2009, while imports were almost stable during this period.
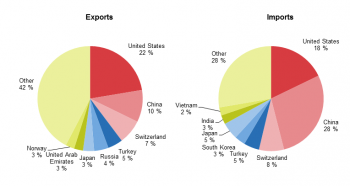
Five of the eight main partners in exports of ’manufactured products’ are also among the eight main partners in imports (see Figure 3). These are the United States, China, Switzerland, Turkey and Japan. The remaining partners in exports among the top-eight are Russia, the United Arab Emirates and Norway, while in imports we find three Asian countries, namely South Korea, India and Vietnam.
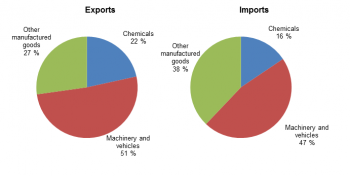
The three sectors that we distinguish in manufactured products have different shares in extra-EU exports and imports (see Figure 4). Both ’Machinery and vehicles’ and ’Chemicals’ have higher shares in exports while ’Other manufactured goods’ has a higher share in imports. Each of these three sectors will be discussed in separate paragraphs below.
The three sectors that we distinguish in manufactured products have different shares in extra-EU exports and imports (see Figure 4). Both 'machinery and vehicles' and 'chemicals' have higher shares in exports while 'other manufactured goods' has a higher share in imports. Each of these three sectors will be discussed in separate paragraphs below.
Chemicals
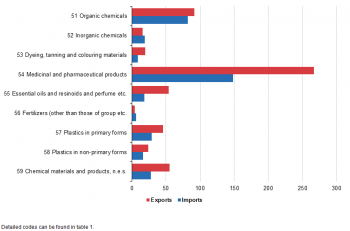
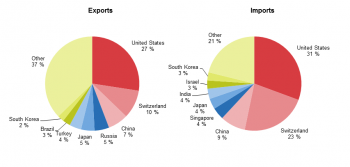
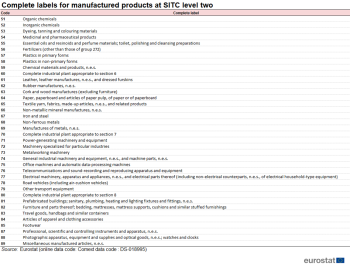
The chemicals sector (SITC Section 5) contains various chemical goods such as organic chemicals, inorganic chemicals, plastics and pharmaceutical products. The various categories can be found in Figure 5. The largest category in exports, imports and trade balance is 'medicinal and pharmaceutical products'. In almost all categories the EU has a trade surplus with the only exceptions in the smaller categories of 'inorganic chemicals' and 'fertilizers' (see figure 5). The United States (27 %), Switzerland (10 %) and China (7 %) were the EU's main export destinations for 'Chemicals'. The United States (31 %), Switzerland (23 %) and China (9 %) were also the top three importers for 'Chemicals' to the EU. In imports the market is more concentrated than in imports with the top three accounting for more than 60 % of imports and the top eight for almost 80 %. (see Figure 6)
Machinery and vehicles
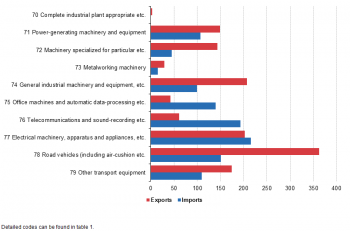
’Machinery and vehicles’ is the most important individual product group in the international trade of the EU, accounting for 43 % of total EU exports and 32 % of total EU imports in 2016. The group records also the largest surplus in EU trade, with EUR 193 billion in 2016.
The main exported product within the group is ’Road vehicles’ (EUR 362 billion), followed at a distance by ’General industrial machinery’ (EUR 207 billion) and ’Electrical machinery’ (EUR 202 billion) (See Figure 7). Regarding imports, the top three categories are closer to each other. They are ’Electrical machinery' (EUR 215 billion), ’Telecommunications equipment’ (EUR 193 billion) and ’Road vehicles’ (EUR 151 billion).
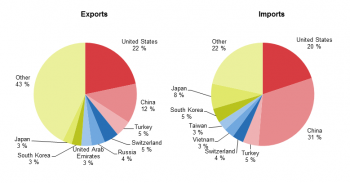
The United States was the biggest destination country of EU exports of machinery and vehicles in 2016. Its share declined from 29 % to 17 % between 2002 and 2013 but climbed back to 22 % in 2016 (See Figure 8). China (12 %) was the only other export destination with a share of more than 10 %. China (31 %) and the United States (20 %) were also the top two countries for imports and accounted together for more than half of all imports of machinery and vehicles into the EU.
Other manufactured goods
‘Other manufactured goods’ (SITC Sections 6 and 8) is a heterogeneous group consisting of manufactured goods which range from basic semi-manufactured goods, such as leather, rubber, wood, paper, textiles, metals, building fixtures and fittings to more labour-intensive products, like clothes, shoes and accessories, scientific instruments, clocks, watches and cameras.
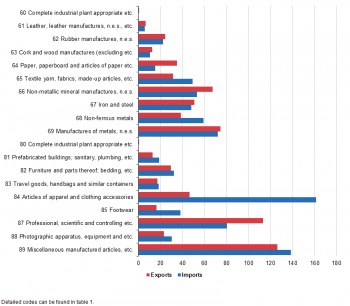
The relative size of exports and imports in product groups differs to some extent. The EU has a large trade deficit in 'Clothing' and 'Footwear' and 'Non-ferrous metals' and a sizeable trade surplus in 'Professional, scientific and controlling equipment', 'Non-metallic mineral manufactures' and 'Paper and related products'. (see Figure 9).
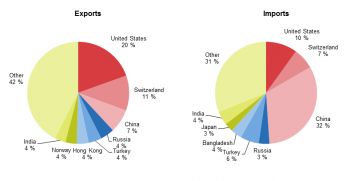
Regarding 'Other manufactured products' China was the largest supplier to the EU in this product group, with a share of 32% in 2016. Other important suppliers included the United States (10 %), Switzerland (7 %) and Turkey (6 %). The main destinations for exports were the United States (20 %), Switzerland (11 %) and China (7 %), followed by Russia, Turkey, Hong Kong, Norway and India with a share of 4 % each.
Data sources and availability
Data sources
EU data come from Eurostat’s COMEXT database. COMEXT is the Eurostat reference database for international trade. It provides access not only to both recent and historical data from the EU Member States but also to statistics of a significant number of third countries. International trade aggregated and detailed statistics disseminated from Eurostat website are compiled from COMEXT data according to a monthly process. Because COMEXT is updated on a daily basis, data published on the website may differ from data stored in COMEXT in case of recent revisions.
EU data are compiled according to community guidelines and may, therefore, differ from national data published by Member States. Statistics on extra-EU trade are calculated as the sum of trade of each of the 28 Member States with countries outside the EU. In other words, the EU is considered as a single trading entity and trade flows are measured into and out of the area, but not among Member States within it the EU.
Unit of measure
Trade values are expressed in billions (109) of euros. They correspond to the statistical value, i.e. to the amount which would be invoiced in case of sale or purchase at the national border of the reporting country. It is called a FOB value (free on board) for exports and a CIF value (cost, insurance, freight) for imports.
Context
The EU is the world's biggest exporter of manufactured goods, and is a global market leader for high-quality products. Thanks to some of its key assets such as chemicals, pharmacy products, motor vehicles and non-electrical machinery, the European Union has a substantial trade surplus for manufactured products.
See also
- Extra-EU trade in goods
- Extra-EU trade in primary goods
- Extra-euro area trade in goods
- International trade in goods
Further Eurostat information
Data visualisation
Main tables
- International trade data (t_ext)
- International trade long-term indicators (t_ext_lti)
- International trade short-term indicators (t_ext_sti)
Database
- International trade data (ext)
- International trade long-term indicators (ext_lti)
- International trade short-term indicators (ext_sti)
- International trade detailed data (detail)
Dedicated section
Methodology / Metadata
- International trade in goods statistics - background
- International trade in goods (ESMS metadata file — ext_go_esms)
- User guide on European statistics on international trade in goods
Source data for tables and figures (MS Excel)
Other information
Legal background
- Regulation (EC) No 471/2009 of 6 May 2009 on Community statistics relating to external trade with non-member countries
- Regulation (EU) No 92/2010 of 2 February 2010 implementing Regulation (EC) No 471/2009, as regards data exchange between customs authorities and national statistical authorities, compilation of statistics and quality assessment
- Regulation (EU) No 113/2010 of 9 February 2010 implementing Regulation (EC) No 471/2009 , as regards trade coverage, definition of the data, compilation of statistics on trade by business characteristics and by invoicing currency, and specific goods or movements.
