Archive:Switzerland-EU - international trade in goods statistics
- Data extracted in Month YYYY. Most recent data: Further Eurostat information, Main tables and Database. Planned article update: (dd) Month YYYY(, hh:00).
This article provides a picture of the trade in goods between the European Union (EU) and the Switzerland. It analyses the type of goods exchanged between the two economies and the shares of each EU Member State in those exchanges.
Source: Eurostat (Comext) and IMF
Source: Eurostat (Comext) and IMF
Source: Eurostat (Comext) and IMF
Source: Eurostat (ext_lt_mainEU)
Source: Eurostat Comext table DS-018995
Source: Eurostat Comext table DS-018995
Source: Eurostat Comext table DS-337917
Source: Eurostat Comext table DS-337917
Source: Eurostat Comext table DS-018995
Source:Eurostat, Trade by Enterprise Characteristics (TEC)
Main statistical findings
- In 2015, Switzerland is the tenth largest exporter of goods in the world with a share of 3 % of world exports and the 18th largest importer with a share of 1.4 % of world imports.
- Switzerland is the 3rd largest importer of goods from the EU behind China and the USA and the 5th largest exporter of goods to the EU.
- In 2011, the EU recorded the highest trade surplus with Switzerland recorded over the last 10 years. Since then it dropped from of € 92,7 billion to 61.8 billion Euro in 2015.
- Manufactured goods dominate the exports of goods from the EU to Switzerland. Energy is the most imported product group from Switzerland to the EU, accounting for over two-thirds of all Swiss imports to the EU.
- Among EU Member States, Germany is both the largest importer from and exporter to Switzerland.
- In 2015, the highest deficits with Switzerland were recorded for the Netherlands (€13.6 bn) and Poland (€7.5 bn). The highest surpluses were recorded by Slovenia (€0.6 bn) and Austria (€0.4 bn).
- Large EU enterprises (250+ employees) have the highest share in value of trade with Switzerland, while the micro enterprises (0-10 employees) are largest group of enterprises in EU-Switzerland trade
EU and Switzerland in world trade in goods
Figure 1 shows that four largest exporters account for almost half of the world exports: first China (18 %) followed by the EU (15 %), the USA (12 %) and Japan (5 %). The same four also account for almost half of the world imports but in different order: first the USA (16 %) followed by the EU (14 %), China (12 %) and Japan (5 %).
Figures 2a and 2b focus on the EU and Switzerland trade over the period 2005-2015. After a fall in 2009 due to the economic crisis, both economies recovered quickly. However whereas the EU's exports reached a new high in 2015, Swiss exports have declined during the last four years. Since 2005 the EU's imports in absolute term grew from 1 184 billion to 1727 billion Euro but lost 3.98 percentage points in its share of world imports. During that same period Swiss imports grew from 78 billion to 164 billion Euro , gaining 0.15 percentage points in its share of world imports.
Switzerland a larger exporter to than importer from the EU
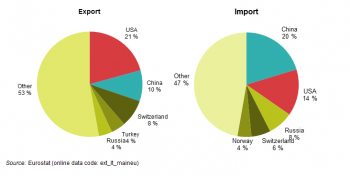
Figure 3 shows that in 2015, Switzerland was the 5th destination of the EU exports with a share of 4 % in total extra-EU exports, slightly less than Turkey. When considering EU imports, Switzerland was the third most important partner with a share of 8 % in total extra-EU imports, well behind China (20 %) and the USA (14 %).
The EU has been recording a trade deficit with Switzerland over the whole period 2005-2015 (see Figure 4). In this time span, trade between the two economies had a low in 2009, but quickly regained momentum, peaking in 2012 after which they declined. The patterns for imports and exports are roughly the same. The EU's deficit with Switzerland peaked in 2011 and 2012 around 93 billion Euro but has fallen to 62 billion Euros in 2015.
EU trade with Switzerland largely dominated by manufactured goods and energy
When breaking down imports and exports by SITC [Glossary] groups, the main categories driving the exports to Switzerland are ‘Machinery and vehicles’ (SITC 7), ‘Chemicals’ (SITC 5) and ‘Other manufactured goods’ (SITC 6&8). Together they accounted for around 90 % of the EU exports. In contrast these product groups only account for 17 % of imports from Switzerland which are dominated by "Energy" (see Figure 5).
Figure 6 shows that both imports and exports of the EU to Switzerland of manufactured products increased between 2009 and 2015. However their values are much less than Swiss exports of energy which did not change much in this period.
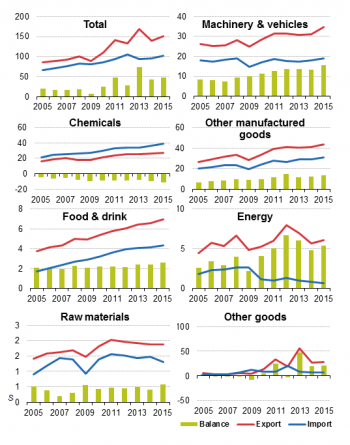
Figure 7 shows the evolution of the EU imports and exports by product category since 2005. The EU has a large trade deficit in "Energy" and smaller but consistent ones in "Raw materials" and "Other goods". In the other four groups the EU has trade surpluses. In "Machinery & vehicles" and "food & drink" these are almost similar to exports, since imports are very low. In "Chemical", and "Other manufactured goods" there are imports but in none of the years since 2005 did these surpass exports.
Figure 8a shows the unit value index or different product groups imported from Switzerland. The lines for the "Total" is clearly dominated by the product group "Energy" in which prices fluctuated wildly with low levels in 2009 and 2015. The index for "Machinery & vehicles" has a more stable path with a gradually increasing trend. In "Raw materials" , "Other manufactured goods" and "Chemicals" there are low levels in in 2010 and 2015. For Food & drink the 2010 dip is also visible but there is no dip in 2015.
Fluctuations can also be seen in the unit value index for exports of energy products to Switzerland although much smaller than in imports. All the other product groups closely follow the general trend (see figure 8b).
Most traded goods: medicaments, motor cars and aircrafts
Figure 9 gives more details about the goods exchanged between the EU and Switzerland, showing the top 20 traded goods in a detailed way (by SITC level 3). Those top 20 goods covered around 60 % of total traded goods in 2015. Ten products among the top-20 belong to the ‘Machinery and transport equipment’ group and four each to "Miscellaneous manufactured products" and "Chemicals and related products". Medicaments are the most traded product followed by motor cars and other motor vehicles. For these two products, the EU records a large trade surplus while Switzerland records a trade surplus for the third and fourth most traded products, namely aircraft (and associated equipment) and non-electric engines and motors.
Another interesting way to look at data is to investigate the export/import ratio of traded goods, in order to better identify the direction taken by flows and specialisation between the two areas. These ratios can be found in the right margin of Figure 9. A ratio of 1 means that the value of goods exported and imported is equal, a ratio below 1 means imports from Switzerland exceed exports, and a ratio above 1 means exports to Switzerland exceed imports. Among the top five products four are energy products in which exports to Switzerland are almost non-existent giving an index value very close to zero. Medicament (284.5) and Motor Cars have high index values.
Germany is the Member States trading most with Switzerland
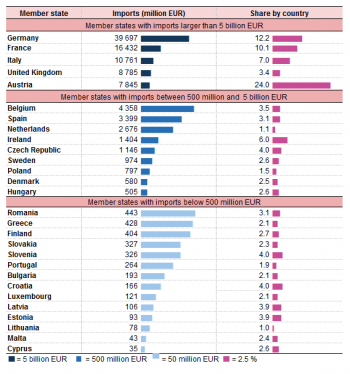
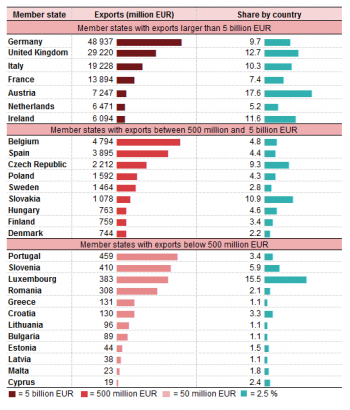
Table 3a shows Member States' imports from Switzerland and the share of the partner Switzerland in national extra-EU imports. Table 3b provides similar information but considering Member States' exports to Switzerland.
The four largest importers of goods from Switzerland in 2015 are Germany, Netherlands, Italy and Poland). Those Member States also are the largest exporters of goods to Switzerland. In both cases Germany is the largest.
Geography plays a large role in trade with Switzerland. The seven countries where the share of Swiss imports is higher than 20 % are all close to Switzerland, they are Poland, Slovakia, Bulgaria, Estonia, Finland, Latvia and Lithuania. Six of these, the exception being Bulgaria, together with Slovenia and the Czech Republic are the only countries for which exports to Switzerland are higher than 10 % of their extra-EU exports.
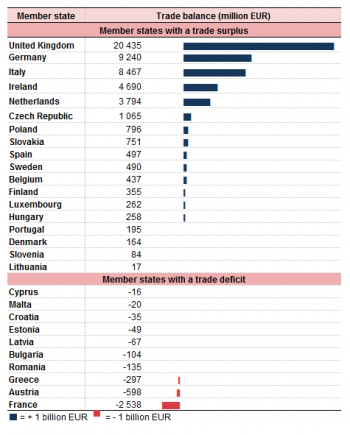
Table 1c shows that all but 5 countries (Slovenia, Austria, Ireland, Latvia and Luxembourg) have a small trade deficit with Switzerland. Their combined surplus is 1.5 billion Euros. Fourteen countries have a deficit which is larger than this combined surplus.
The enterprises trading with Switzerland: activity sector and size in terms of employees
In 2013 there were 28 thousand enterprises in the EU that imported from Switzerland which was 2.5 % of all enterprises that imported from a destination outside the EU. The number of exporters to Switzerland was 130 thousand, which was 15 % of all enterprises which exported to a destination outside the EU.
Figure 10 show how these enterprises were divided over the different size classes. The figure shows that only 22 % of importers and 12 % of exporters were large enterprises while the large majority were SMEs (small or medium sized enterprises). The 22 % share of importers from Switzerland that are large enterprises is much higher than for importer from the USA (9 %) or China (7 %). The exact reason for this is not known but might be related to the high importance of energy products in imports from Switzerland.
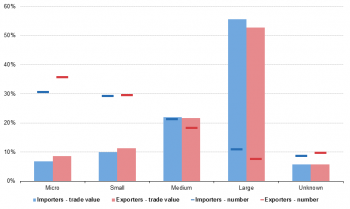
Figure 11 shows that large enterprises, as can be expected, have the highest share in import and export values but the lowest share in number of enterprises. Micro-sized and unknown-sized enterprises are the only ones where the share of number of importers is larger than the share of number of exporters.
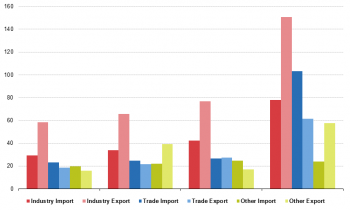
Figure 12 shows the trade with Switzerland according to the main activity sector of the trading enterprises. Three main economic sectors are considered: Industry, Trade and Services. The highest imports are recorded in the trade sector, well ahead of the two other sectors. The highest export are in Industry. As regards the trade balances, the industry sector records a growing surplus while a trade deficit is observed for the two other sectors.
Data sources and availability
This article is based on the international trade in goods statistics provided by the EU-28 Member States to Eurostat. Trade of Croatia is included even for the period prior to joining the EU, i.e. before July 2013.
Data for the EU and its Member States are extracted from COMEXT, Eurostat's reference database for detailed statistics on international trade in goods. Data are collected by the National Statistics Authorities of the Member States and compiled according to a harmonised methodology established by the EU legislation before transmission to Eurostat.
Context
Statistics on the international trade of goods are used extensively by decision makers at an international, EU and national level. Businesses may use international trade data to carry out market research and define their commercial strategy. International trade statistics are also used by EU institutions in their preparation of multilateral and bilateral trade negotiations, for defining and implementing anti-dumping policies, for the purposes of macroeconomic and monetary policies, and in evaluating the progress of the single market, or the integration of European economies.
See also
- Name of related Statistics Explained article
- Name of related online publication in Statistics Explained (online publication)
- Name of related Statistics in focus article in Statistics Explained
- Subtitle of Statistics in focus article=PDF main title - Statistics in focus x/YYYY
Further Eurostat information
Data visualisation
- Regional Statistics Illustrated - select statistical domain 'xxx' (= Agriculture, Economy, Education, Health, Information society, Labour market, Population, Science and technology, Tourism or Transport) (top right)
Publications
Publications in Statistics Explained (either online publications or Statistics in focus) should be in 'See also' above
Main tables
- Title(s) of second level folder (if any)
- Title(s) of third level folder (if any)
Database
Dedicated section
Methodology / Metadata
- International trade in goods statistics - background
- International trade in goods (ESMS metadata file — ext_go_esms)
- User guide on European statistics on international trade in goods
Source data for tables, figures and maps (MS Excel)
Other information
<Regulations and other legal texts, communications from the Commission, administrative notes, Policy documents, …>
- Regulation (EC) No 1737/2005 (generating url [http://eur-lex.europa.eu/LexUriServ/LexUriServ.do?uri=CELEX:32005R1737:EN:NOT Regulation (EC) No 1737/2005]) of DD Month YYYY on ...
- Directive 2003/86/EC (generating url [http://eur-lex.europa.eu/LexUriServ/LexUriServ.do?uri=CELEX:32003L0086:EN:NOT Directive 2003/86/EC]) of DD Month YYYY on ...
- Commission Decision 2003/86/EC (generating url [http://eur-lex.europa.eu/LexUriServ/LexUriServ.do?uri=CELEX:32003D0086:EN:NOT Commission Decision 2003/86/EC]) of DD Month YYYY on ...
<For other documents such as Commission Proposals or Reports, see EUR-Lex search by natural number>
<For linking to database table, otherwise remove: {{{title}}} ({{{code}}})>
External links
Notes
[[Category:<Subtheme category name(s)>|Name of the statistical article]] [[Category:<Statistical article>|Name of the statistical article]]
Delete [[Category:Model|]] below (and this line as well) before saving!
