Archive:Material deprivation statistics – financial stress and lack of durables
Data extracted in July 2016.
This article is part of the Eurostat online publication Living conditions providing statistics on material deprivation in the European Union (EU) with focus on intra-household sharing of resources in 2014. The publication presents a brief analysis of several different material deprivation items (as part of the 2014 EU-SILC ad-hoc module) which relate to households (as a whole), adults (people aged[1] 16 and over) and children (all household members aged between 1 and 15). Observed items, among others, are related to financial stress and durables as well as leisure and social activities as part of a broader perspective of social inclusion.
Even though it is tempting to assume that a change of income for a household will affect all its members to the same extent, the reality could differ. By only using household level indicators and by attributing them equally to each member of the household, it could possibly lead to unobserved child poverty and child deprivation as well as inequalities for other groups (based on age or gender). In order to shed some light on the intra-household transfers and within-household differences in living conditions, the EU-SILC included a special ad-hoc material deprivation module (for the first time in 2009, and revised in 2014).
The items related to children’s material deprivation are collected for the whole group of children[2] with one very specific rule: If at least one child does not have the item in question, the whole group of children in the household is assumed to not have the item either. On the other hand, information on basic needs as well as leisure and social activities for adults is provided for each household member aged 16 and over.
The analyses used for the article cover all EU Member States and several non-EU Member States.
Source: Eurostat (EU-SILC module 2014 data - variable PD020 - weighted frequences and ilc_mddd11)
Main statistical findings
Child deprivation
In 2014, 27.4% of children aged below 16 in the EU-28 were at risk of poverty or social exclusion (AROPE) compared with 25.5% of adults aged between 16 and 64, and 17.7% of the elderly (aged 65 or over).
The main EU-SILC indicators (Europe 2020 target on poverty and social exclusion) measure living conditions using general indicators of the household as a whole and are based on the assumption that the resources are equally distributed to all household members.
This part of the article focuses on two material deprivation items – meal and lack of space, and on the household’s (in)ability to afford them for all children and (or) for all its members. Due to the specific characteristics of the collected information (i.e. the number of variables and breakdown details) and missing values, some households (and their members) are excluded from the analysis.
Food-deprivation
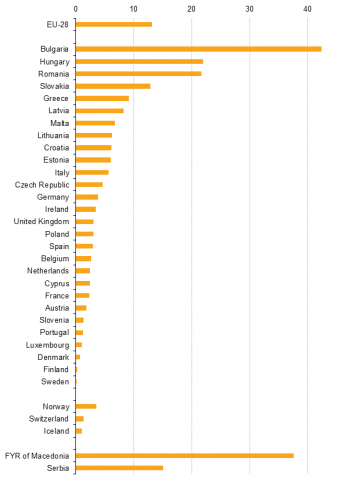
In 2014, based on the EU-SILC survey, 13.2% of children were living in households which could not afford a meal[3] for all children at least once a day.
Figure 1 shows that the highest proportions of children, among the EU Member States, who lived in households which could not afford one meal per a day for all children, were recorded in Bulgaria (42.4%), Hungary (22.0%) and Romania (21.6%). The lowest proportions of children who lived in such households were in Sweden, Finland and Denmark (0.0%, 0.2% and 0.7% respectively).
Moreover, 14.9% of children in the EU lived in households which could not afford a meal for all its members at least every second day and 13.2% of children in households which could not afford a meal for all children every day.
Lack of space
In 2014, 40.7% of children in the EU lived in overcrowded[4] households. Also, 14.1% of children lived in households which could not afford a suitable place for them to study or do homework.
In Romania and Hungary, over 80% (81.8% and 81.4% respectively) of children lived in overcrowded households which were also at risk of poverty. Moreover, in Romania, around 64.3% of children lived in overcrowded households which were not at risk of poverty. The lowest proportions of children (below 5%) who lived in overcrowded households were in Belgium (2.7%), Cyprus (2.9%), Ireland and Norway (4.1% both).
Among the EU Member States, Bulgaria was the country with the highest percentage (64.0%) of children who lived in households at risk of poverty and did not have space[5] to study due to financial reasons. On the contrary, Finland had the lowest share (3.4%) of children who lived in households with the aforementioned characteristics.
The proportions of children who lived in households which were not at risk of poverty but who could still not afford a space for school-age children were relatively high for Bulgaria (28.1%), Romania (18.0%) and Spain (17.4%). However, in the majority of the EU and non-EU Member States less than 4% of children fell within this category.
Since the shares of children who lived in overcrowded households for most EU-28 countries were relatively high (at EU28 level - 36.5% in households not at risk of poverty and 54.6% in households at risk of poverty), the aim of the analysis was to see if the lack of space for studying and doing homework for school-aged children is linked to a lack of space in general.
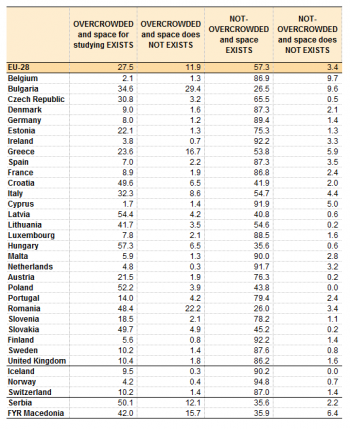
Analysis showed that the majority of people lived in households which were not overcrowded and where suitable space existed. However, in Belgium and Bulgaria almost one in ten of households was not overcrowded but still did not have space to study for children (see Table 1). The opposite was observed in Hungary, Latvia and Poland, where more than half of the people lived in overcrowded households but with enough space for school-aged children to study or do their homework (57.3%, 54.4% and 52.2% respectively).
Inter- and intra-generational differences
One of the main EU-SILC indicators – AROPE, showed that young persons (under 25) present the most vulnerable group.
The aim of this part of the article is to apply a broader perspective of material deprivation, i.e. the inability to afford a selection of items (goods or services) and if this pattern still exists when we observe it at personal level.
To adequately measure children’s material deprivation, it is necessary to look not only at the material deprivation that solely affects children but also at the material deprivation that affects the entire household as this is likely to impact their living conditions. Consequently, the aim of this part of the analysis is therefore to apply a broader perspective of material deprivation using both individual and household level.
New clothes and two pairs of shoes
In 2014, 16.7% of people in the EU aged 16 and over could not afford to replace worn-out clothes by some new (not second-hand) ones[6] and 18.9% of people of the same age could not afford two pairs of properly fitting shoes (including a pair of all-weather shoes)[7].
The highest proportion of people who could not afford to replace worn-out clothes with new ones was observed in Bulgaria (42.4%), Romania (31.6%) and Hungary (29.6%). The lowest share was found in Greece (1.3%) and Sweden (2.2%).
Some countries had high shares of people who could not afford new clothes due to both financial and non-financial reasons. For example more than 10% of all people in Italy, Croatia and Slovakia could not replace clothes for other (non-financial) reasons (13.4%, 12.9% and 11.5% respectively).
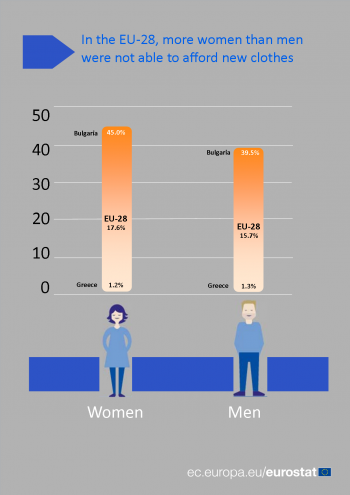
Infograph 1 shows the percentages of people in the EU aged 16 and over who could not afford new clothes, by gender. In almost all of the EU-28 Member States, women were less likely to be able to replace clothes than men regardless of the reasons (financial or non-financial). More precisely, at EU28 level – 17.6% women and 15.7% of men were not able to afford new clothes. Only in Spain and Ireland, the percentage of men was slightly higher than the percentage of women.
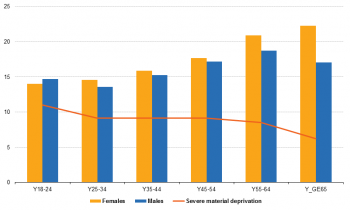
Figure 2 shows both intra-generational and gender differences. The analysis showed that the severe material deprivation rate at household level for the age group 18-24 was the highest, while the age group 65 and over had the lowest rate. Yet the largest proportion of persons aged 18 and over could afford new clothes. People aged 65 and over were more vulnerable than the age group 18-24 and had the lowest proportion of those who could afford to replace worn out clothes with new ones.
When it comes to gender differences, for all age groups except for people aged 18-24, women were less likely to afford new clothes than men. The proportion of women who could not afford new clothes was slowly increasing with age. The proportion of women was around 14.0% for the age group 18-24, while for those aged 65 and over, it was around 22.2%.
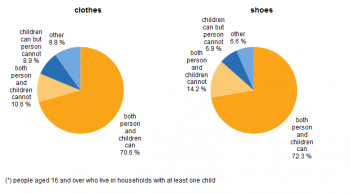
Figure 3 shows that around 8.9% of people in the EU aged 16 and over could not afford new clothes for themselves but their household could afford them for all children. In addition, around 6.9% of people in the EU aged 16 and over could not afford two pairs of shoes for themselves but their household could afford them for all children. Moreover, it was observed that in 10.6% of households, both adults and children could not afford clothes while for shoes the figure was 14.2%.
Leisure activities
Regular participation in a leisure activity (both for children and adults) refers to activities such as sport, cinema, concert, etc. occurring outside home and costing money[8]:
- for entrance and/or travel costs (e.g. swimming),
- for purchase costs (e.g. riding a bicycle) or
- for participating costs in an organised play event (e.g. football club fees) .
Households with children are usually financially worse off compared to households without children due to high cost of bringing up children. The EU-SILC 2014 (variable HD180: Regular leisure activity) showed that with an increase of the number of children, the percentage of people who lived in households which could not afford leisure activities for all children was also increasing (24.1% for one child and 50.7% for four and more children at EU level).
Romania and Bulgaria had the highest share of households which could not afford leisure activities for children. In those two countries, around half of the observed people who lived in households with one child also lived in household which could not afford leisure activities for that child (53.1% in Romania and 45.7% in Bulgaria).
Moreover, in Bulgaria all people who lived in households with four and more children could not afford leisure activities for all children. In the meantime, in Denmark, Luxembourg and Finland, less than 6% of households could not afford leisure activities for all children regardless of the number of children in the household.
Observing intra-generational differences, the 2014 EU-SILC survey showed that the main difference between age groups in the ability to participate in leisure activities was mainly due to non-financial reasons. More precisely, the proportion of people who were not participating in leisure activities due to non-financial reasons was 16.4% for age group 18-24 and 54.1% for people aged 65 and over.
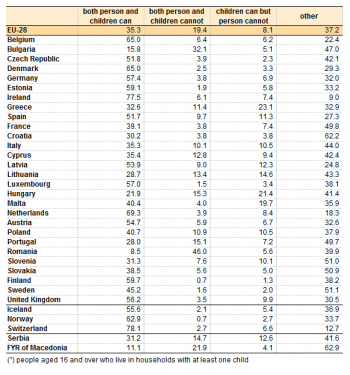
Table 2 shows the inter-generational differences when it comes to the ability to afford leisure activities for household members belonging to different age groups at EU level. Compared to the ability to afford new clothes, far fewer people lived in households where both observed person and children could afford regular leisure activities (around 35.3% at EU level).
In the EU-28, the lowest proportion of households where both adults and children could participate in paid leisure activities was observed in Romania (8.5%) and Bulgaria (15.8%) and the highest in Ireland (77.5%) and the Netherlands (69.3%).
In Spain and Hungary, over 20% of adults could not afford regular leisure activities but they lived in households which could afford it for all children (23.1% and 21.4% respectively); while in Finland, Sweden and in The Czech Republic, these percentages were below 3% (1.3%, 2.0% and 2.3%).
Deprived adults
Spending a small amount of money without consulting with someone
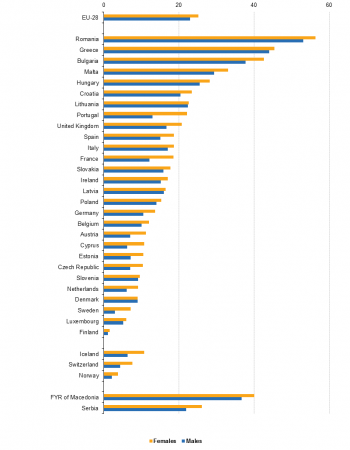
In 2014, 25.2% of women and 23.0% of men in the EU aged 16 and over could not afford to spend a small amount of money on themselves without consulting with someone.
The inability for persons aged 16 and over (further in text – adults) to freely spend money each week on themselves (e.g. to go to the movies, to buy a gift for a friend, to go to the hairdresser, etc.) without consulting with someone, could show possible intra-household (dis)allocation of resources[9].
Figure 4 shows that among both EU and non-EU Member States (except Denmark where the percentages are the same for both sexes: 9.0%), women were more vulnerable; i.e. more women than men could not afford to spend money freely.
Observing gender differences, neither the age nor the level of education changes the pattern – in all cases women were less likely to spend small amount of money without consulting someone. Women were also more deprived if they did not live with a partner in a same household (at EU28 level). However, unemployed men were more deprived than unemployed women in more than half of all observed countries.
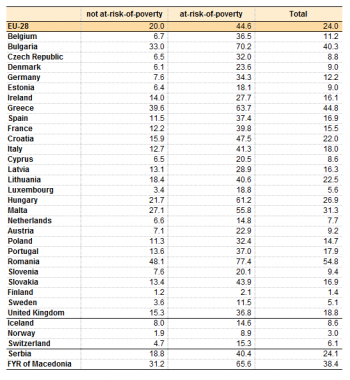
Living in a household which is at-risk-of-poverty was increasing the inability of spending money without consulting with someone (see Table 3). In all observed countries, except Finland, the proportions of adults who were not able to freely spend money were significantly higher for those who lived in households which were at risk of poverty compared to those who did not (20.0% in not at-risk and 44.6% in at-risk-of poverty households, at EU level).
In Romania and Bulgaria the proportion of adults who were not able to spend money without consulting with someone regardless of monetary poverty was relatively high compared to other EU Member States (48.1% and 33.0% for those in not at-risk and 77.4% and 70.2% for those in at-risk-of-poverty households respectively). The lowest share was observed in Finland where only around 1.4% of adults in total were not able to spend a small amount of money without consulting someone (1.2% in not at-risk and 2.1% in at-risk-of poverty households).
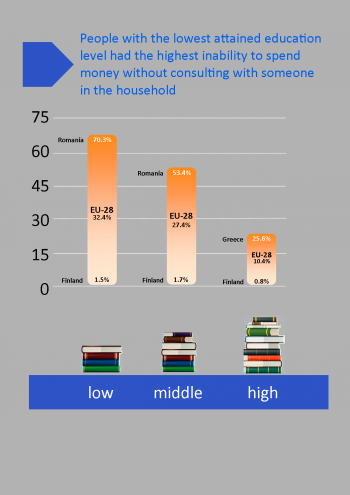
The education level[10] plays a significant role when it comes to the ability to spend money independently (see Infograph 2), although it does not affect the gender differences. In all countries, people with the lowest attained education level had the highest inability to freely spend money.
The smallest differences between low and high educated people were noted in Estonia and Denmark, while countries with the biggest differences were Luxembourg and The Czech Republic. The lowest share of low educated adults who could not spend money without consulting someone was noted in Finland (1.5%) and the highest in Romania (70.3%). Moreover, the highest share of highly educated people who could not spend money without consulting someone was observed in Greece (25.6%) and the lowest in Finland (0.8%).
Data sources and availability
The data used in this section is primarily derived from the EU-SILC. The EU-SILC is carried out annually and is the main survey that measures income and living conditions in Europe, and is the main source of information used to link different aspects of 'Quality of Life' at household and individual level.
Material deprivation refers to several different material deprivation items (as part of 2014 SILC ad-hoc module) which relate to households (as a whole), adults (people aged 16 and over) and children (all household members aged between 1 and 15). Observed items, among others, are related to financial stress and durables as well as leisure and social activities as part of a broader perspective of social inclusion.
Income refers to income levels (‘Mean and median income by age and sex’), monetary poverty (‘at-risk-of-poverty rate (AROP) by poverty threshold and age’). Material conditions refers to material deprivation (‘severely materially deprived’ people). Material deprivation ad-hoc module refers to an additional set of variables conducted in 2014 survey year.
The size of the initial sample is reduced based on the number of households which do not have children of this age. Also, some items could be inapplicable or answers could be missing, which reduces the sample again. When it comes to data collected at personal level (taking into account the characteristics of the information), only personal interviews are allowed. This means that proxy interviews are not taken into account which, in some cases, could reduce the size of the sample used in calculations.
Context
At the Laeken European Council in December 2001, European heads of state and government endorsed a first set of common statistical indicators for social exclusion and poverty that are subject to a continuing process of refinement by the indicators sub-group (ISG) of the social protection committee (SPC). These indicators are an essential element in the open method of coordination (OMC) to monitor the progress made by the EU’s Member States in alleviating poverty and social exclusion.
EU-SILC is the reference source for EU statistics on income and living conditions and, in particular, for indicators concerning social inclusion. In the context of the Europe 2020 strategy, the European Council adopted in June 2010 a headline target for social inclusion — namely, that by 2020 there should be at least 20 million fewer people in the EU at risk of poverty or social exclusion than there were in 2008. The EU-SILC is the source used to monitor progress towards this headline target, which is measured through an indicator that combines the at-risk-of-poverty rate, the severe material deprivation rate, and the proportion of people living in households with very low work intensity — see the article on social inclusion statistics for more information.
See also
- Children at risk of poverty or social exclusion
- European social statistics (online publication)
- Housing conditions
- Housing statistics
- People at risk of poverty or social exclusion
- Social inclusion statistics
Further Eurostat information
Publications
Statistical books
- Living conditions in Europe — 2014 edition - Statistical books
- European social statistics — 2013 edition - Statistical books
- Income and living conditions in Europe — 2010 edition - Statistical books
- Combating poverty and social exclusion. A statistical portrait of the European Union 2010 - Statistical books
- The life of women and men in Europe — A statistical portrait - Statistical books
News releases
- The risk of poverty or social exclusion affected 1 in 4 persons in the EU in 2014 - News releases
- More than 120 million persons at risk of poverty or social exclusion in 2013 - News releases
Statistics in focus
- Income inequality: nearly 40 per cent of total income goes to people belonging to highest (fifth) quintile - Statistics in focus 12/2014
- Is the likelihood of poverty inherited? - Statistics in focus 27/2013
- Living standards falling in most Member States - Statistics in focus 8/2013
- Children were the age group at the highest risk of poverty or social exclusion in 2011 - Statistics in focus 4/2013
- 23 % of EU citizens were at risk of poverty or social exclusion in 2010 - Statistics in focus 9/2012
Main tables
- Income and living conditions (t_ilc)
Database
- At-risk-of-poverty rate by poverty threshold, age and sex - EU-SILC survey (ilc_li02)
- Material deprivation, see:
- Material deprivation by dimension (ilc_mddd)
- [People at risk of poverty or social exclusion (Europe 2020 strategy) - Statistics in focus 9/2012], see:
- Main indicator – Europe 2020 target on poverty and social exclusion (ils_peps)
Dedicated section
Methodology / Metadata
- Income and living conditions (ESMS metadata file — ilc_esms)
- Comparative EU Statistics on Income and Living Conditions: Issues and Challenges (Proceedings of the International Conference on EU Comparative Statistics on Income and Living Conditions, Helsinki, 6–8 November 2006)
- Individual employment, household employment and risk of poverty in the EU — A decomposition analysis (2013 edition)
- Statistical matching of EU-SILC and the Household Budget Survey to compare poverty estimates using income, expenditures and material deprivation (2013 edition)
- Using EUROMOD to nowcast poverty risk in the European Union (2013 edition)
Source data for tables, figures and maps (MS Excel)
Other information
- Regulation (EC) No 1177/2003 of 16 June 2003 concerning Community statistics on income and living conditions (EU-SILC)
Notes
- ↑ Age refers to the age at the end of the income reference period.
- ↑ Further in text, term “children” refers to children aged between 1 and 15.
- ↑ Further in text, term “meal” refers to meat, chicken or fish or vegetarian equivalent.
- ↑ If the household does not have at its disposal a minimum number of rooms considered adequate, it is defined as overcrowded.
- ↑ Term “space” refers to a suitable place for children (going to school) to study or do their homework.
- ↑ Further in the text, term “clothes” refers to new (not second-hand) clothes.
- ↑ Further in the text, term "shoes" refers to two pairs of properly fitting shoes including a pair of all-weather shoes.
- ↑ Further in text will be used term “leisure activities” instead.
- ↑ Further in text, term “freely spend money” refers to money which could be spend each week on itself without consulting with someone.
- ↑ Educational levels refer to ISCED-97 classification where low education corresponds to ED0-2 (less than primary, primary and lower secondary education), middle education corresponds to ED3_4 (upper secondary and post-secondary non-tertiary education) and high education corresponds to ED5-8 (tertiary education).
