Archive:Meat production statistics
- Data from July 2013. Most recent data: Further Eurostat information, Main tables and Database. Planned article update: (dd) Month YYYY(, hh:00).
EU-28 meat production registered a further decline in 2012
Increases in pig and poultry meat largely offset by noticeable declines in beef/veal and sheep/goat meat
Total meat production has further declined at the level of the EU-28. The persistent decline is essentially explained by decreasing livestock numbers. Still, 42 % of the total agricultural output in 2012 consisted of animals and animal products.
Pig meat remains the largest category: the 22.5 million tonnes slaughtered correspond to 51 % of the total in 2012. Poultry meat takes a share of close to 29 % and beef/veal 18 %. Sheep and goat meat played a minor (less than 2 % of the total).
Slaughtering outside slaughterhouses was still considerable in Bulgaria, Romania and the Baltic Member States.
Source: Eurostat (apro_mt_lscatl), (apro_mt_lspig), (apro_mt_lssheep) and (apro_mt_lsgoat)
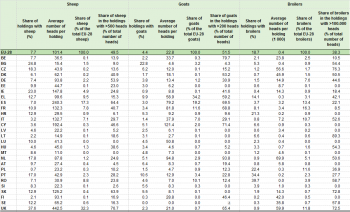
Source: Eurostat (ef_olslsuft) and (ef_olslsureg)
Main statistical findings
Meat, whether so-called ‘red meat’ (beef/veal and sheep meat/goat meat) or ‘white meat’ (pig meat and poultry) is a major source of protein and constitutes an important part of the European diet.
European Union (EU) policies in the meat sector are designed to encourage the production of safe, nutritious and affordable meats and are geared increasingly towards meeting the needs of consumers, livestock producers and the environment in a balanced way. More than half of all EU-28 farms have livestock (56.5 %).
The meat sector is one of the most important in EU agriculture While the entire animal sector, i.e. the value of animals and animal products, accounted for 44 % of the total value of agricultural goods output in 2012, the meat sector, in particular the four main meat types — beef and veal, pig meat, poultry meat, and sheep meat/goat meat — accounted together for 59 % of the total animal output and 25 % of the total agricultural output.
Slaughtering in the EU-28
More than a third of the EU-28 sheep meat from the UK alone
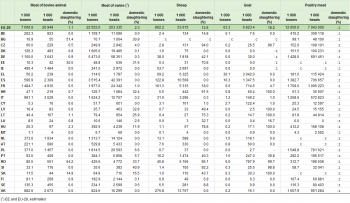
Table 1 summarises statistics on slaughtering in 2012. The principal meat product in the EU-28 was pig meat (22.5 million tonnes in 2012), with the weight of production almost three times as high as that of beef/veal from cattle meat (7.7 million tonnes); the production of sheep and goat meat in the EU-28 was relatively modest (0.8 and 0.06 million tonnes respectively). In contrast, the production of poultry meat continued to increase, likely triggered by higher domestic demand and relatively low prices, resulting in the production of more than 12.6 million tonnes of poultry meat in 2012.
Nearly a quarter (or almost 5.5 million tonnes) of the EU-28’s pig meat production in 2012 came from Germany, the next highest contributions being recorded for Spain (15.6 %) and France (8.8 %), while the 8.1 % share for Poland and the 7.1 % share for both Italy and Denmark were also notable. In terms of the number of animals, these six countries alone represented 70 % of the EU's total pigs slaughtered in 2012. Moreover, in these countries the share of slaughtering carried out other than in slaughterhouses was very small, not exceeding more than 1 %, with the exception of Poland where it reached 6.6 % in 2012. Unsurprisingly, countries with a higher share of small farms and hence a lower average number of animals per farm reported a higher number of animals slaughtered outside slaughter houses (Slovenia with 41 % and Romania, Croatia, Estonia, Bulgaria and Latvia with around 30 %).
Concerning the beef/veal produced in the EU-28, just under one fifth (19.4 % or almost 1.5 million tonnes) originated from France in 2012 which together with Germany (15.0 %) and Italy (12.8 %) covered nearly half of the EU-28’s total production of beef/veal. If the United Kingdom production is added (11.5 %) about 60 % of the EU-28’s production of cattle meat is reached and nearly 55 % of all the bovine animals slaughtered in the EU-28 in 2012. As for slaughtering outside slaughter houses the highest shares in 2012 were registered in Romania with 64.2 %, Bulgaria with 51.4 % and Estonia with 30 %, all of which however didn’t exceed more than 0.8 % of the total EU-28 beef/veal meat slaughtered in 2012.
The United Kingdom dominated the production of sheep meat (almost 0.3 million tonnes), with a 34.4 % share in the EU-28 total in 2012, followed by Spain (15.3 %), France (12.6 %), Greece (8.6 %) and Ireland (6.7 %). Together these five Member States were responsible for more than three-quarters of the total sheep meat slaughtered in the EU-28 in 2012.
Nearly half (30.1 thousand tonnes or 47.6 %) of the EU-28’s goat meat production in 2012 came from Greece alone, the next highest shares in production being recorded for Spain (16.3 %), France (10.4 %) and Romania (9.5 %); these four Member States thus accounting for more than four-fifths (83.7 %) of the total goat meat slaughtered in the EU-28 in 2012.
In 2012, the EU-28’s total poultry meat production was far better spread: roughly half of the slaughtered volume (49.8 % or 6.3 million tonnes) originated from four Member States: France (13.5 %), the United Kingdom (12.7 %), Poland (12.2 %) and Germany (11.3 %). Only two other Member States exceeded one million tonnes of poultry meet slaughtered: ES with 1.4 million tonnes (10.9 %) and IT with 1.3 million tonnes (9.9 %).
Development since 2005
Highest increase for poultry meat, most noticeable decline for sheep and goat meat
The decline in animal herds together with higher energy and feed costs can be considered as the main drivers affecting the production of meat in the EU-28. However, the situation differs by type of meat.
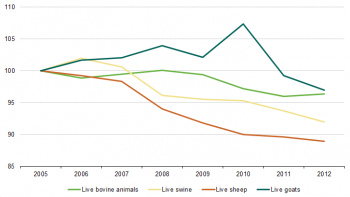
From the time series perspective (index 2005=100) the highest decrease has been reported in the sheep and goat meat production that continued to decline since 2005 (data not shown). Between the latter year and 2012, the decrease was of 23 % and 9 % respectively. A similar fall due to tighter supply and higher prices has been reported for beef/veal meat production, which has also decreased continuously for the last seven years (-7.2 % between 2005 and 2012). In contrast, a relative increase has been reported in pig meat production (+3.5 % between 2005 and 2012). As mentioned earlier, production of poultry meat showed an increasing tendency, helped by its healthy image and relative cheapness, resulting in higher domestic demand. In 2012, production reached 12.6 Mio tonnes at EU-28 level, a 15 % increase compared with 2005.
Prospects for an improved economic situation and lower grain prices could generate a slight increase in the future meat production after several consecutive years of reduced overall meat production driven mainly by lower supplies in beef and pig meat. Recent growth rates in poultry meat production are expected to slow down, while meat production from sheep and goats would most probably continue to decline.
Livestock population 2012
Only the number of cattle registered a slight increase compared with 2011
Data on livestock population categories are gathered from all EU Member States through a livestock survey conducted at least once a year (see Methodological Notes).
Based on the livestock survey carried out in December, a long-term declining trend in each animal category, which directly affected the overall meat production, has been observed. According to the results of the December 2012 survey, the EU-28 animal herd stood at 87 million heads of cattle, 147 million heads of pigs, 84 million heads of sheep and 10 million heads of goats. Compared to the previous year this meant a 1 % decline of the total EU-28 animal herd.
Similarly to the total animal herd, the number of cattle has also been continuously decreasing in the EU-28. Since 2005 the number of bovine animals dropped by 3.6 % (equivalent to 3.3 million animals). However, in 2012, the number of cattle, as the only animal category, reported a slight increase of 0.5 % compared to 2011.
As concerns the EU-28 pig herd, a continuous decline has been reported between 2005 and 2012 (from 160 million to 147 million heads). This decrease of 8 % is partially due to a decrease of the number of breeding sows (which dropped by 19 % over the same time period), linked to the application of the new animal welfare rules regarding pregnant sows that have entered into force in 2013.
In 2012 the total sheep flock in the EU-28 continued to decline (-11.1 % compared to 2005 or 10.5 million animals less) mainly due to a reduction in the numbers in Spain. Only in two Member States (Greece and Romania) has the number of sheep increased since 2005, by a total of around 2 million of animals in these countries (+1.2 million in Romania and 840 thousand in Greece).
The number of goats continued to decline according to the December 2012 survey, albeit at a slower pace than in previous years (-2.4 % between 2011 and 2012 against -7.5 % between 2010 and 2011). Although since 2005 the number of goats have increased in Romania (+84.3 %) and France (+4.3 %), this growth was largely offset by declines in Greece (-14.3 %), Spain (-7 %) and Italy (-5.7 %), resulting in an overall reduction of 0.3 million animals at EU-28 level compared with 2005.
Agricultural output
Animals and animal products worth EUR 166 billion at EU-28 level
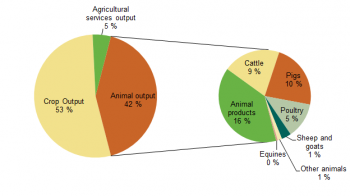
The EU is an important player in the world meat market. After China it is the second largest producer of pig meat and also the largest exporter. In 2012, while nearly 53 % of the total EU-28 agricultural output (valued at EUR 396.9 billion) concerned crop production, animals and animal products accounted for another 42 %, while the remaining 5 % concerned agricultural services output.
Out of more than EUR 166 billion agricultural output worth of animals and animal products in 2012, animals represented a little more than 61 % , which in terms of value accounted for approximately 26.9 % of the agricultural goods output and 25.6 % of the total EU-28 agricultural output.
When only animals in animal output are considered (i.e. disregarding animal products), the highest share in 2012 could be attributed to pigs (37 %), followed by cattle (33 %) and poultry (21 %). The share of sheep and goats together with equines and other animals amounted to a little less than 10 % in 2012. This distribution is very similar to that observed one year earlier.
Farms with livestock
Farms with livestock decreased by 35 % since 2003
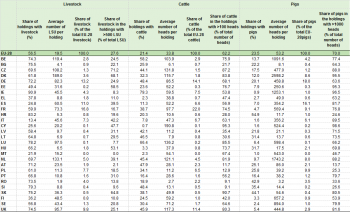
According to the results of the Farm Structure Survey (FSS) carried out in 2010, nearly 7 million holdings in the EU-28 reared animals, which represent 56.5 % of all EU-28 agricultural holdings (12.3 million). Among all holdings with livestock, 2.6 million holdings had cattle, 2.9 million kept pigs, 0.9 million had sheep, 0.5 million had goats and 2.3 million had broilers.
Since the last Farm Structure Survey carried out in 2003, the number of holdings with livestock reported a strong decrease of 35 %. Among the Member States with the highest share of holdings with livestock ranked Ireland (90.9 %), Croatia (83.2 %) and Slovenia (79.3 %), while the lowest share was reported in Italy with only 13.4 %. On the other hand, four Member States were responsible for more than 50 % of the EU-28’s total livestock (France 16.8 %, Germany 13.2 %, Spain 11 % and the United Kingdom 9.8 %).
In 2010, the average EU holding with livestock bred nearly 20 Livestock Units (LSU). This number varied considerably according to the type of animal and between the individual Member States. While in the most industrialised countries it was high (Denmark with 189 heads per farm, followed by the Netherlands with 133 heads and Belgium with 119 heads), the average farm in eight Member States didn’t exceed 10 animals. Among the latter, the lowest values were recorded in Romania (an average of 2 heads per farm), Bulgaria (4) and Croatia (5). The first group includes Member States with more specialised holdings on livestock breeding while the second group includes mainly countries which have large rural zones with many small farms.
As concerns cattle, and still according to the FSS results, there were slightly more than 2.6 million farms rearing nearly 89 million bovine animals in the EU-28 in 2010, corresponding to an average 34 animals per farm. This number again differs considerably depending on the country, with the highest average recorded in Cyprus (190.8), Luxembourg (136.2) and the Czech Republic (131.8) and the lowest in Romania (2.7), Bulgaria (6.1) and Lithuania (7.9). More than 62% of the EU-28 bovine animals are kept on farms having more than 100 heads of animals. Still, the highest share of holdings (36.4 %) had only between one and two bovine animals. Three Member States, France (22 %), Germany (14.1 %) and the United Kingdom (11.4 %) together accounted for nearly 50% of the total bovine animal population of the EU-28 in 2010.
Concerning the pig population, nearly 2.9 million EU-28 agricultural holdings reared slightly more than 153 million pigs in 2010, having thus on average 53.2 pigs per farm. Among the Member States with the highest average number of pigs per farm were Denmark (2 598), the Netherlands (1 743) and Ireland (1 253); Romania (3), Bulgaria (8) and Croatia HR (12) reported the lowest figures. Seventy percent of the EU-28’s pigs are kept on farms having more than 1000 animals, while more than 62 % of the EU-28 holdings had only one or two pigs. Four Member States together represented 53 % of the total pig population in the EU-28 in 2010: Germany (18 %), Spain (16.1 %), Poland (9.9 %) and France (9.1 %).
More than 900 thousand agricultural holdings across the EU-28 kept a total of nearly 96 million sheep (an average of 101.4 heads per holding). Seven Member States exceeded the average, most notably the United Kingdom with 443 sheep per farm, Spain (240) and Cyprus (192 ), while in other Member States the number of sheep did not reach more than 15 heads per farm (Malta, 11 and Lithuania, 15). Nearly half of the EU-28’s sheep are kept on farms having more than 500 animals, while more than 40% of the EU-28 holdings had between one and nine sheep. Almost half of the total EU-28 sheep population is found in only two Member States: the United Kingdom (32.3 %) and Spain (17.3 %).
Slightly more than 12 million goats were reared on around 500 thousand agricultural holdings in the EU-28 in 2010. The average number of goats per farm (22.8 animals) was exceeded by nine Member States, the highest values being reported by Cyprus (121), the Netherlands (95) and France (82). Little over half (51.5 %) of the EU-28’s goats are kept on farms having more than 200 animals, while more than 42 % of the EU-28 holdings had only one or two goats. More than one-third of the EU-28 total goat population (34.2 %) is found in Greece alone. Together with three other Member States (Spain, 19.2 %; France, 11.6 % and Romania, 10.1 %), they represented three-quarters of the total goat population in the EU-28 in 2010.
According to the FSS results, in 2010 nearly 884 million broilers were found on approximately 2.3 million farms in the EU-28, resulting in an average 386 broilers per farm. While three Member States reported more than 50 thousand heads per farm: Netherlands (69.6 thousand), the United Kingdom (59.9 thousand) and the Czech Republic (56.6 thousand), some Member States had farms with less than 200 broilers on average, the lowest numbers being reported by Romania with 22 heads per farm, followed by Croatia (156) and Portugal (192). More than one-third of the EU-28’s broiler population was bred on farms having more than 100 000 birds, while more than 98 % of all EU-28 holdings had less than 100 broilers.
Data sources and availability
- The Farm Structure Survey, a robust survey with a wide scope
From 2009 onwards, the structure of livestock rearing no longer forms part of an EU survey as such. Thus, the data are drawn from the FSS. Although this provides a wider scope (including land use, livestock, labour force, etc.) and a longer reference period, the results are less informative about the animal population than the data previously collected through the Livestock survey. Every third year, the Farm Structure Survey records data about the farm structure, which can be used for describing the structure of animal herds. The legal basis for the FSS is Regulation 1166/2008.
The Member States collect information on land use, livestock numbers, rural development, management and farm labour input from individual agricultural holdings. Based on the share of virtual value for standard output, activities of the farm (e.g. specialist cattle – rearing and fattening) are used to classify the type of farming. If the share of standard output from a particular activity items is more than two thirds of the total farm output, it is classified as ‘specialist acrtivity’.
- Livestock survey
The legal basis of the data collection on slaughtering and meat production is Regulation 1165/2008 of 19 November 2008 concerning livestock and meat statistics. The purpose of this Regulation is to establish a common legal framework for the systematic production of Community statistics on bovine, pig, sheep and goat livestock; slaughtering statistics on bovine animals, pigs, sheep, goats and poultry; and production forecasts of beef, veal, pigmeat, sheepmeat and goatmeat.
The livestock survey provides information about the livestock population at the national and regional level twice a year. The relevant data are intended to be more precise than the FSS figures. Furthermore, the nomenclature of livestock contains more animal categories. The surveys are conducted in all the EU countries at least once a year (in November/December). The Member States with at least 1.5 million bovine animals conduct a second survey in May/June. The regional data refer to the November/December survey. Moreover those Member States with less than 500.000 sheep do not have to survey the sheep population. The same exception concerns those Member States having less than 500.000 goats. Thus data on sheep populations have to be provided by only 13 Member States: BG, DE, IE, EL, ES, FR, HR, IT, HU, NL, PT, RO and UK which in 2009 (QR 2010) covered 97.2 % of the total EU-28 sheep population. Data on goat populations are due by only 5 Member States: EL, ES, FR, IT, and RO and those countries covered 83.0 % of the total EU-28 goat population in 2009 (QR 2010).
Data on slaughtering and meat production are collected on a monthly basis. In order to improve comparability of the results across Member States, two data sets are now collected, data on slaughtering in slaughterhouses and on slaughtering carried out other than in slaughterhouses. The latest are collected in order to estimate the total production.
- Economic Accounts for Agriculture (EAA)
The EAA is a satellite account of the European System of Accounts (ESA1995) providing complementary information and concepts adapted to the particular nature of the agricultural industry. Although their structure very closely matches that of the national accounts, their compilation requires formulating of appropriate rules and methods. Agricultural output measures the value of agricultural products (crop and animal products) produced during the accounting period. It includes the value of agricultural services and excludes the intra-unit consumption.
See also
Context
This article draws a portrait of the meat production in the EU in 2012, with a particular focus on slaughtering. It also deals with the structure of the European farms and the livestock population.
A 'Statistics in focus' publication will result from this article.
Further Eurostat information
Data visualisation
- Symbols & country abbreviations
‘:’ not available
‘c’ confidential data
‘:z’ not applicable
Database
- Farm structure, see:
- - Farm structure 2010
- - Overview - farm livestock
Methodology / Metadata
- Crops products: areas and productions (ESMS metadata file - ef_esms)
