Archive:Agricultural census in Belgium
- Data from November 2012. Most recent data: Further Eurostat information, Main tables and Database.
This article is part of a series of country-specific essays on the results of the European Union (EU) Farm structure survey (FSS) 2010. The FSS collects information on the structural characteristics of the agricultural holdings (land use, livestock and labour force) and is carried out by all European Union Member States every 10 years as an Agricultural census, with two or three additional, intermediate sample surveys carried out in-between. The present analysis of the Belgian farm structure includes a comparison with the FSS 2000.
Belgian data on the FSS 2000 were published at NUTS 1 level (2 regions), whereas information on the FSS 2010 was disclosed at NUTS 2 level (11 regions). Due to this inconsistency in the publication of territorial data, the present analysis of the Belgian agriculture was conducted only at national level. However, hyperlinks to the regional data are also provided throughout the article.

Source: Eurostat (ef_kvaareg) (ef_ov_kvaa) (demo_pjan) and FSS 2000 and 2010

Source: Eurostat (ef_kvaareg) (ef_ov_kvaa)

Source: Eurostat (ef_kvftreg)

Source: Eurostat (ef_lu_ovcropaa) (ef_oluaareg)

Source: Eurostat (ef_lu_ovcropaa) (ef_oluaareg)

Source: Eurostat (ef_mptenure)

Source: Source: Eurostat (ef_pmhouscatlaa)
Main statistical findings
Key indicators
In 2010, 42 850 agricultural holdings were recorded in Belgium (see Table 1), a value which was found to be among the lowest recorded in the EU-28; from among the other EU Member States, Denmark (42 100) reported a similar number of farms. Over the decade under analysis, about one third (30.6 %) of the Belgian agricultural holdings ceased their activities (-18 860), as 61 790 farms were reported in 2000.
Also the utilised agricultural area (UAA) decreased in Belgium, though it did so at a lower rate (-2.6 %). It indicated the value of 1.3 million hectares and covered 44.5 % of the country’s territory in 2010: - 35 760 ha compared to 2000.
As presented in Table 1, 3.8 million livestock units (LSU) were reported in Belgium in 2010; Denmark (4.9 Million LSU) and Austria (2.5 million LSU) were two other EU-28 countries which recorded similar values. Between the two reference years, the Belgian population of farm animals decreased by 12.9 % (- 560 650 LSU), as 4.3 million LSU were recorded in 2000.
As observed throughout the EU-28, also in Belgium the number of people regularly working on the farms decreased (-24.5 %): in absolute terms, about 26 200 people left the agricultural sector over the inter-census decade. Hence, the agricultural labour force represented only 1.6 % of the Belgian active population in 2010, one of the lowest shares recorded among the EU Member States.
Agricultural holdings
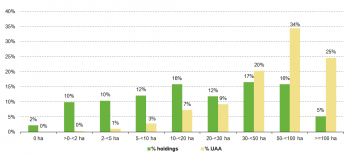
If the number of holdings is taken into account, the Belgian population of farms proved to be evenly distributed across all the size classes (see Figure 1). Of the 9 categories employed to rank farms by the width of their UAA, 7 reported a double digit share. Holdings with 30 to 49 hectares of agricultural land scored the highest percentage (17 %), a value which corresponded to 7 090 farms; those with 50 to 99 hectares of UAA reported the second highest share (16 %), as well as farms with 10 to 19 ha of agricultural land. However, holdings with 50 to 99 ha of UAA were found to cover 34 % of the Belgian agricultural area – the highest percentage of land covered by a single class of farms in 2010 – whereas farms with 10 to 19 ha of UAA scored a lower 7 %, corresponding to about 99 000 hectares.
See detailed data at NUTS 2 level for 2000 and 2010
Economic size of the farm
As presented in Table 2, the economic size of the Belgian agricultural holdings indicated the value of EUR 7 248 million in 2010; from among the other EU Member States, Denmark (EUR 8 431 million) and Greece (EUR 6 700 million) recorded similar values. The economic size of the farms – calculated by adding all the standard output (SO) per hectare of crop and per head of livestock of the farms – increased by 9.2 % (+ EUR 609 million) over the 2007-2010 timeframe. This increase only concerned the biggest holdings – those with a Standard Output of EUR 250 000 or more – as farms with a smaller Standard Output recorded losses compared to 2007. Holdings with an economic size of EUR 250 000 to 499 999 recorded a 5.7 % increase (+ EUR 118 million), whereas farms with a SO of at least EUR 500 000 recorded the highest rise (+61.2%), as in absolute terms they grew by EUR 931 million. Together, the two aforementioned classes of farms shared 64 % of the Belgian SO in 2010 – they shared 54 % in 2007.
Agricultural holding by main type of farming
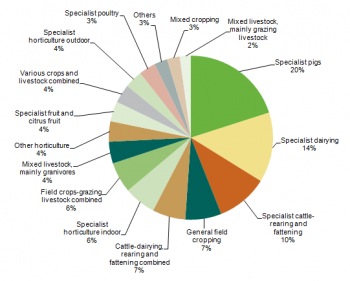
In terms of the number of holdings and the main type of farming, farms specialised in cattle-rearing and fattening appeared to be the most important, as they accounted for 19.2 % of the entire population of holdings in 2010 (see Figure 2). Farms dedicated to general field cropping shared further 14.7 %, followed by holdings dedicated to dairying (12.9 %), which were the ones recording the lowest double digit share.
If the economic size of the holdings is taken into account, the ranking looks different as farms dedicated to pigs were found to record the highest share (20 %) over the country’s total SO in 2010. Holdings specialised in dairying reported the second highest value (14 %), followed by the one dedicated to cattle-rearing and fattening (10 %).
See detailed data at NUTS 2 level for 2010
Land use
The Utilised Agricultural Area (UAA) is the total area used by the holding, regardless of the type of tenure or whether it is used as a part of common land. Generally, it is taken up by arable land, permanent grassland and meadow, permanent crops and kitchen gardens.
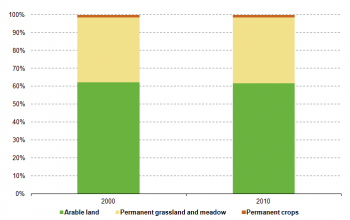
The Belgian agricultural area consists essentially of arable land and permanent grassland and meadow, as those two components together accounted for about 98 % of the country’s UAA in both reference years. However, arable land lost roughly 29 000 hectares over the decade under analysis, whereas permanent grassland and meadow experienced an opposite trend and gained 7 260 ha.
See detailed data at NUTS 2 level for 2000 and 2010
Arable land
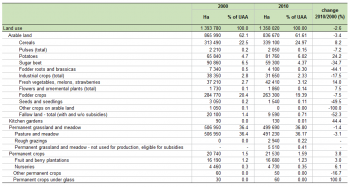
In Belgium, arable land is mostly made of cereals and fodder crops. As exhibited in Table 3, the production of cereals covered about one fourth of the Belgian agricultural area in 2010 – it actually gained 25 610 hectares over the inter-census decade. On the contrary, the land dedicated to fodder crops lost about 21 500 hectares between the two reference years, though it still accounted for 19.4 % of the country’s UAA in 2010.
See detailed data at NUTS 2 level for 2000 and 2010
Permanent grassland and meadow
In 2010, pasture and meadow was by far the main component of permanent grassland and meadow: it covered 491 230 hectares and accounted for 36.2 % of the country’s UAA. In 2000, pasture and meadow was actually the sole element (506 950 ha) of permanent grassland and meadow, as no land was recorded under “rough grazing”. On the contrary, 2 940 hectares of agricultural land were classified under that category in 2010 (see Table 3).
See detailed data at NUTS 2 level for 2010 and 2000
Livestock
Statistics on livestock use two different units of measurement: the number of heads (number of animals) and the livestock units (LSU), with the latter allowing comparison between different types.
In relative terms, there were 0.35 LSU per inhabitant in Belgium in 2010. Over the timeframe under analysis, the Belgian population grew (+5.9 %) while the number of livestock dropped (-12.9 %). Hence, the number of farm animals per inhabitant was higher in 2000 (0.43 LSU).
In 2010, Belgian farms were found to farm essentially cattle and pigs, as these two types of farm animals together accounted for 90 % of the country’s livestock population. As presented in Table 4, cattle was the most common livestock as it indicated the value of 1.8 million LSU, which corresponded to 48 % of the entire population of farm animals. Pigs accounted for a slightly smaller share (42 %) and indicated the value of 1.6 million LSU (-11.6 % compared to 2000). Although they recorded a 17 % decrease (-68 370 LSU) between the two reference years, poultry reported the third highest value (340 590 LSU) and accounted for 9 % of the entire LSU population in 2010.
The Belgian number of farms decreased by 30.6 % over the inter-census decade (- 18 860 farms); since the population of holdings with livestock dropped at a higher rate (-33.1 %), the ratio between holdings with farm animals and the total number of agricultural holdings decreased, from 77 % in 2000 to 74 % in 2010.
Labour force
In 2010, 80 940 people were working on the farms in Belgium; one out of four persons left the agricultural sector compared to 2000 (see Table 5). If the agricultural labour force is measured in annual work units (AWU), the decrease looks similar, as figures dropped by 20.4 %: from 72 190 AWU in 2000 to 57 430 AWU in 2010.
As presented in Figure 6, the gender cleavage – measured through the sex of the holder – appeared to be stable as the percentage of female sole holders did not change much over the years under analysis.
Management practices
Type of tenure
In contrast with the trend observed across the EU-28, a major share of the Belgian agricultural land (66 %) proved to be farmed by the tenants in 2010 (see Table 7); further 32.9 % was found to be farmed by the people who owned it, whereas only a marginal 1.1 % of the country’s UAA (15 420 ha) was recorded as farmed in partnership by the landlord and the sharecropper under a written or oral share-farming contract.
Animal housing
In 2010, 24 950 holdings were found to farm about 2.6 million heads of cattle in Belgium; from among the other European Member States, Sweden (21 590) reported a comparable number of farms with cattle.
As presented in Table 8, the type of housing where the animals are free to move with solid dung and liquid manure was found to be the most common in 2010, both in terms of the number of holdings (67.2 %) and places (about 1.3 million places). If only the number of holdings is taken into account, the second most common type of animal housing proved to be the one were cattle are tied stable with solid dung and liquid manure, as it was reported in 59 % of holdings with cattle. In terms of the number places, “loose housing with slurry” was the second most common type of animal housing (732 710 places).
Other gainful activities
According to the Agricultural census 2010, there were 3 360 holdings with other gainful activities in Belgium. These farms recorded activities other than farm work, directly related to the holding and having an economic impact on the farm; they accounted for 7.8 % of the Belgian population of holdings in 2010.
Information on other gainful activities was collected by eleven category types depending on their characteristics – one holding could register more than one activity.
As in many other EU Member States, also in Belgium the most common extra source of income was found to be contractual work, which was reported by 1 240 farms. Within Belgium itself, the region of West-Vlaanderen was the one recording the highest number of farms with other gainful activities (9 590), a value which accounted for 1.8 % of the total population of farms.
Organic farming
Organic agriculture is an ecological production management system that promotes and enhances biodiversity, biological cycles, and soil biological activity. It is based on the minimal use of off-farm inputs and on the management practices that restore, maintain or enhance ecological harmony.
In Belgium, organic farming proved to be a marginal practice, as it took up only 2.1 % of the country’s agricultural area and was employed by a marginal number of farms (0.02 %).
See detailed data at Nuts 2 level for 2010, 2007, 2005, 2003 and 2000
Data sources and availability
Methodological notes Belgium – Agricultural census 2010
In Belgium, the National Statistical Office is the responsible body for the Agricultural census, though the data collection is conducted by the local administrations.
Survey on agricultural production methods (SAPM)
In 2010 a unique survey was carried out together with the Agricultural census, the Survey on agricultural productions methods (SAPM). This survey collected data at regional level needed to establish agri-environmental indicators as indicated in COM final 508/2006 and to evaluate the greening of the Common agricultural policy.
Data were collected according to the specifications listed in Annex V of Regulation 1166/2008, namely tillage methods, soil conservation, landscape features, animal grazing, animal housing, manure application, manure storage and treatment facilities and irrigation.
In Belgium, the SAPM was conducted as a sample survey; 2 407 agricultural holdings were selected through a stratified sampling technique – they represented 5.7 % of the entire population of Belgian farms in 2010.
Reference period
The reference date for the FSS 2010 is the 1st of May 2010; however, data on animal housing, labour force and indoor crops refer to the twelve months prior to this date.
Threshold for agricultural holdings
In Belgium, the Agricultural census was conducted as an exhaustive survey; it targeted all the farms regardless of their size, provided that they were farming agricultural products with selling purposes at the reference date.
Common land
Common land is the land that does not directly belong to any agricultural holding but on which common rights apply. It can consist of pasture, horticultural or other land. The treatment of the common land used by an agricultural holding might differ from country to country.
In Belgium common land is a non-existent characteristic.
Geo-reference of the holding
Information on the location of the farms was mainly obtained through their addresses, recorded in the farm register.
Economic size
From FSS 2007 onwards, the Standard output (SO), a new classification of the economic size of the holding, is used. The SO has replaced the Standard gross margin (SGM) used before. Nonetheless, for comparability reasons, in FSS 2007 both classifications are available.
Other methodological issues
Belgian data on the Agricultural census 2000 are published at NUTS 1 level (2 regions), whereas information on the FSS 2010 has been disclosed at NUTS 2 level (11 regions). Due to this inconsistency in the publication of territorial data, the present analysis of Belgian agriculture was conducted only at national level.
Context
European Commission Rural development policy aims to improve competitiveness in agriculture and forestry, the environment and the countryside, as well as to improve the quality of life in rural areas, and to encourage the diversification of rural economies.
As agriculture has been modernised and the importance of industry and services within the economy has increased, agriculture has become much less important as a source of jobs. Consequently, increasing emphasis is placed on the role farmers can play in rural development, including forestry, biodiversity and the diversification of the rural economy, in order to create alternative jobs and provide environmental protection in rural areas.
The FSS continues to adapt in order to provide timely and relevant data to help analyse and follow these developments.
Further Eurostat information
Publications
- Agriculture, fishery and forestry statistics — Main results – 2010-11 - 2012 edition
- Farm Structure Survey in Belgium - 2007 - Issue number 82/2009
- Farm Structure in Belgium - 2005 - Issue number 21/2007
- Structure of Agricultural Holdings - Belgium 2003 - Statistics in focus 34/2005
Main tables
- Agriculture, see:
- Structure of agricultural holdings (t_ef)
Database
- Agriculture, see:
- Structure of agricultural holdings (ef)
Dedicated section
Methodology / Metadata
- Structure of agricultural holdings (ESMS metadata file - ef_esms)
- Methodological Report - FSS 2010 Cyprus
- Methodological Report - FSS 2007 Cyprus
Source data for tables and figures (MS Excel)
Other information
- Regulation 1166/2008 of 19 November 2008 on farm structure surveys and the survey on agricultural production methods and repealing Council Regulation 571/88
- Regulation 1200/2009 of 30 November 2009 implementing Regulation 1166/2008 on farm structure surveys and the survey on agricultural production methods, as regards livestock unit coefficients and definitions of the characteristics
See also
- census 2010 Agricultural census 2010
- structure All farm structure articles by country
- structure statistics Farm structure statistics


