Tutorials
Log in
Statistics Explained
menu
search
search
Navigation
Main page
Statistical themes
Glossary
Categories
Statistics 4 beginners
Tutorials
Help
Eurostat home
Education corner
Online publications
Regional yearbook
Sustainable development
Full list
Tools
User contributions
Logs
View user groups
Special pages
search
Navigation
Main page
Statistical themes
Glossary
Categories
Statistics 4 beginners
Tutorials
Help
Eurostat home
Education corner
Online publications
Regional yearbook
Sustainable development
Full list
Tools
User contributions
Logs
View user groups
Special pages
Navigation
Main page
Statistical themes
Glossary
Categories
Statistics 4 beginners
Tutorials
Help
Eurostat home
Education corner
Online publications
Regional yearbook
Sustainable development
Full list
Tools
User contributions
Logs
View user groups
Special pages
Uploads by Sunjkni
This special page shows all uploaded files.
File list
Items per page:
20
50
100
250
500
Search for media name:
Username:
Include old versions of files
Go
First page
Previous page
Next page
Last page
Date
Name
Thumbnail
Size
Description
Versions
17:13, 23 July 2019
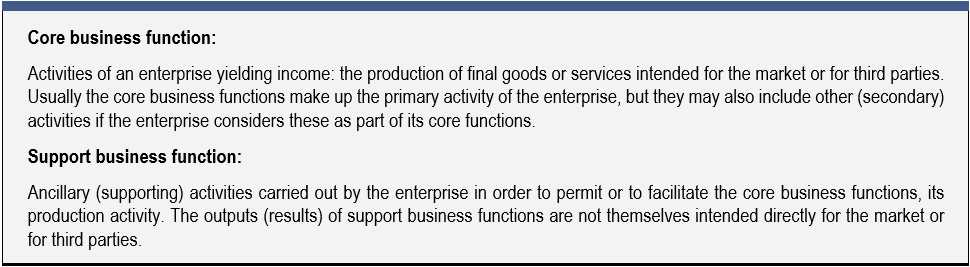
Business functions.png
(
file
)
27 KB
1
10:38, 13 September 2019
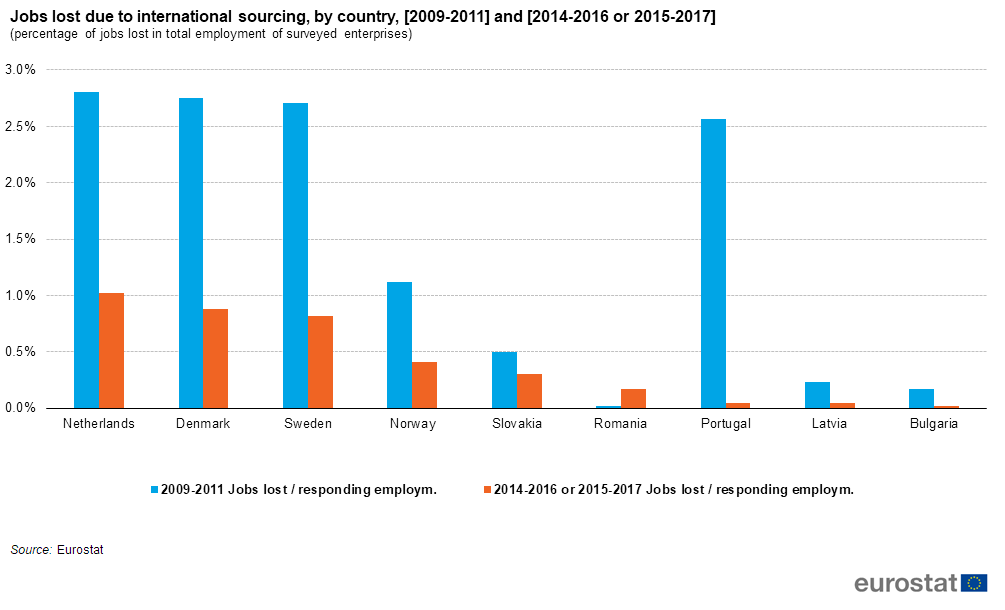
Jobs lost due to international sourcing, by country, -2009-2011- and -2014-2016 or 2015-2017-.png
(
file
)
40 KB
Reverted to version as of 08:33, 22 July 2019
4
18:10, 27 November 2019
Selected important motivation factors for enterprises sourcing internationally (2014-2017).png
(
file
)
69 KB
3
18:11, 27 November 2019
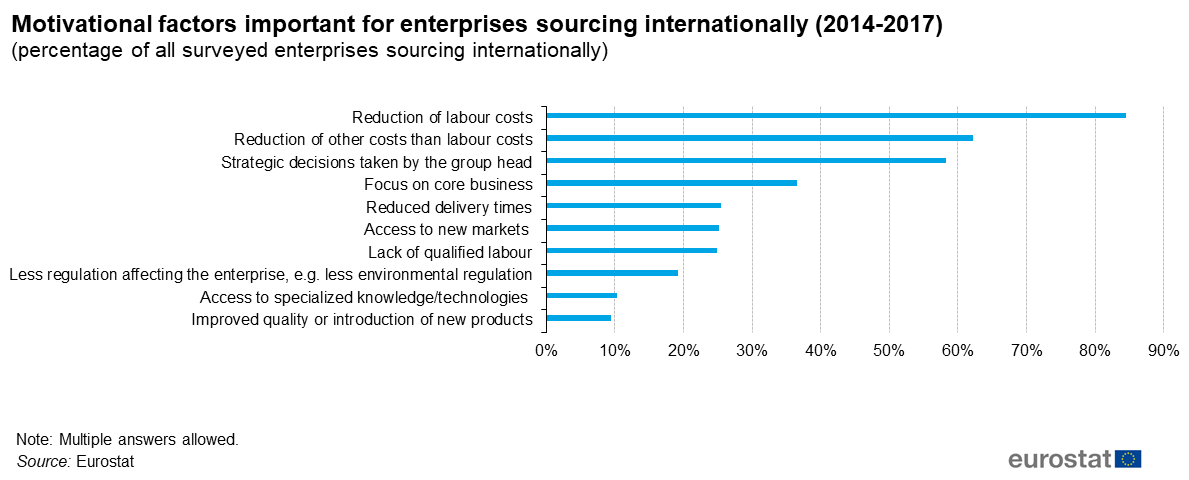
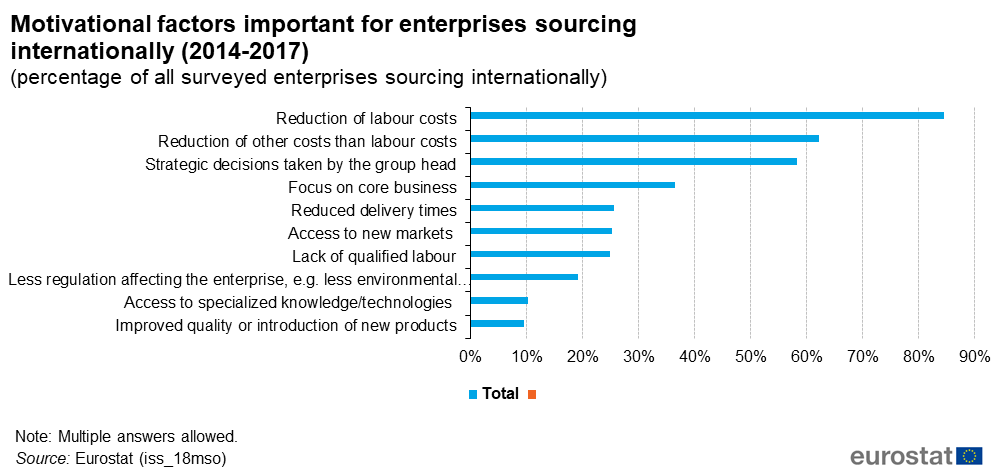
Motivational factors important for enterprises sourcing internationally (2014-2017).png
(
file
)
47 KB
4
18:11, 27 November 2019
Motivational factors important for enterprises to move functions back from abroad (back-sourcing), (2014-2017).png
(
file
)
68 KB
4
18:12, 27 November 2019
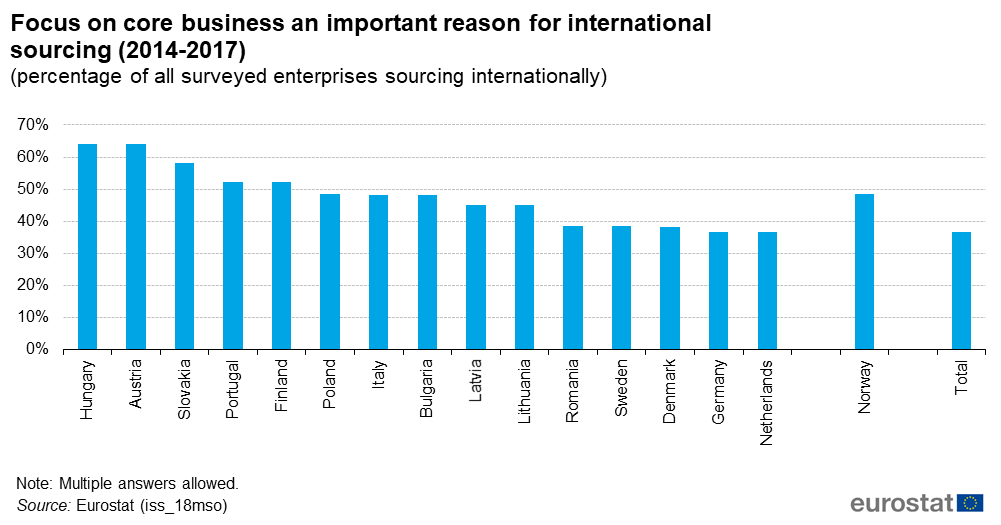
Focus on core business an important reason for international sourcing (2014-2017) (percentage of all surveyed enterprises sourcing internationally).png
(
file
)
60 KB
3
16:31, 24 January 2020
SE article-ready table v1.9.xlsx
(
file
)
208 KB
1
16:33, 24 January 2020
Percentage of enterprises sourcing by destination (2014-2017) (percentage of all surveyed enterprises sourcing internationally).png
(
file
)
45 KB
2
16:33, 24 January 2020
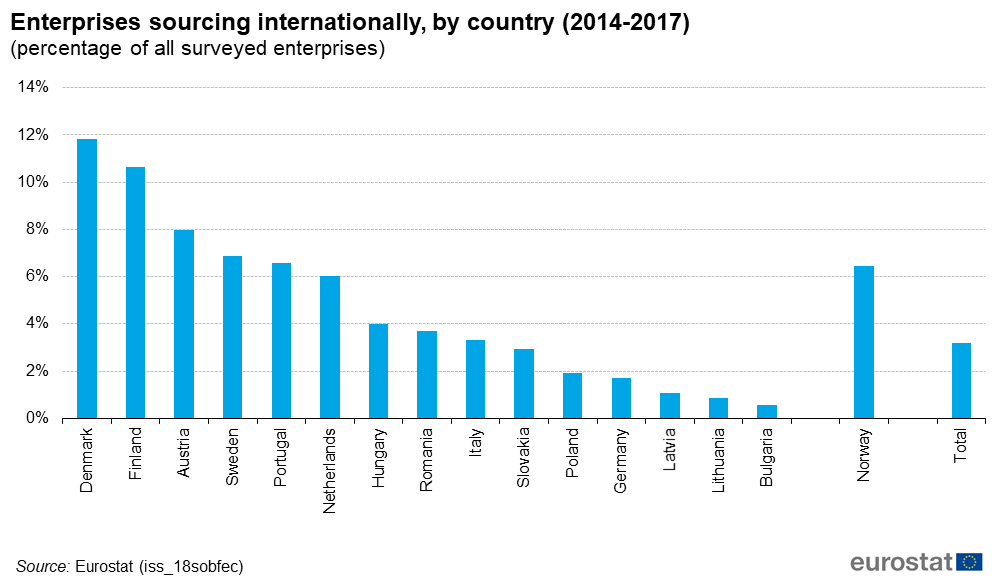
Enterprises sourcing internationally, by country (2014-2017) (percentage of all surveyed enterprises).png
(
file
)
43 KB
3
16:34, 24 January 2020
10-Enterprises sourcing administrative and management support function internationally (2014-2017).png
(
file
)
49 KB
1
16:34, 24 January 2020
11-Percentage of enterprises sourcing by destination (2014-2017).png
(
file
)
45 KB
1
16:34, 24 January 2020
12-Enterprises sourcing core business functions to China and India (2014-2017).png
(
file
)
54 KB
1
16:34, 24 January 2020
13-Enterprises sourcing support business functions to China and India (2014-2017).png
(
file
)
52 KB
1
16:34, 24 January 2020
14-Selected important motivation factors for enterprises sourcing internationally (2014-2017).png
(
file
)
66 KB
1
16:34, 24 January 2020
15-Motivational factors important for enterprises sourcing internationally (2014-2017).png
(
file
)
45 KB
1
16:34, 24 January 2020
16-Motivational factors important for enterprises to move functions from abroad (2014-2017).png
(
file
)
57 KB
1
16:34, 24 January 2020
17-Focus on core business an important reason for international sourcing (2014-2017).png
(
file
)
50 KB
1
16:34, 24 January 2020
18-Jobs lost due to international sourcing, by business function and NACE aggregates (2014-2017).png
(
file
)
58 KB
1
16:34, 24 January 2020
02-Enterprises sourcing by destination (2014-2017) (percentage of all surveyed enterprises).png
(
file
)
52 KB
1
16:34, 24 January 2020
03-Enterprises insourcing and outsourcing abroad (2014-2017) (percentage of all surveyed sourcing enterprises).png
(
file
)
42 KB
1
16:34, 24 January 2020
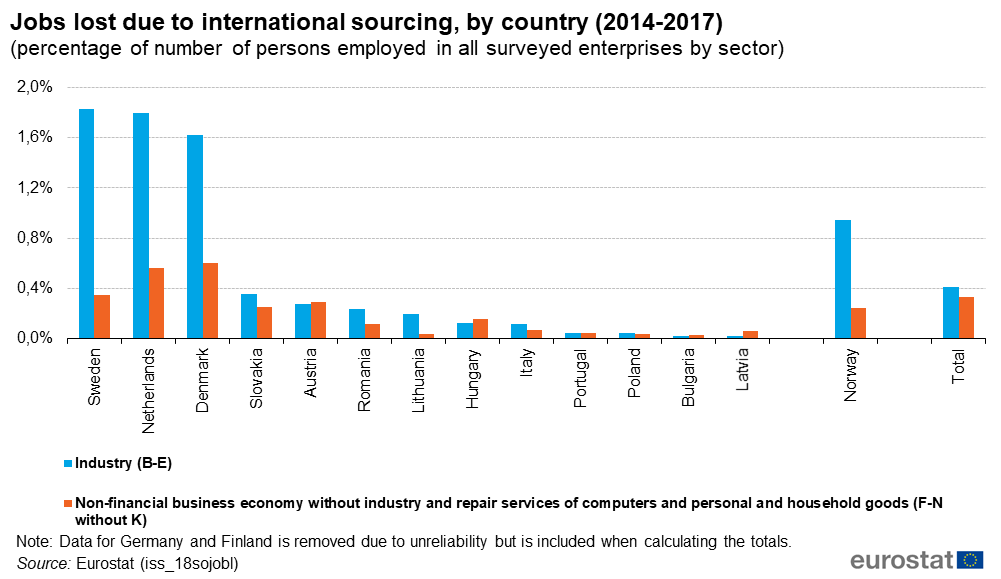
19-Jobs lost due to international sourcing, by country (2014-2017).png
(
file
)
53 KB
1
16:34, 24 January 2020
04-Enterprises, which made use of international sourcing in manufacturing (2014-2017).png
(
file
)
52 KB
1
16:34, 24 January 2020
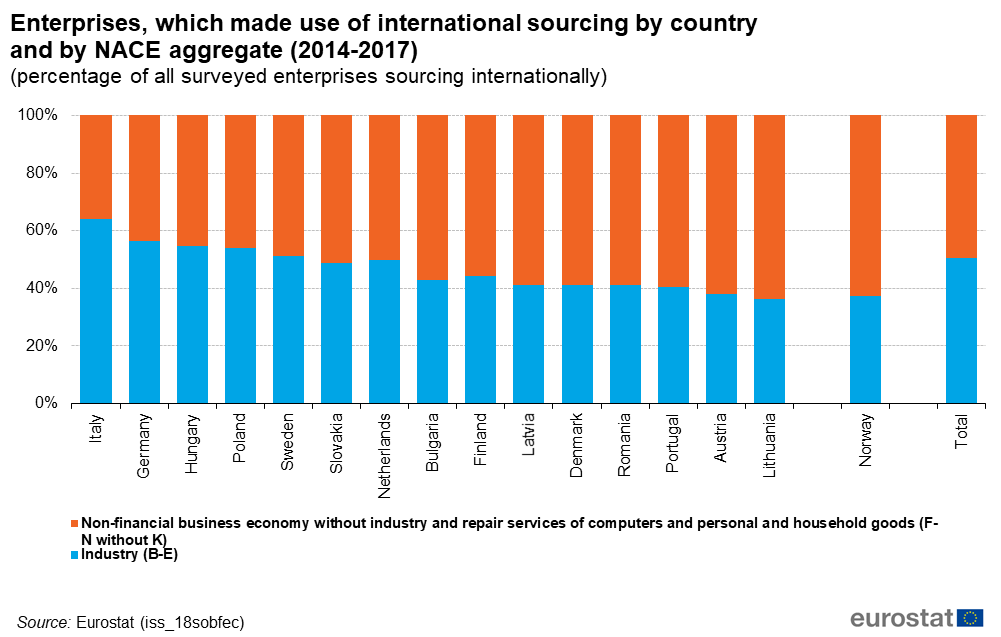
05-Enterprises, which made use of international sourcing by country and by NACE aggregate (2014-2017).png
(
file
)
74 KB
1
16:34, 24 January 2020
06-Enterprises, which made use of international sourcing, by NACE code (2014-2017).png
(
file
)
67 KB
1
16:34, 24 January 2020
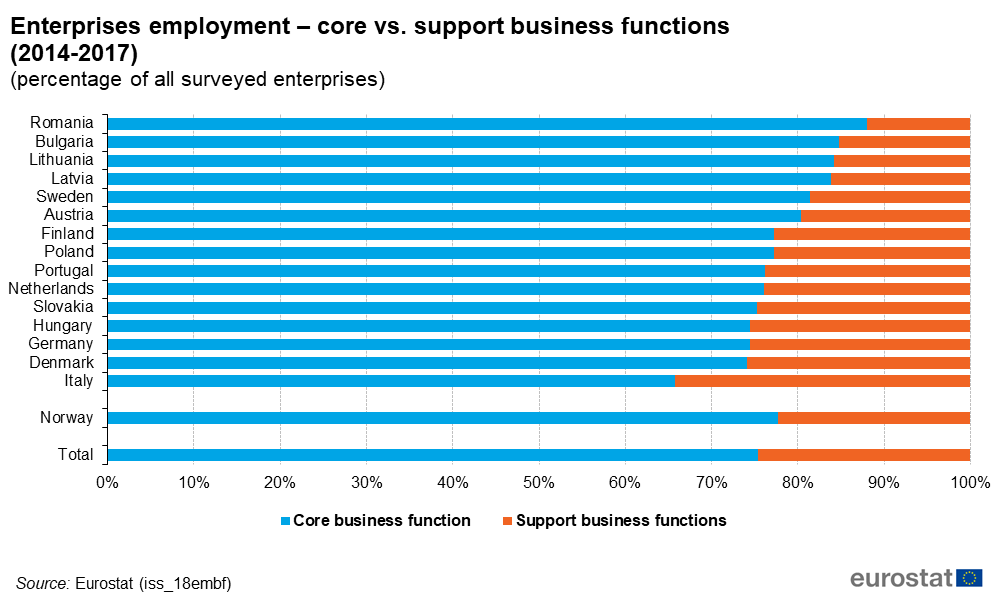
07-Enterprises employment – core vs support business functions (2014-2017).png
(
file
)
42 KB
1
16:34, 24 January 2020
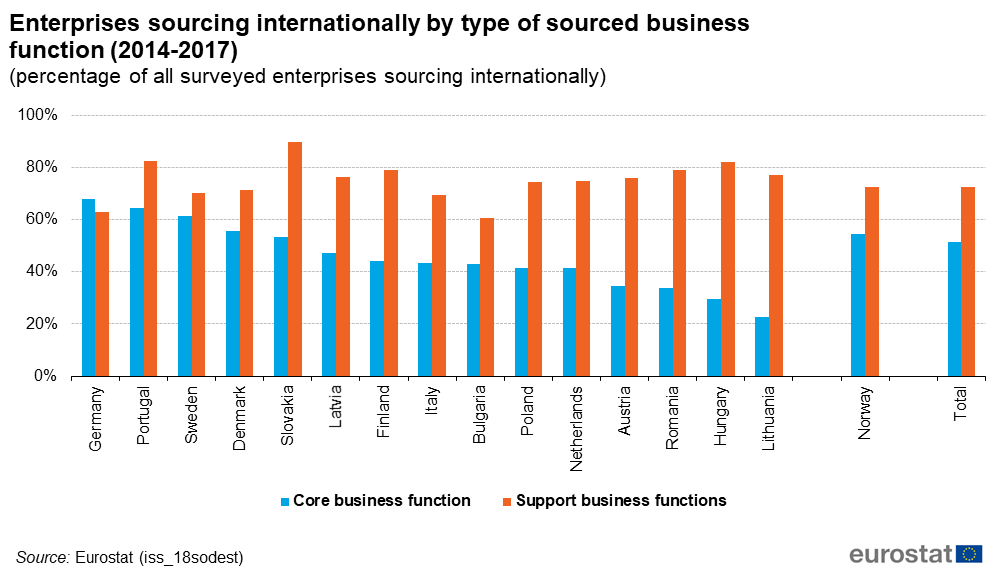
08-Enterprises sourcing internationally by type of sourced business function (2014-2017).png
(
file
)
62 KB
1
16:34, 24 January 2020
09-Enterprises sourcing core and support function internationally (2014-2017).png
(
file
)
38 KB
1
16:40, 24 January 2020
Enterprises sourcing by destination (2014-2017) (percentage of all surveyed enterprises).png
(
file
)
52 KB
Added source.
3
20:02, 18 November 2020
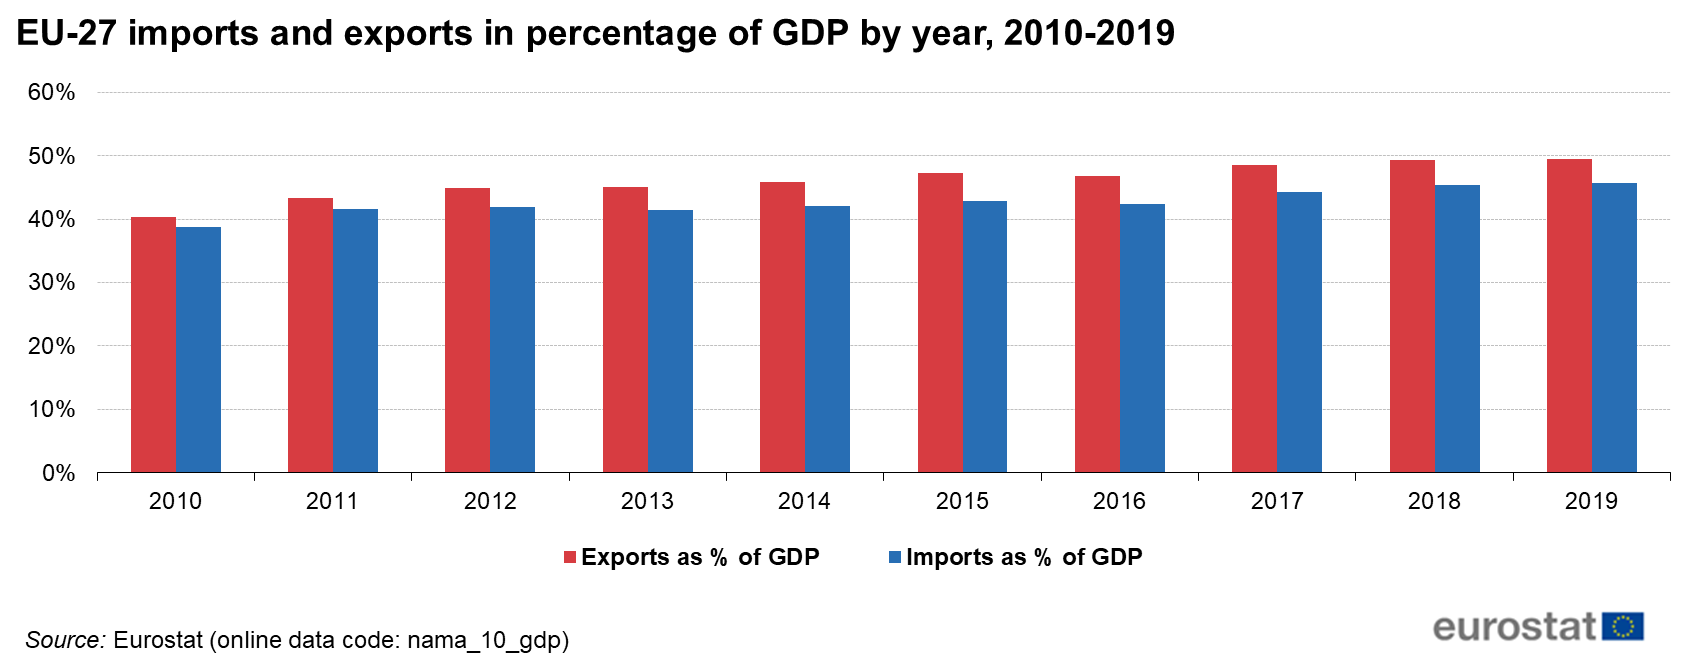
EU-27 imports and exports in percentage of GDP by year, 2010-2019.png
(
file
)
87 KB
1
20:02, 18 November 2020
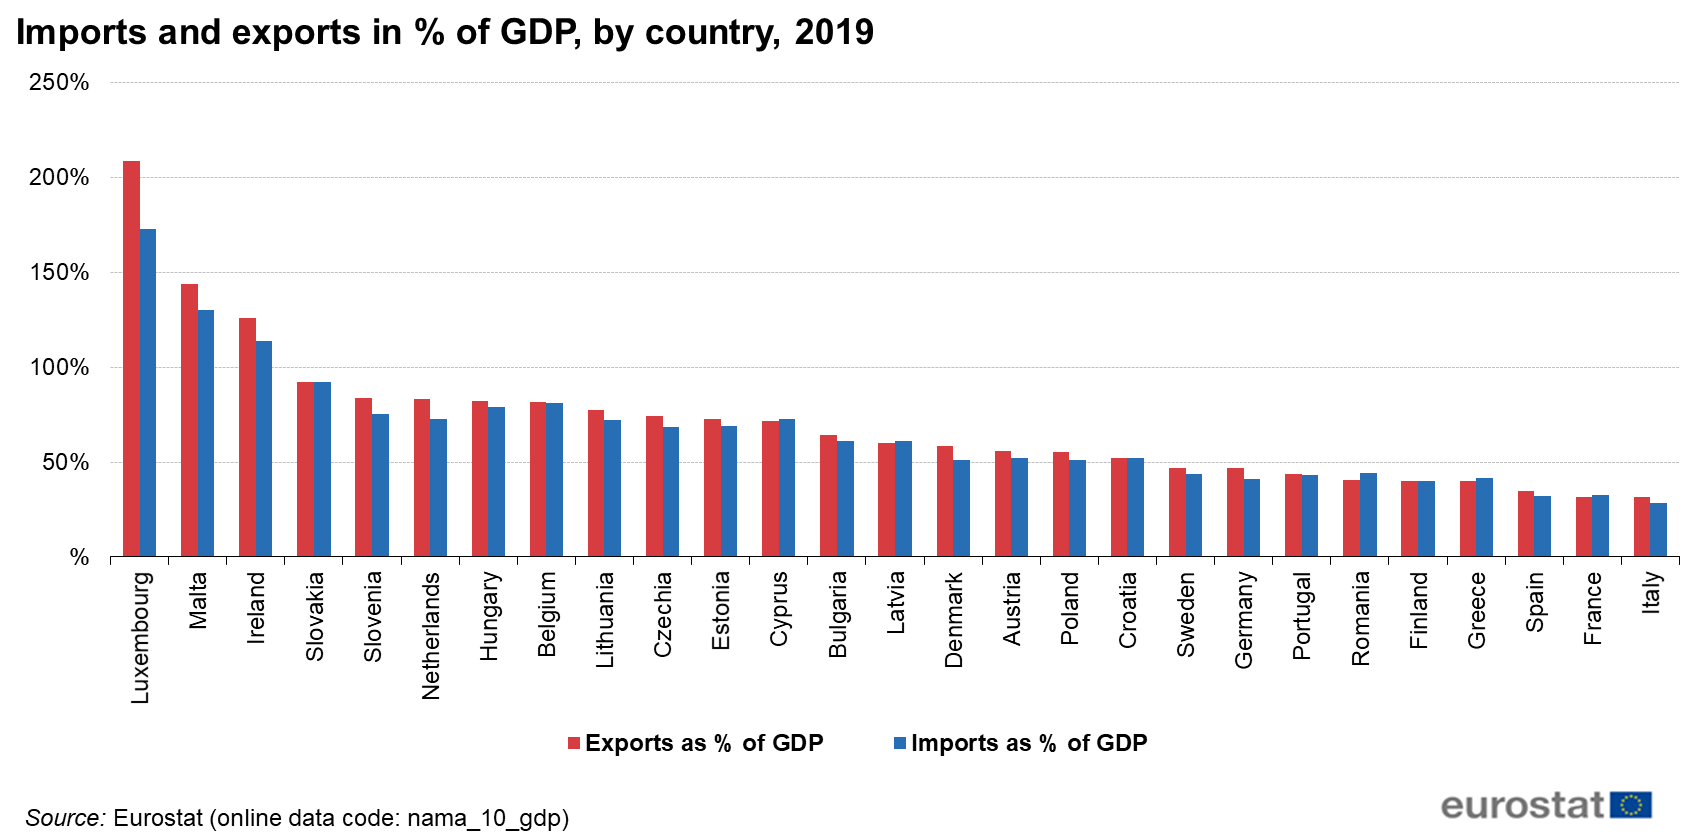
Imports and exports in % of GDP, by country, 2019.png
(
file
)
111 KB
1
20:03, 18 November 2020
Inward and outward foreign direct investment by Member State, in percentage of GDP, 2018.png
(
file
)
79 KB
1
20:03, 18 November 2020
Inward and outward foreign direct investment stocks relative to the rest of the world as a percentage of GDP, EU-27, 2013-2018.png
(
file
)
98 KB
1
10:07, 19 November 2020
Outliers in Inward and outward FDI, 2018.png
(
file
)
116 KB
2
10:09, 19 November 2020
Graphs and tables of globalisation indicators - in 2020.xlsx
(
file
)
209 KB
1
17:15, 19 November 2020
Employment shares of foreign controlled entreprises (world except reporting country) in total domestic employment by country, 2016.png
(
file
)
122 KB
2
11:41, 18 November 2021
EU-27 imports and exports in percentage of GDP by year, 2010-2020.png
(
file
)
87 KB
null
1
11:41, 18 November 2021
Export-Import balance as a percentage of GDP by country, 2020.png
(
file
)
94 KB
null
1
11:41, 18 November 2021
Imports and exports in % of GDP, by country, 2020.png
(
file
)
109 KB
null
1
11:41, 18 November 2021
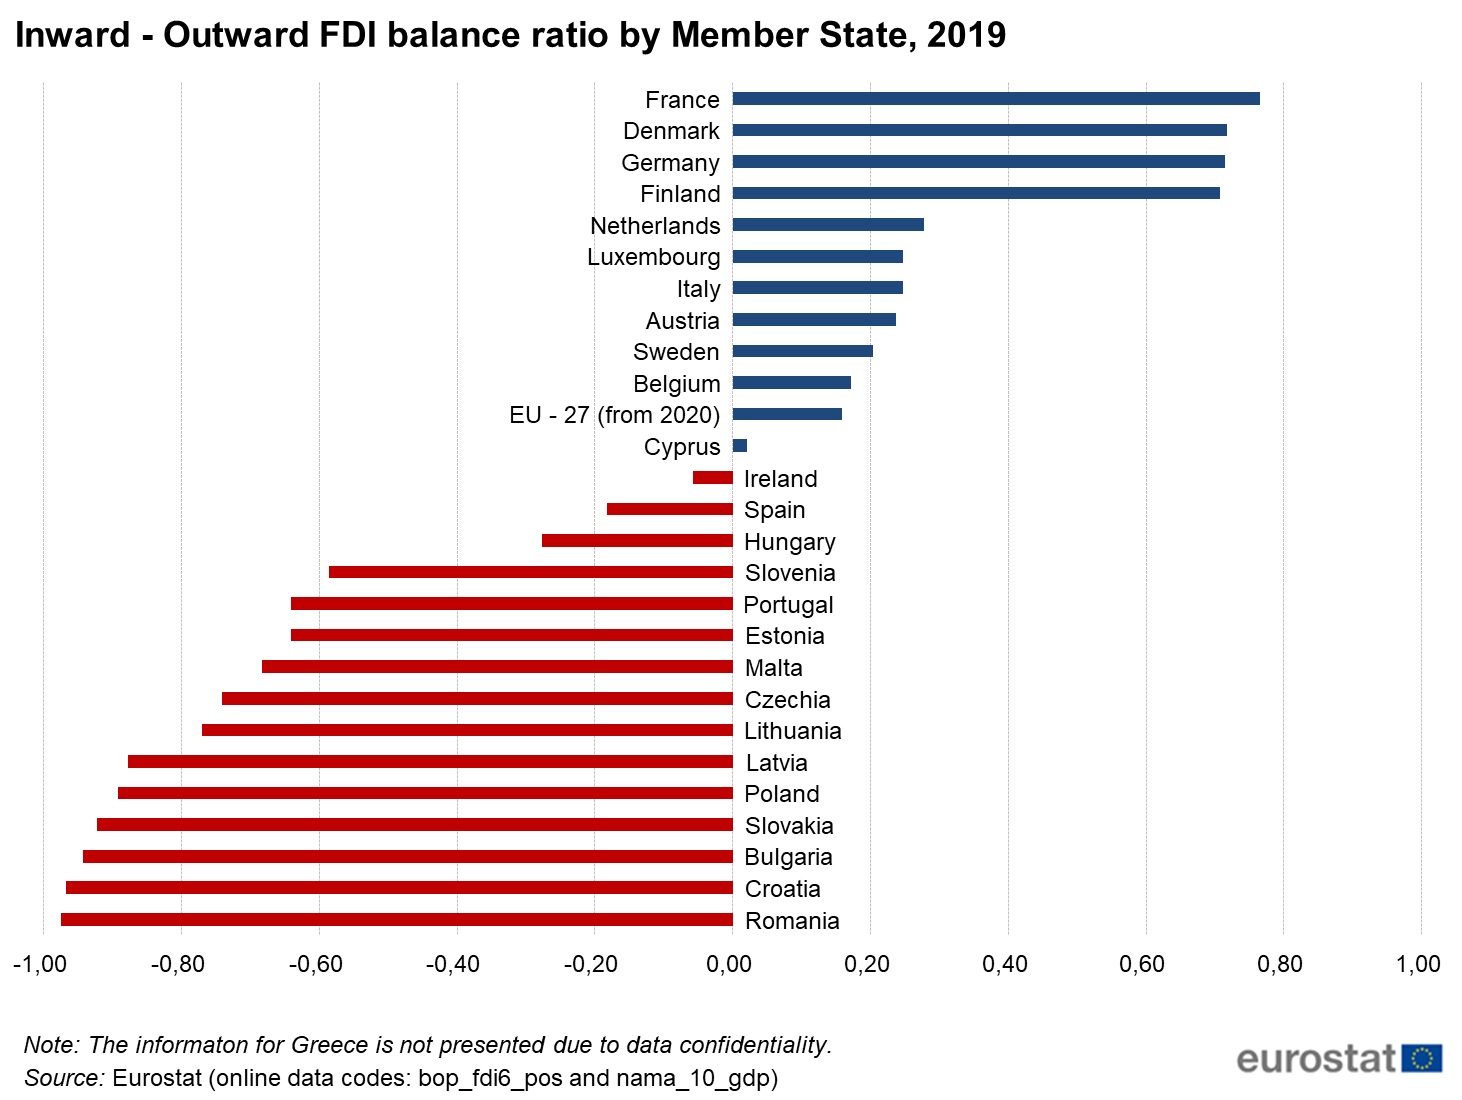
Inward - Outward FDI balance ratio by Member State, 2019.png
(
file
)
104 KB
null
1
11:41, 18 November 2021
Inward and outward foreign direct investment by Member State, in percentage of GDP, 2019.png
(
file
)
43 KB
null
1
11:41, 18 November 2021
Inward and outward foreign direct investment stocks relative to the rest of the world as a percentage of GDP, EU-27, 2013-2019.png
(
file
)
104 KB
null
1
11:55, 18 November 2021
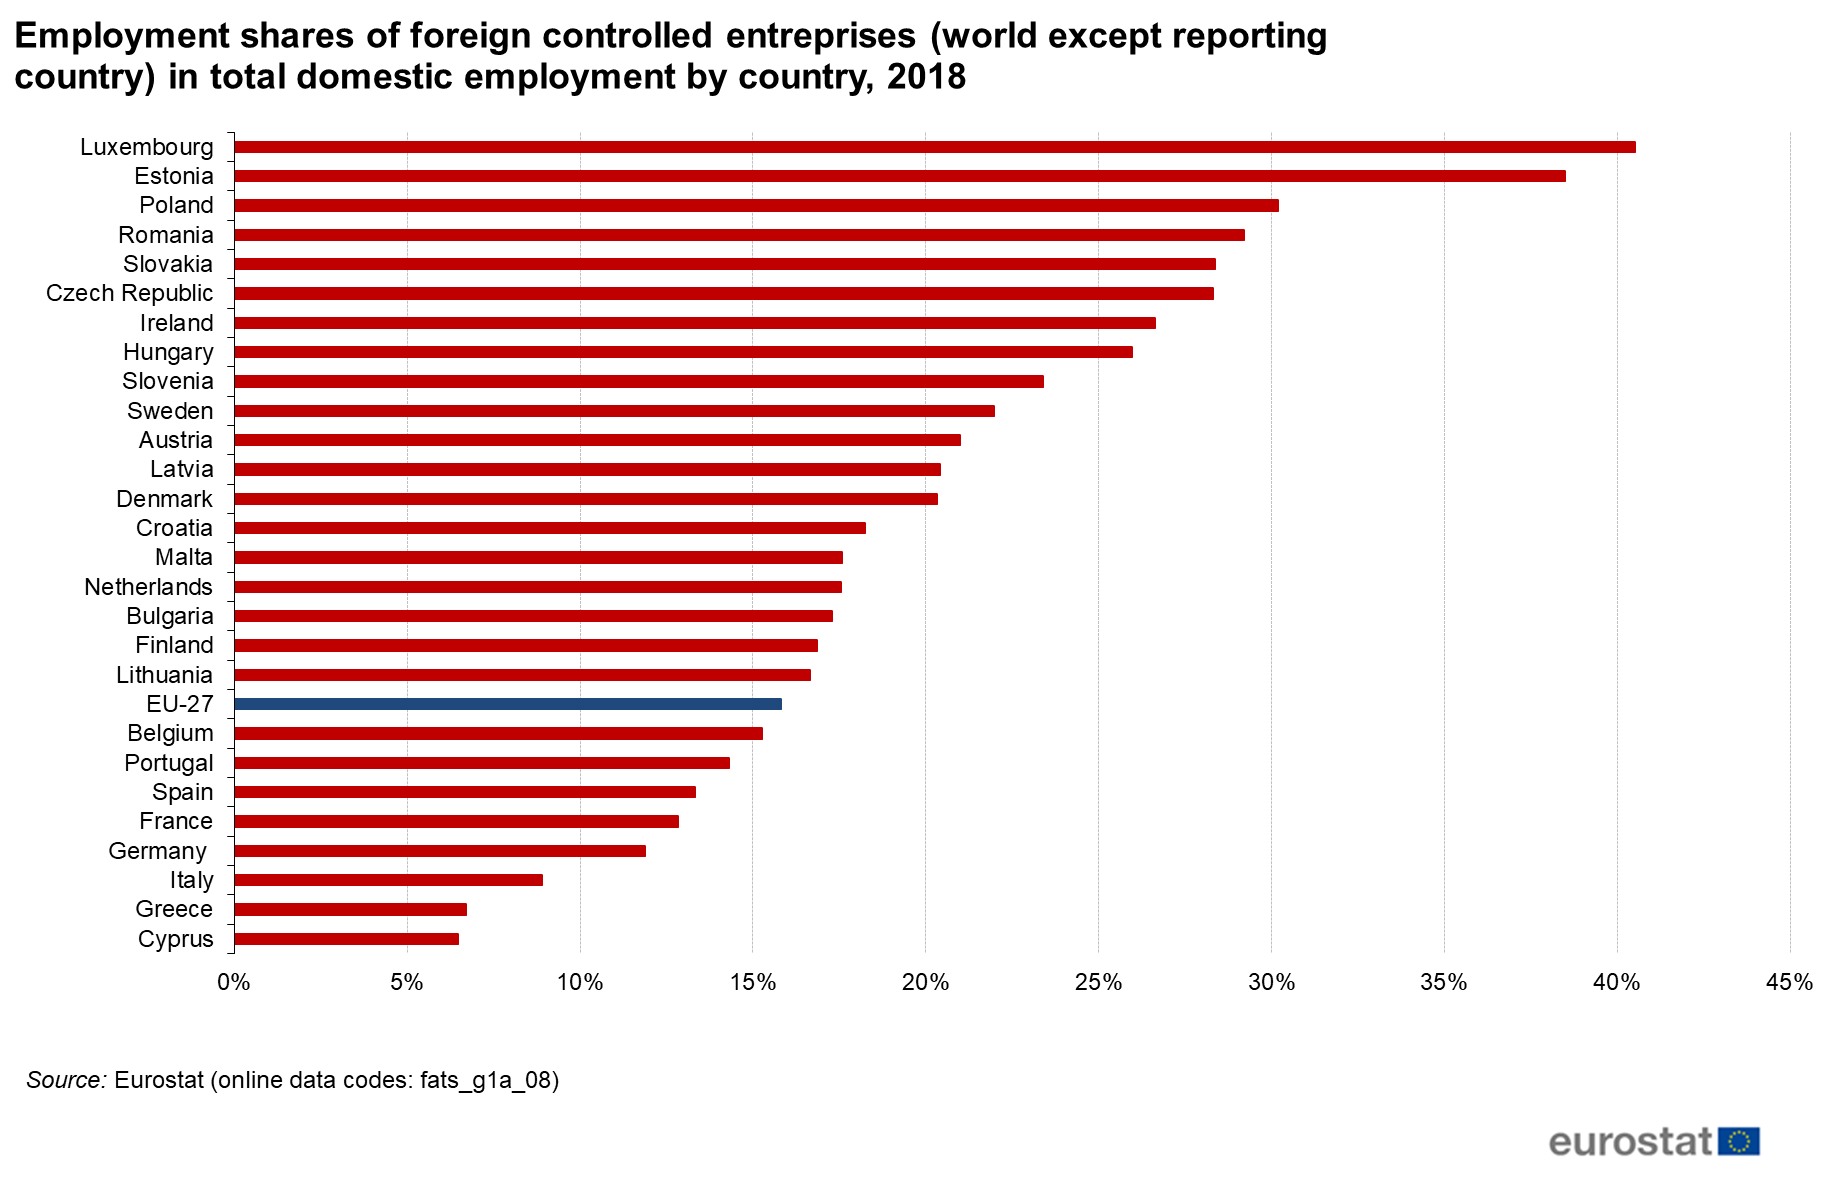
Employment shares of foreign controlled entreprises (world except reporting country) in total domestic employment by country, 2018.png
(
file
)
110 KB
1
11:58, 18 November 2021
Graphs and tables of globalisation indicators - in 2021.xlsx
(
file
)
254 KB
1
11:09, 16 June 2022
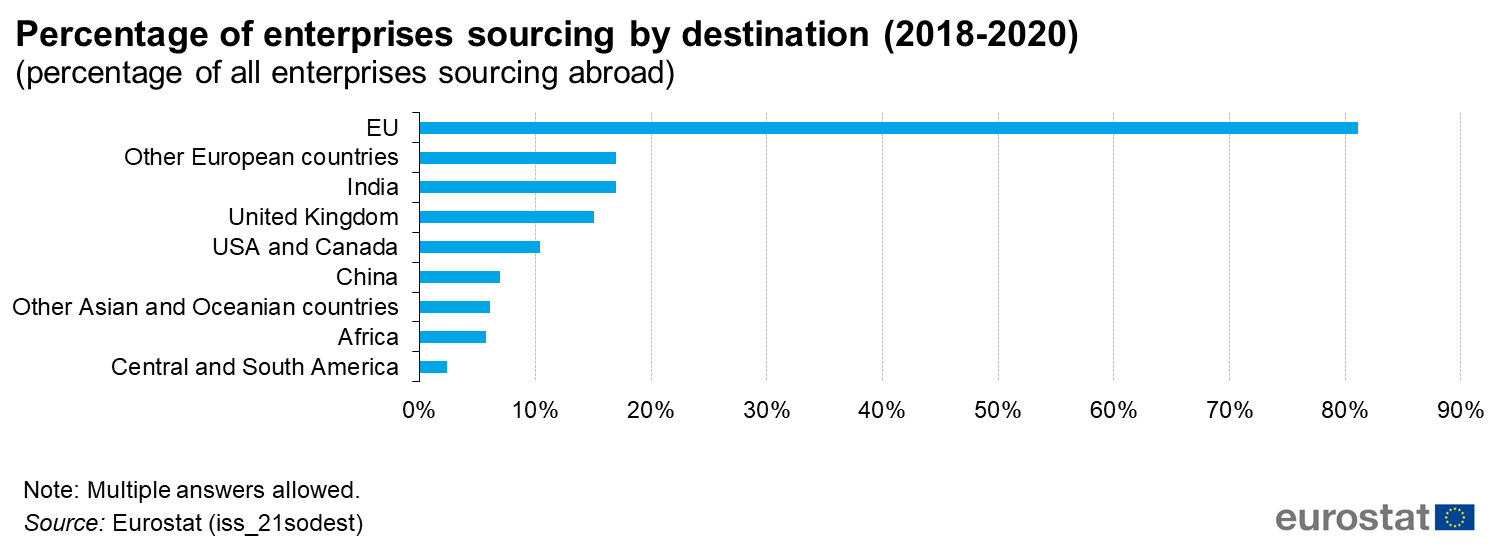
Figure 09. Percentage of enterprises sourcing by destination (2018-2020).png
(
file
)
62 KB
1
12:35, 27 June 2022
SE article-ready table 2021 v0.92.xlsx
(
file
)
208 KB
1
10:45, 28 June 2022
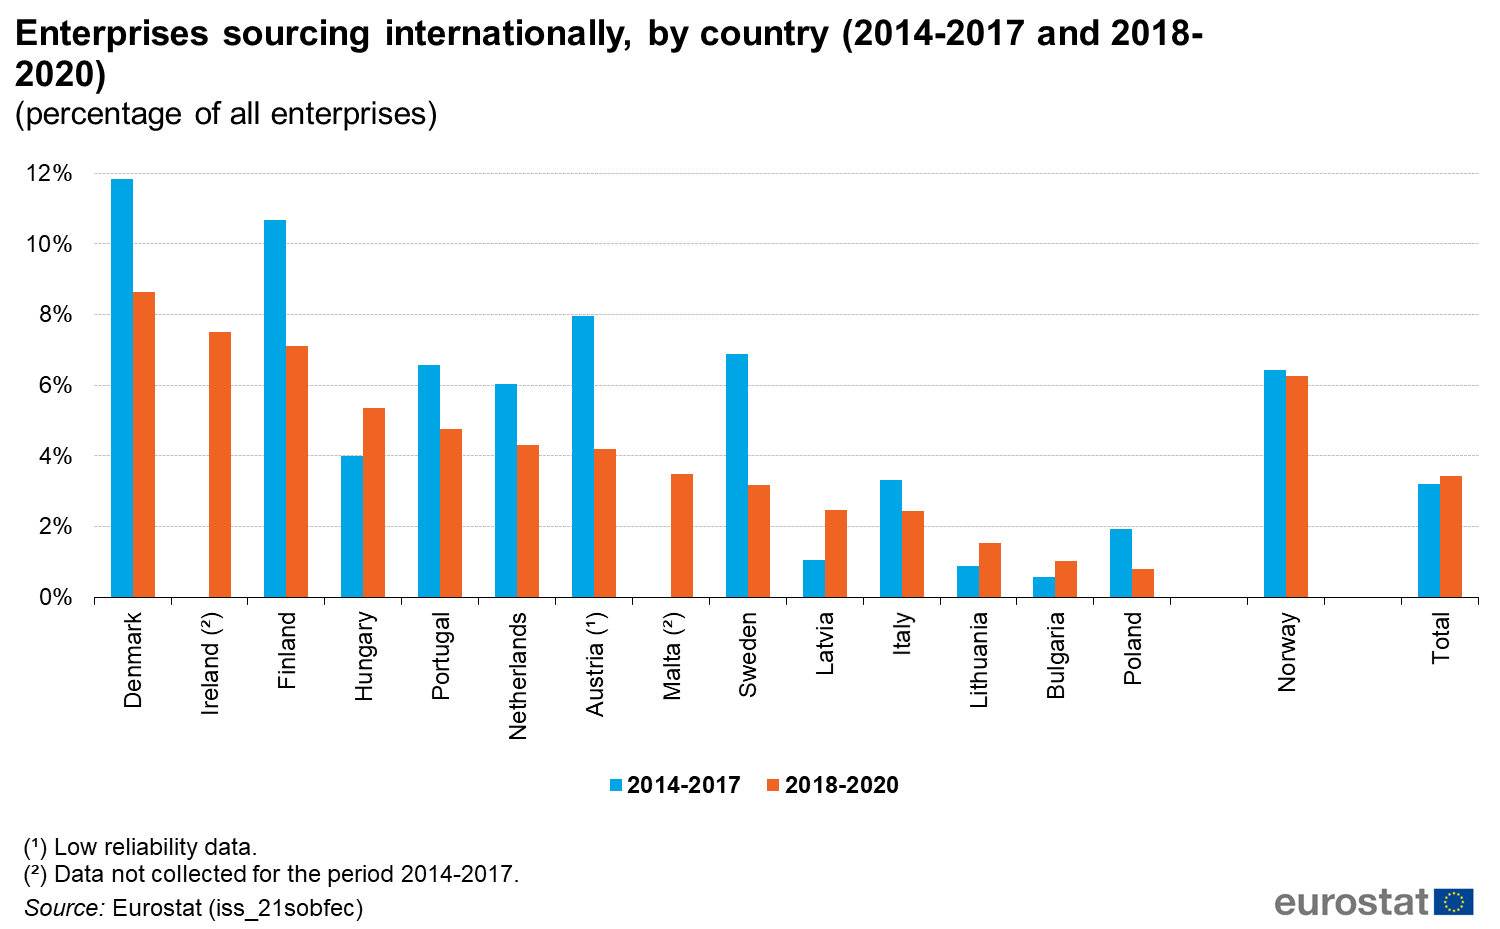
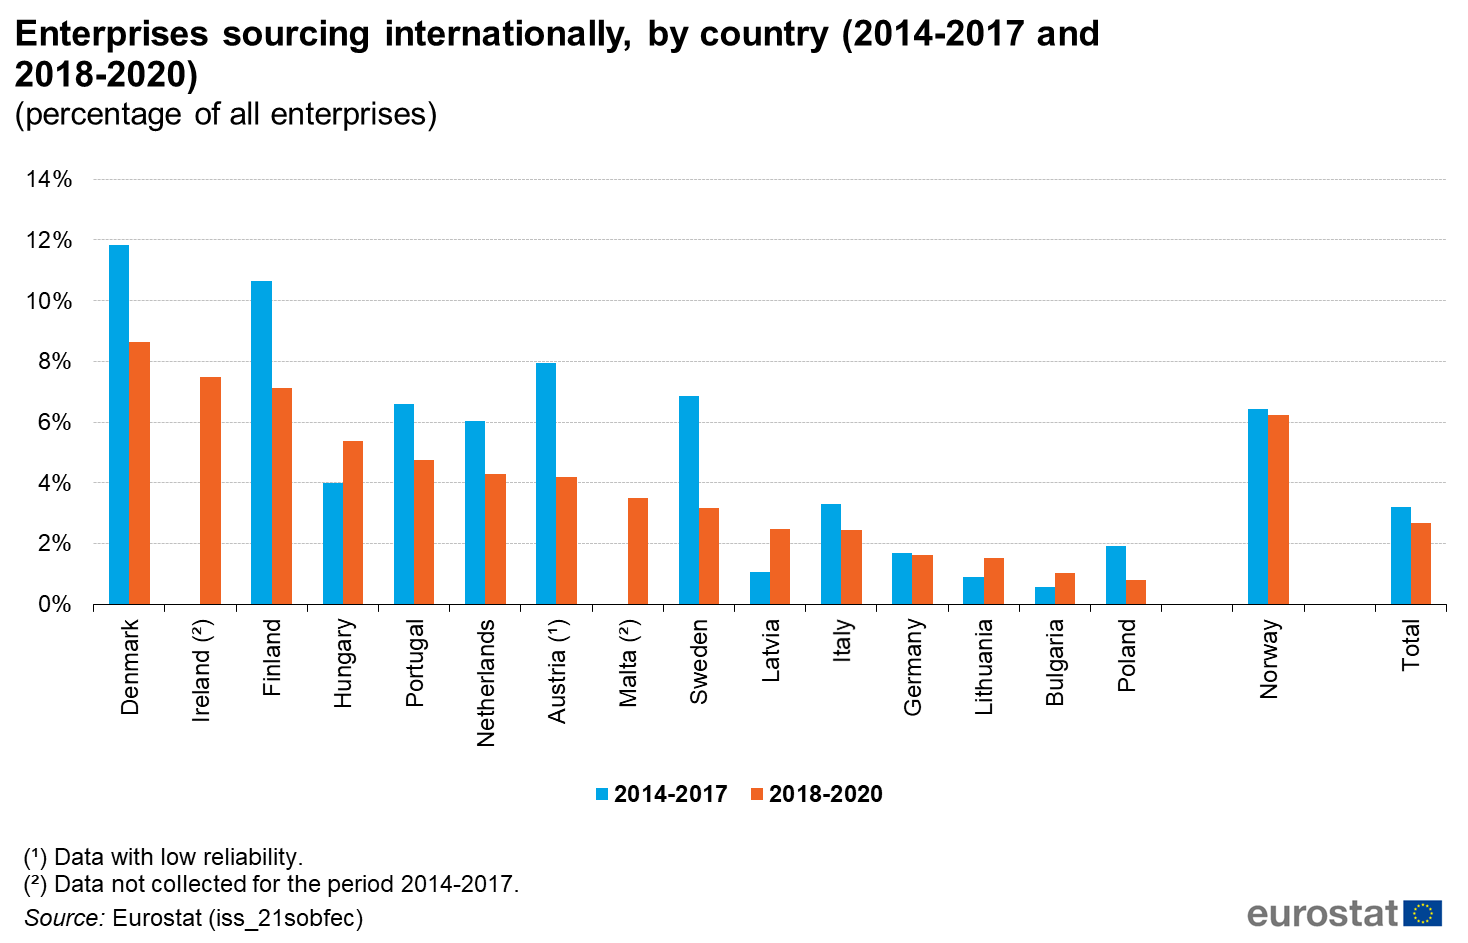
Figure 1 Enterprises sourcing internationally, by country (2014-2017 and 2018-2020).png
(
file
)
99 KB
2
13:29, 22 September 2022
Figure 01 Enterprises sourcing internationally, by country (2014-2017 and 2018-2020).png
(
file
)
96 KB
null
1
13:29, 22 September 2022
Figure 03 Manufacturing enterprises sourcing abroad (2014-2017 and 2018-2020).png
(
file
)
110 KB
null
2
13:29, 22 September 2022
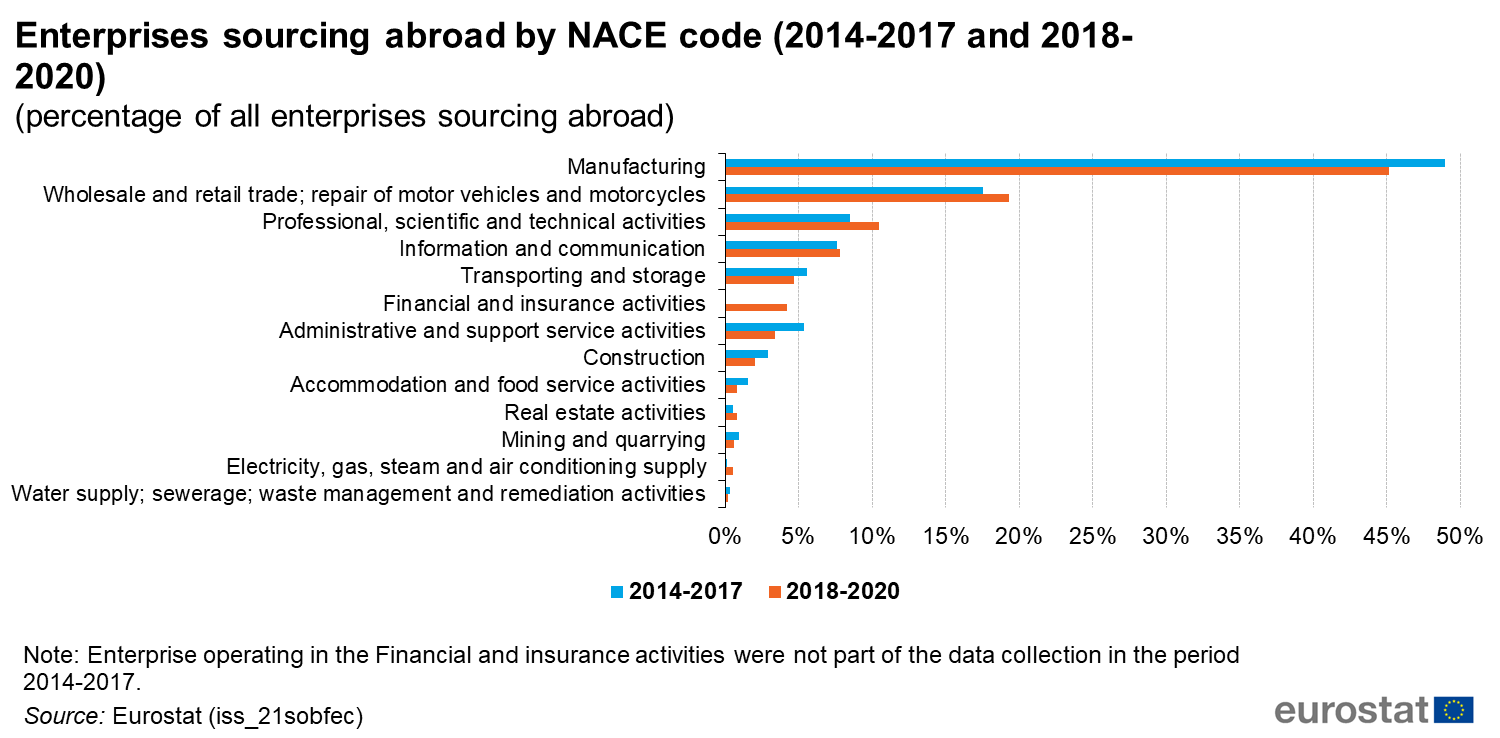
Figure 05 Enterprises sourcing abroad by NACE code (2014-2017 and 2018-2020).png
(
file
)
98 KB
null
4
13:29, 22 September 2022
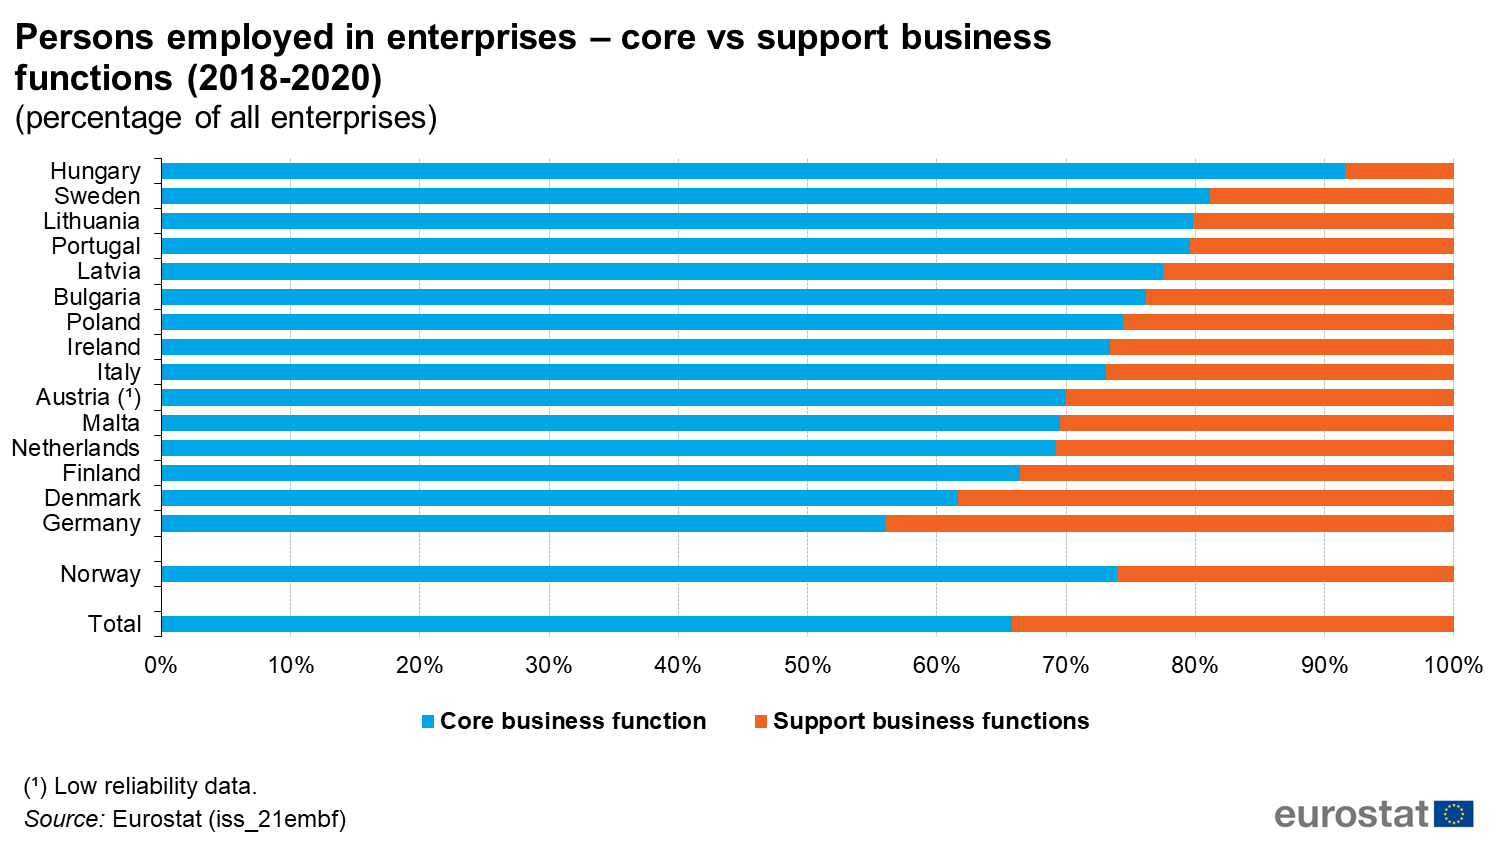
Figure 06 Persons employed in enterprises – core vs support business functions (2018-2020).png
(
file
)
77 KB
null
2
First page
Previous page
Next page
Last page
Special page
ISSN 2443-8219


.png)
.png)
,_(2014-2017).png)
_(percentage_of_all_surveyed_enterprises_sourcing_internationally).png)
_(percentage_of_all_surveyed_enterprises_sourcing_internationally).png)
_(percentage_of_all_surveyed_enterprises).png)
.png)
.png)
.png)
.png)
.png)
.png)
.png)
.png)
.png)
_(percentage_of_all_surveyed_enterprises).png)
_(percentage_of_all_surveyed_sourcing_enterprises).png)
.png)
.png)
.png)
.png)
.png)
.png)
.png)
_(percentage_of_all_surveyed_enterprises).png)


_in_total_domestic_employment_by_country,_2016.png)


_in_total_domestic_employment_by_country,_2018.png)
.png)
.png)
.png)
.png)
.png)
.png)