Tutorials
Log in
Statistics Explained
menu
search
search
Navigation
Main page
Statistical themes
Glossary
Categories
Statistics 4 beginners
Tutorials
Help
Eurostat home
Education corner
Online publications
Regional yearbook
Sustainable development
Full list
Tools
User contributions
Logs
View user groups
Special pages
search
Navigation
Main page
Statistical themes
Glossary
Categories
Statistics 4 beginners
Tutorials
Help
Eurostat home
Education corner
Online publications
Regional yearbook
Sustainable development
Full list
Tools
User contributions
Logs
View user groups
Special pages
Navigation
Main page
Statistical themes
Glossary
Categories
Statistics 4 beginners
Tutorials
Help
Eurostat home
Education corner
Online publications
Regional yearbook
Sustainable development
Full list
Tools
User contributions
Logs
View user groups
Special pages
Uploads by Budekto
This special page shows all uploaded files.
File list
Items per page:
20
50
100
250
500
Search for media name:
Username:
Include old versions of files
Go
First page
Previous page
Next page
Last page
Date
Name
Thumbnail
Size
Description
Versions
11:58, 9 March 2020
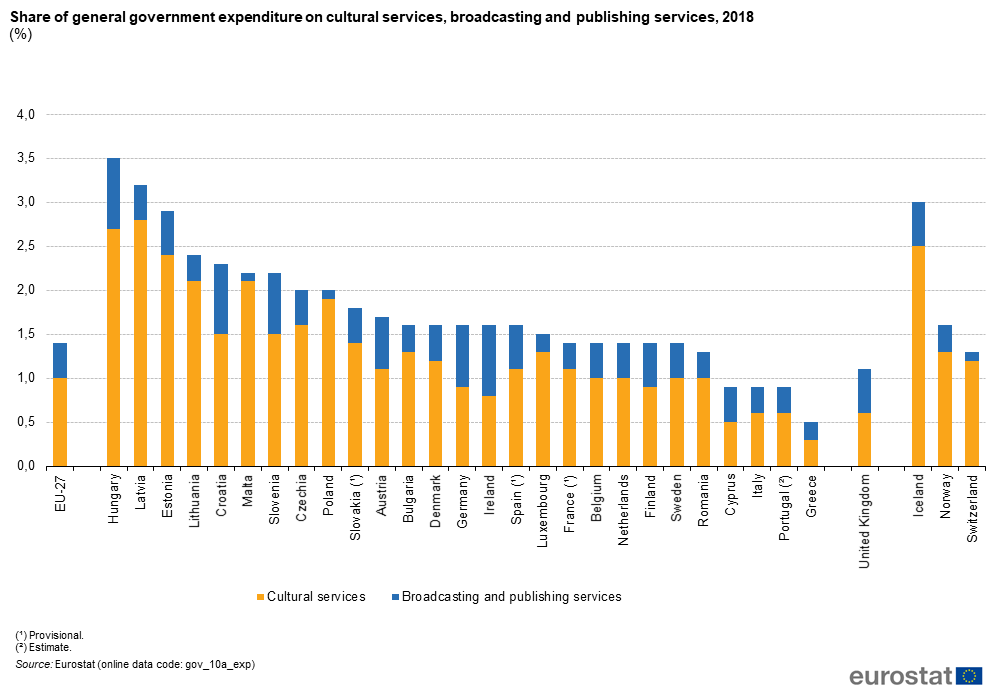
Figure 1 Share of general government expenditure on cultural services, broadcasting and publishing services, 2018 (%).png
(
file
)
68 KB
1
12:23, 9 March 2020
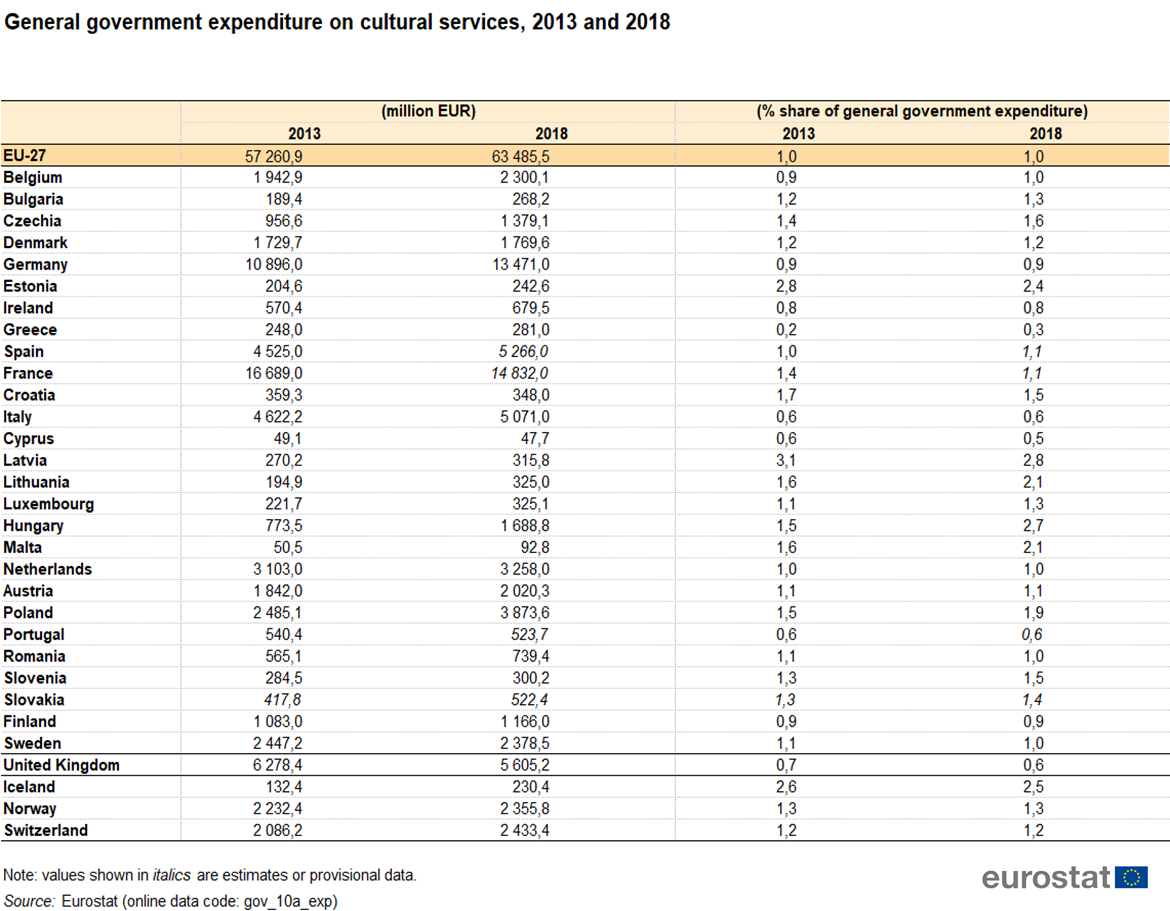
Table 1 General government expenditure on cultural services, 2013 and 2018.png
(
file
)
337 KB
1
12:25, 9 March 2020
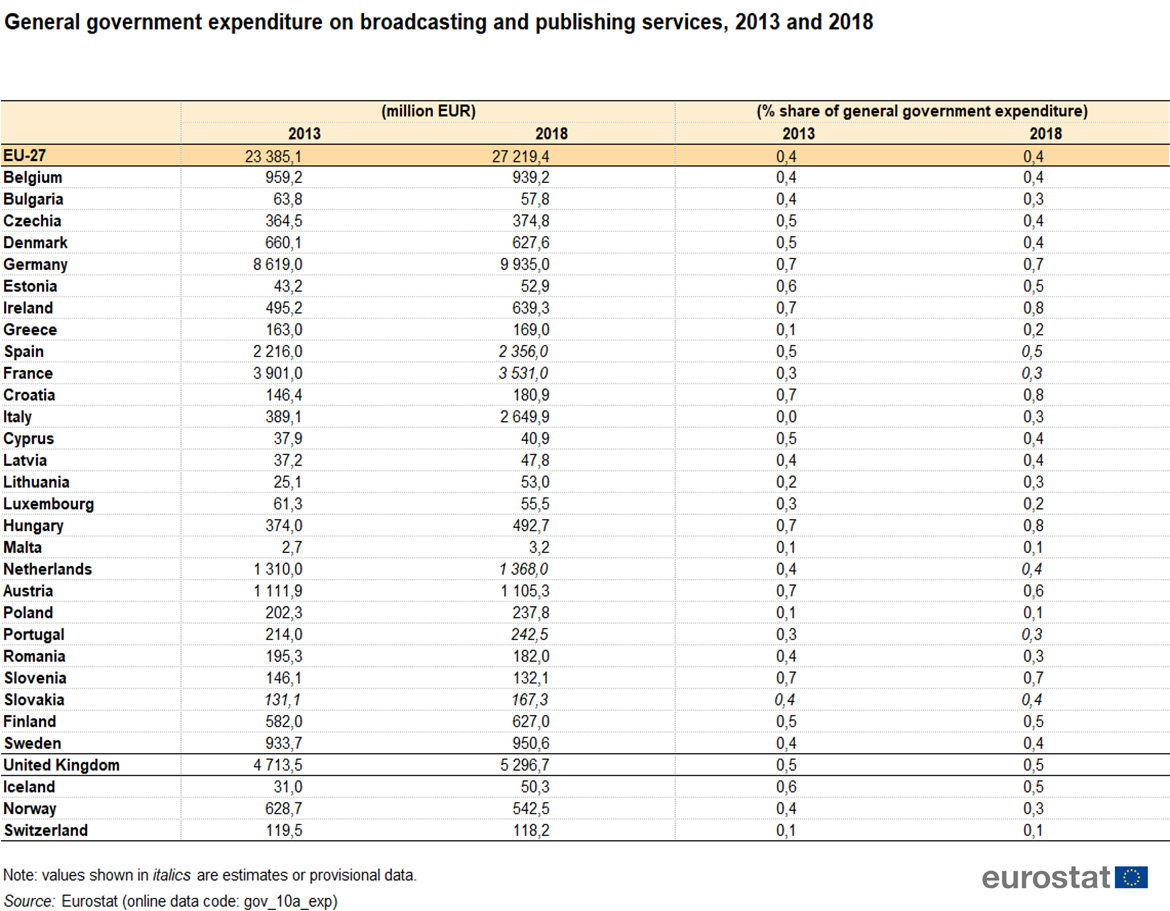
Table 2 General government expenditure on broadcasting and publishing services, 2013 and 2018.png
(
file
)
338 KB
1
12:28, 9 March 2020
Government expenditure on culture CP2020.xlsx
(
file
)
30 KB
1
10:53, 2 April 2020
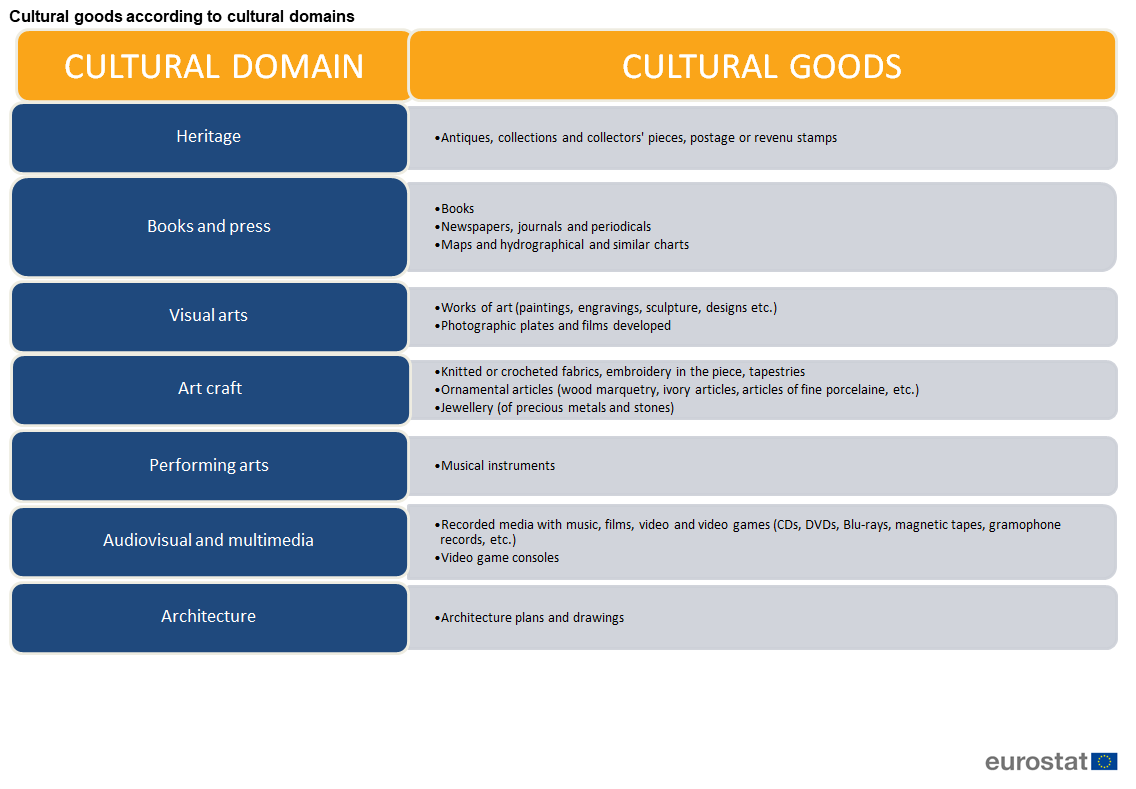
Figure 9 Cultural goods according to cultural domains.png
(
file
)
66 KB
5
15:13, 21 April 2020
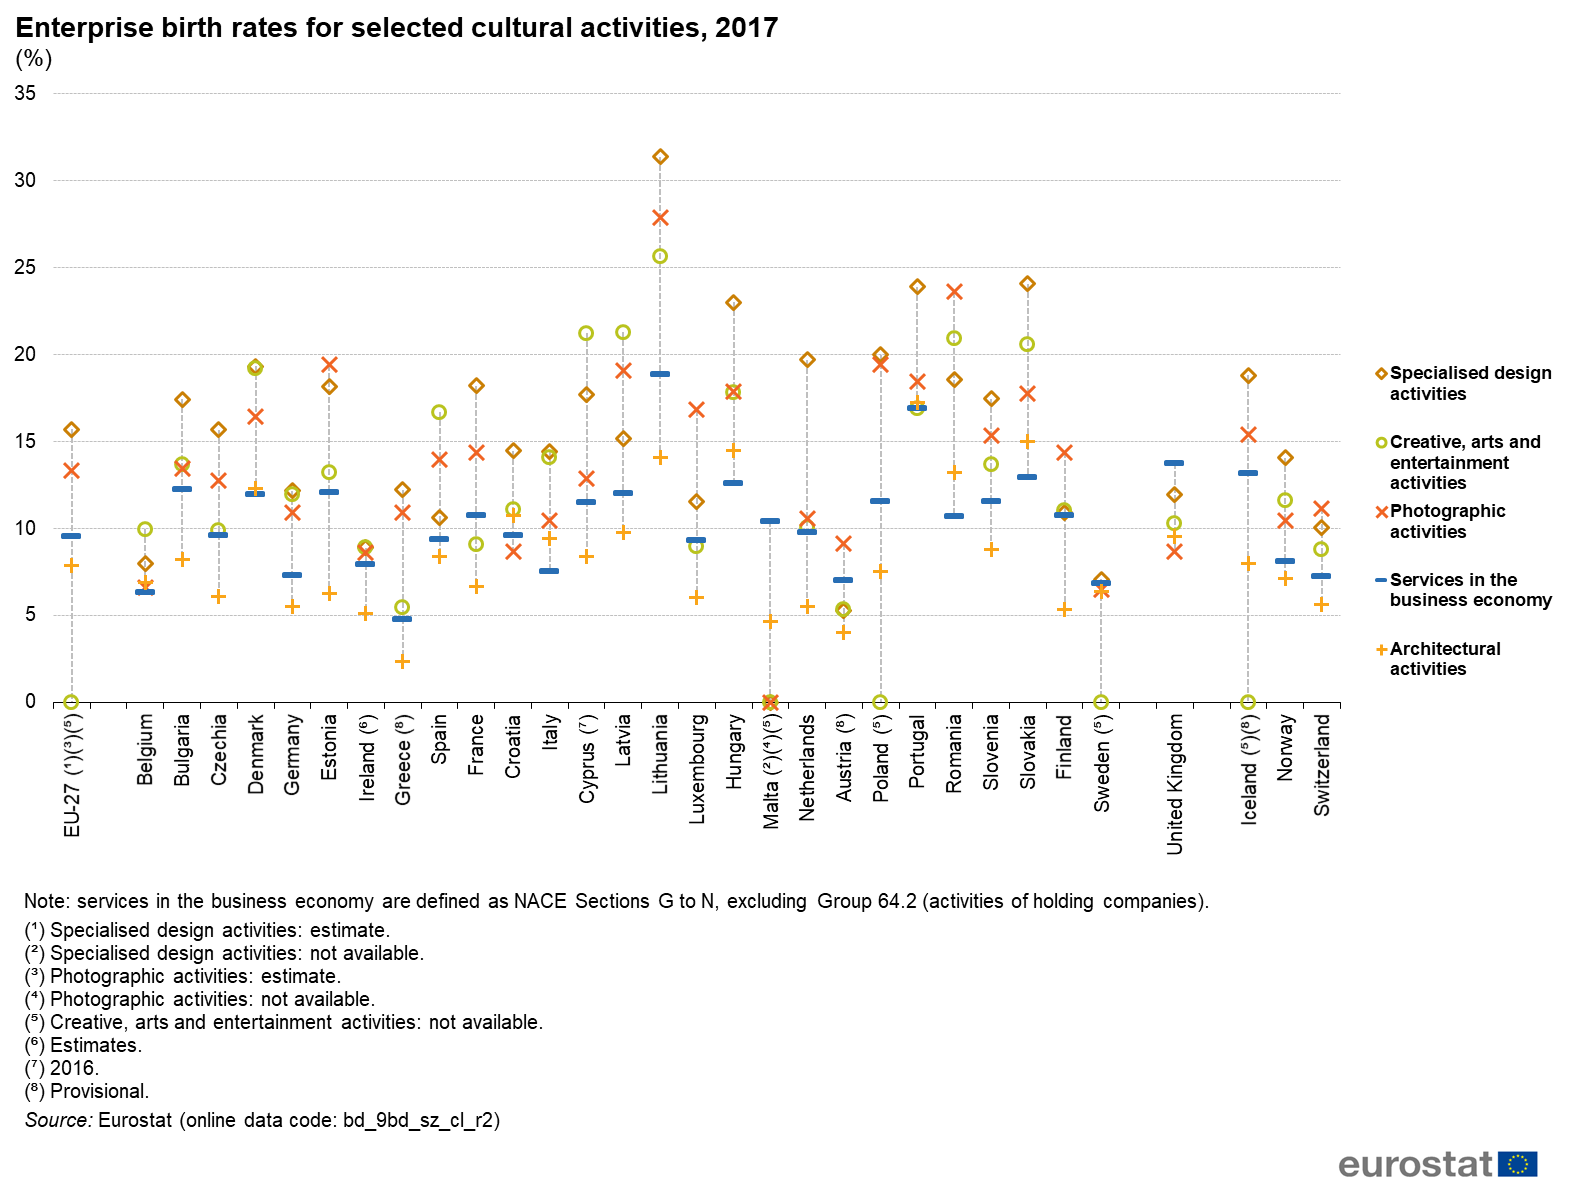
Figure 7 - Enterprise birth rates for selected cultural activities, 2017 (%).png
(
file
)
161 KB
1
15:13, 21 April 2020
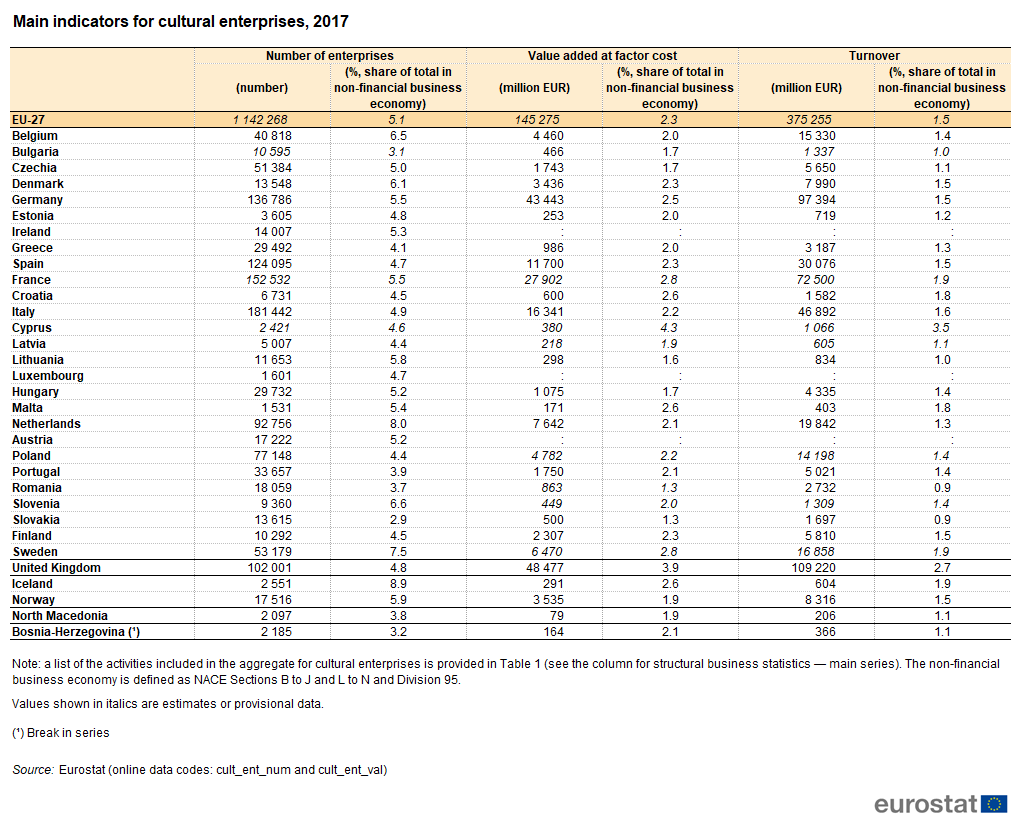
Table 2 - Main indicators for cultural enterprises, 2017.png
(
file
)
81 KB
1
15:13, 21 April 2020
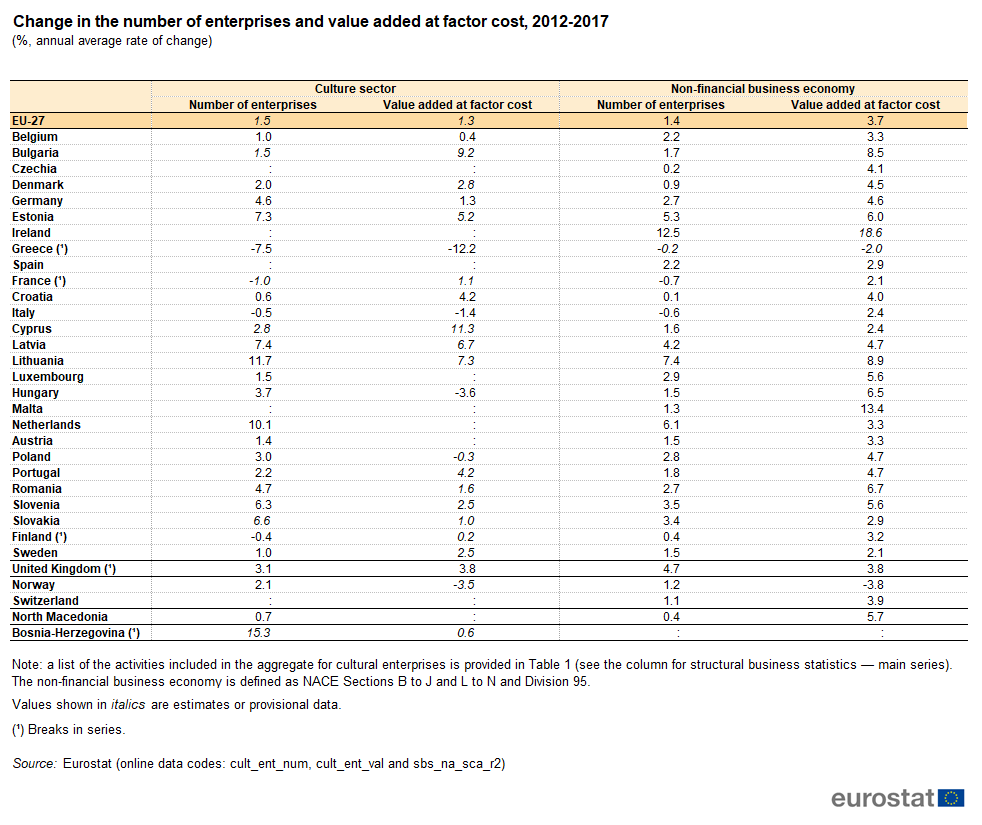
Table 3 - Change in the number of enterprises and value added at factor cost, 2012-2017.png
(
file
)
68 KB
1
15:13, 21 April 2020
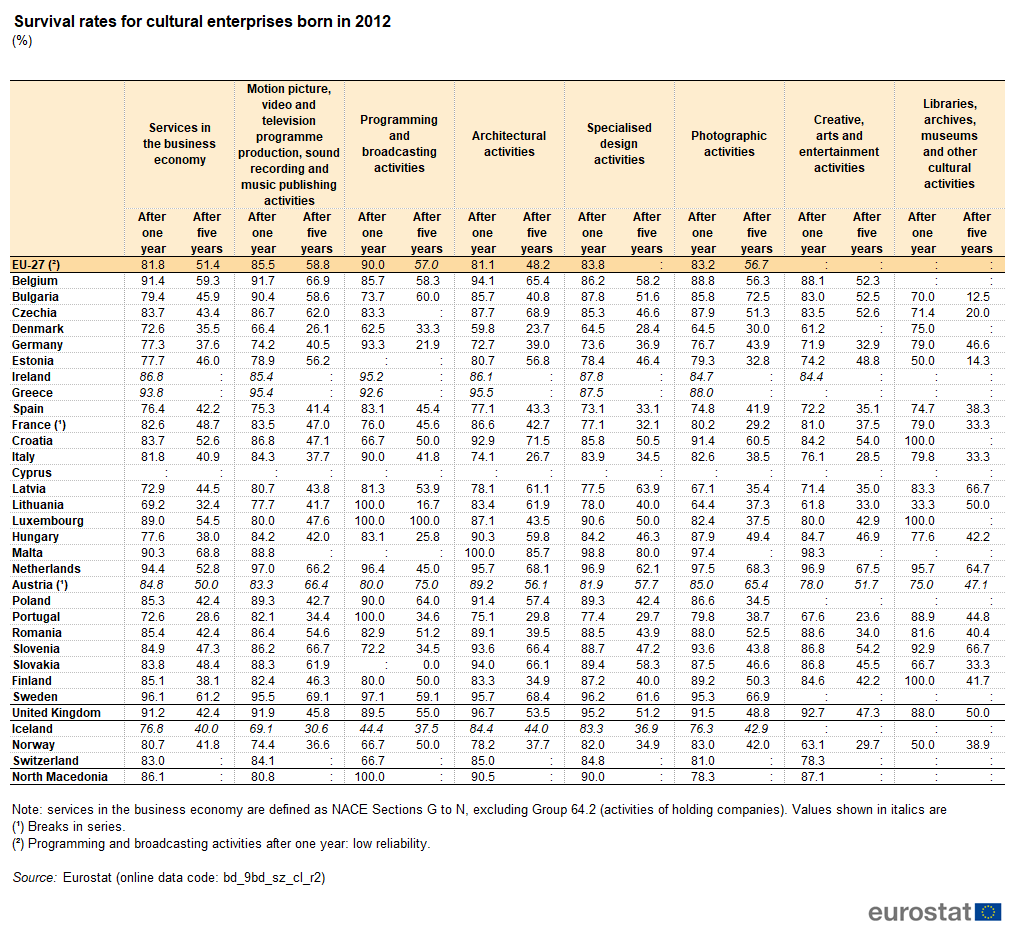
Table 5 - Survival rates for cultural enterprises born in 2012.png
(
file
)
124 KB
1
15:13, 21 April 2020
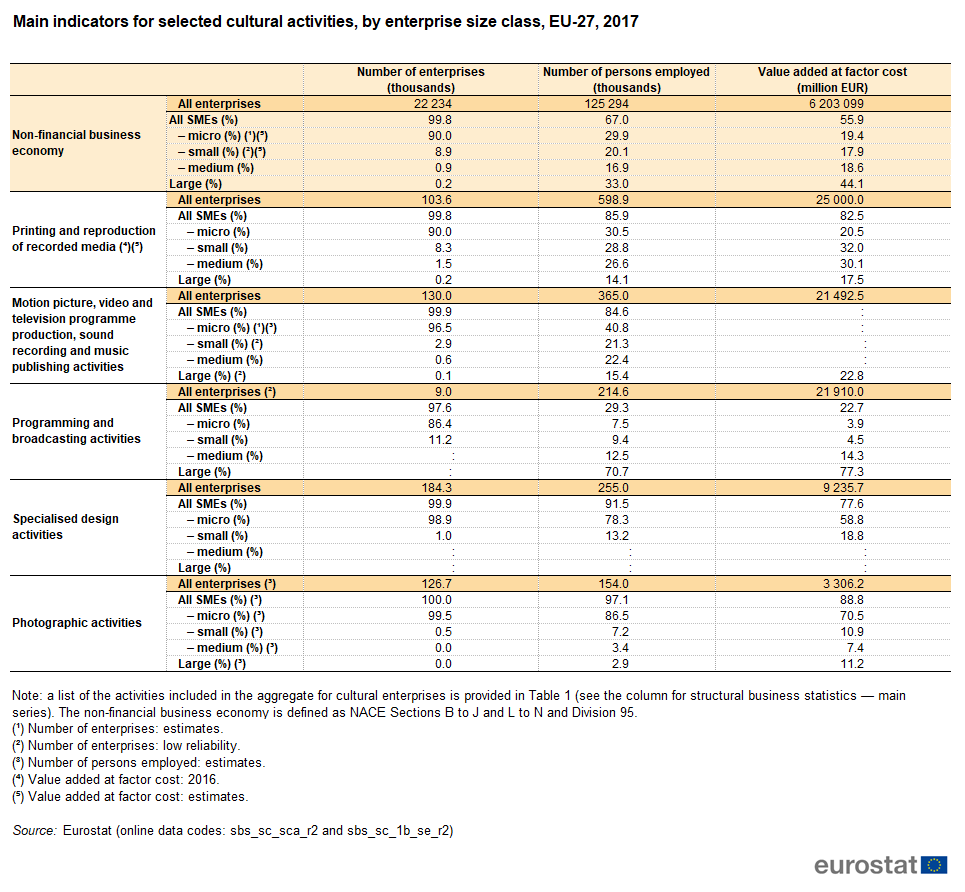
Table 4 - Main indicators for selected cultural activities, by enterprise size class, EU-27, 2017.png
(
file
)
92 KB
1
15:13, 21 April 2020
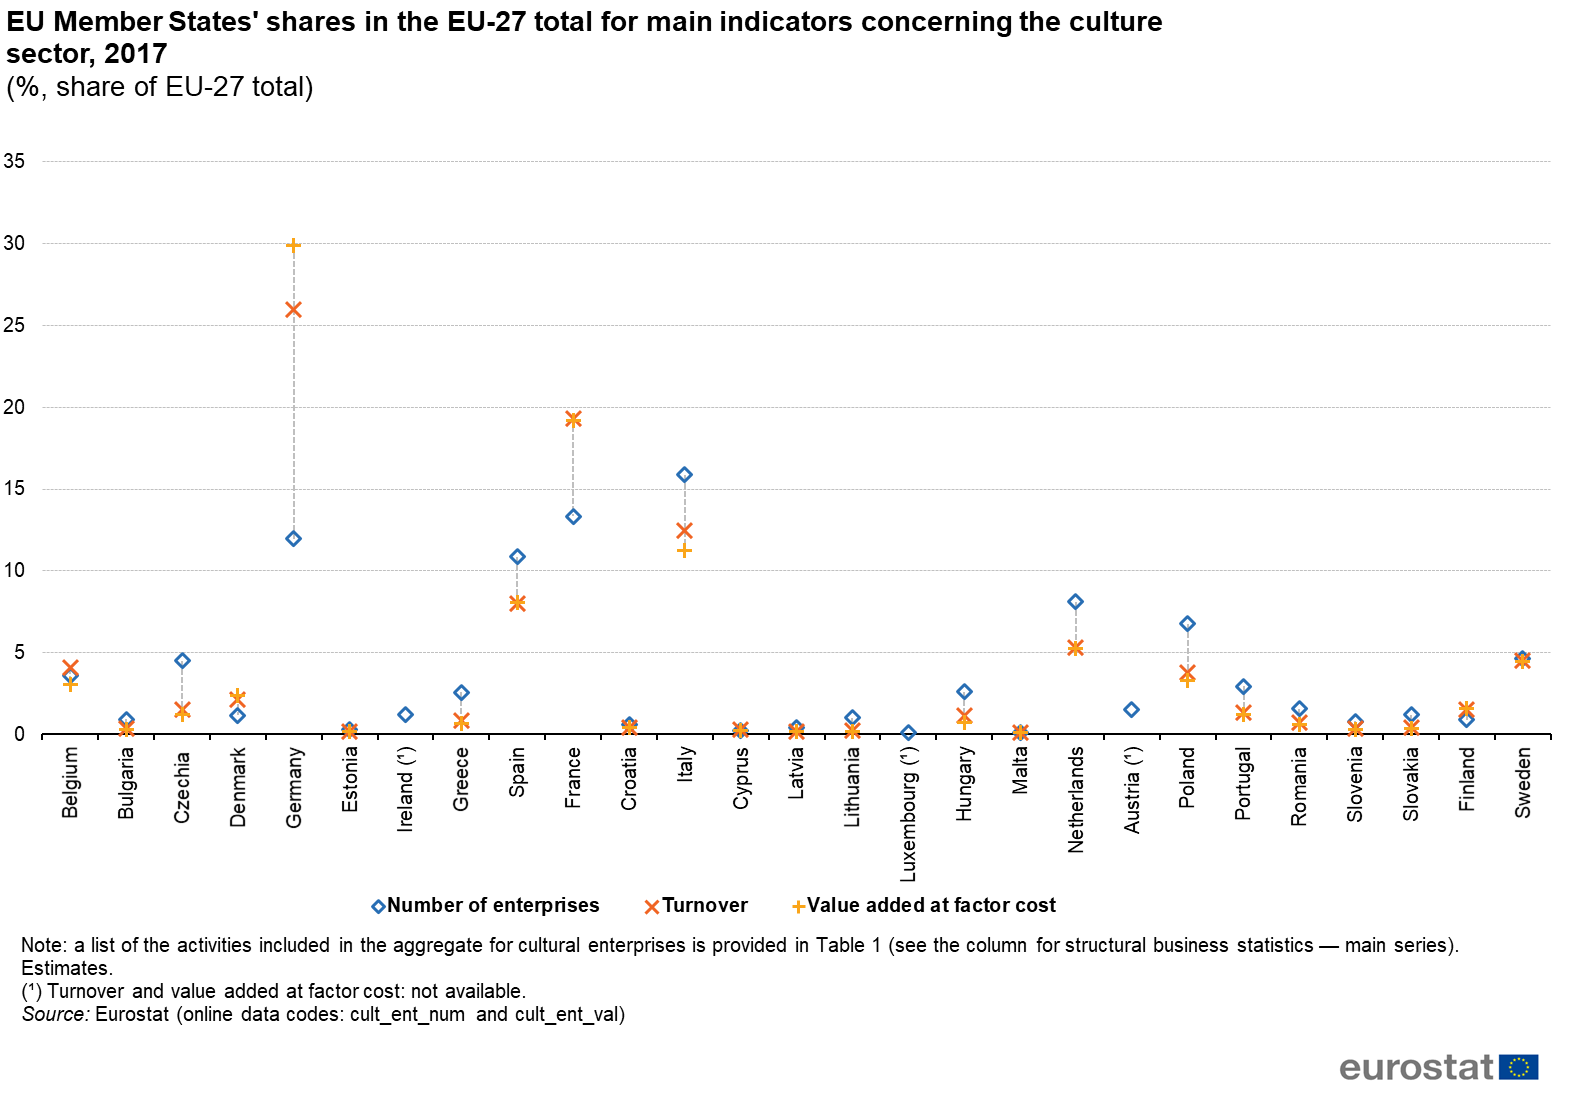
Figure 1 - EU Member States' shares in the EU-27 total for main indicators concerning the culture sector, 2017.png
(
file
)
105 KB
1
15:13, 21 April 2020
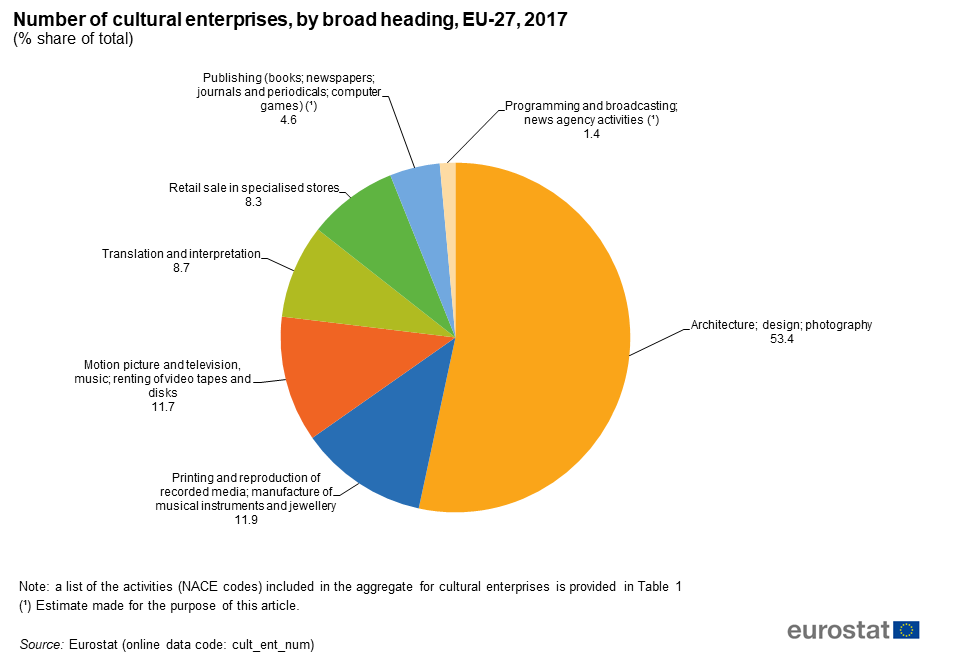
Figure 2 - Number of cultural enterprises, by broad heading, EU-27, 2017.png
(
file
)
56 KB
1
15:13, 21 April 2020
Figure 3 - Value added at factor cost for the culture sector, by broad heading, EU-27, 2017.png
(
file
)
57 KB
1
15:14, 21 April 2020
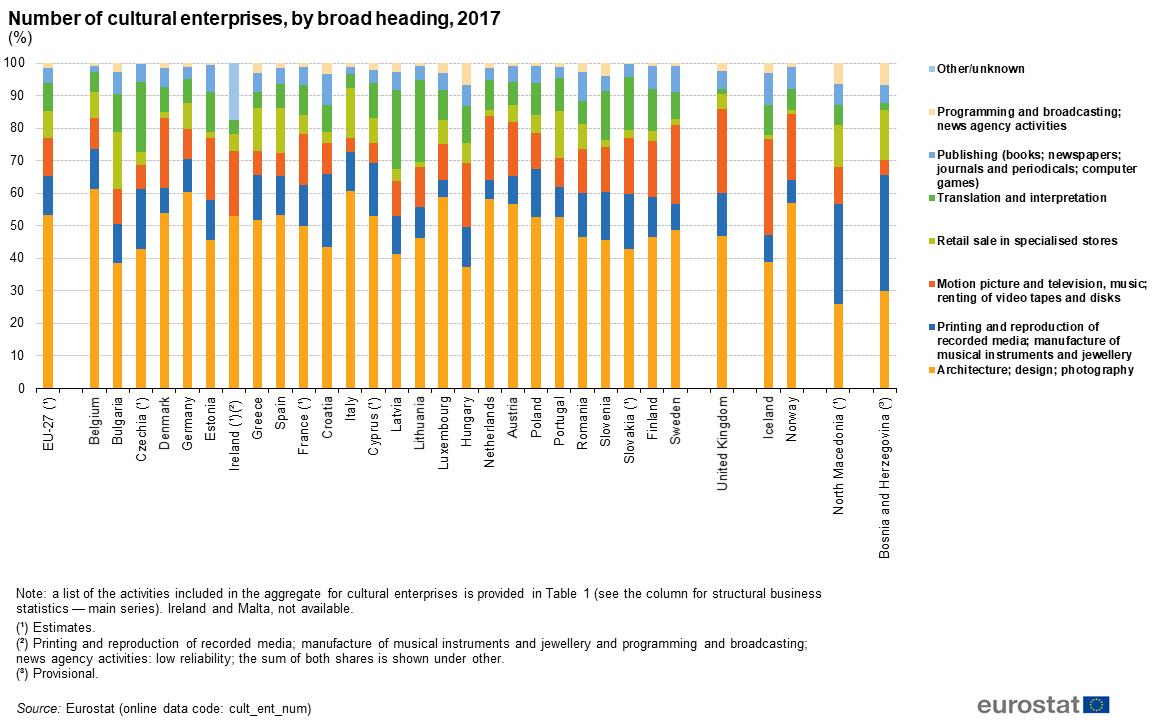
Figure 4 - Number of cultural enterprises, by broad heading, 2017.png
(
file
)
111 KB
1
15:14, 21 April 2020
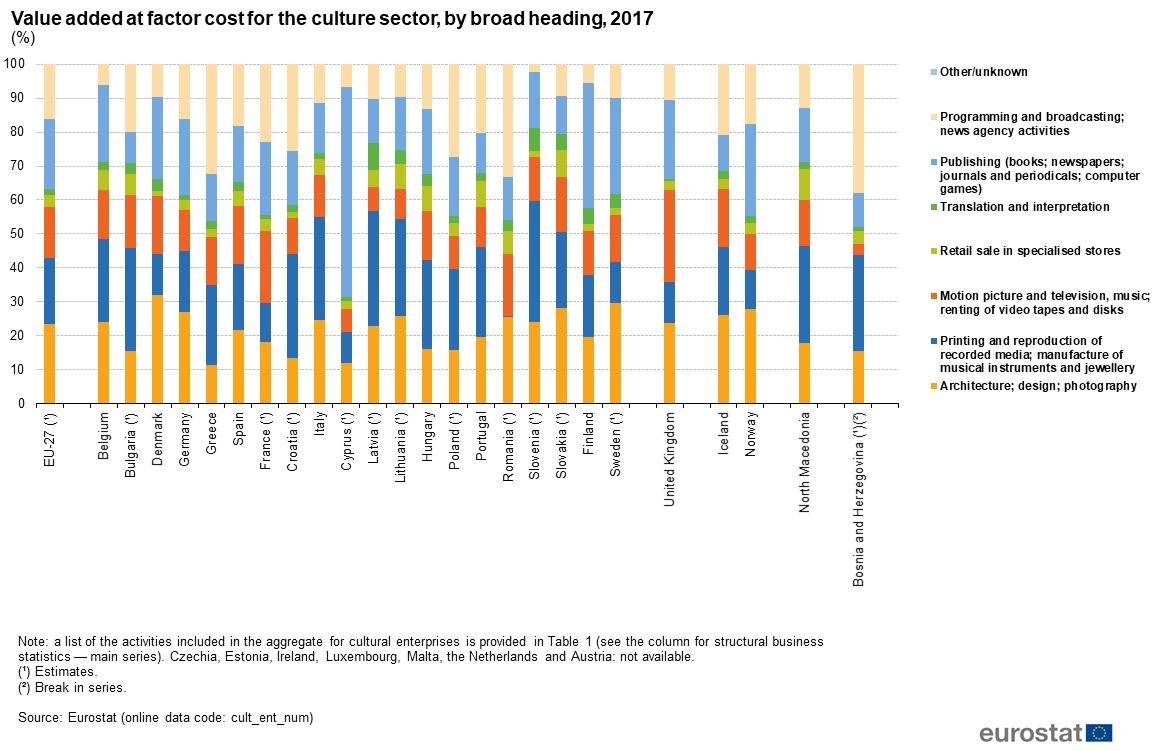
Figure 5 - Value added at factor cost for the culture sector, by broad heading, 2017.png
(
file
)
107 KB
1
15:14, 21 April 2020
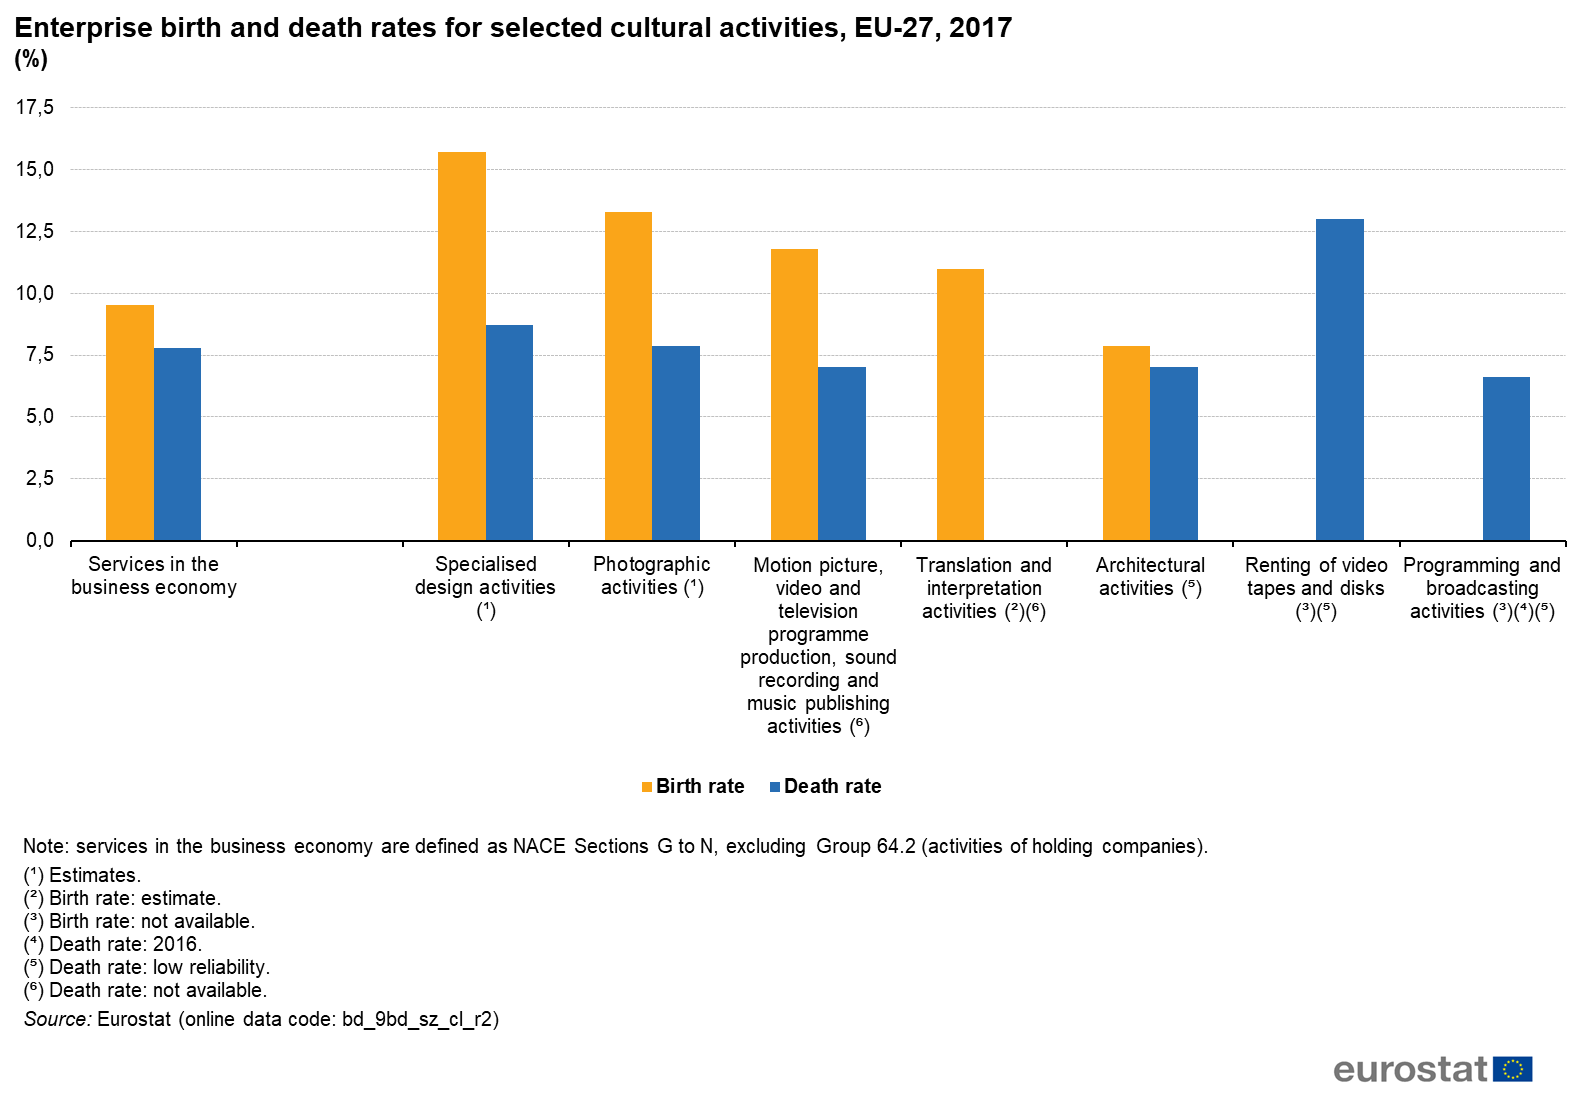
Figure 6 - Enterprise birth and death rates for selected cultural activities, EU-27, 2017.png
(
file
)
110 KB
1
15:14, 21 April 2020
Cultural enterprises CP2020.xlsx
(
file
)
168 KB
1
08:42, 15 July 2020
Fig1 Cultural employment 2019.png
(
file
)
134 KB
1
08:42, 15 July 2020
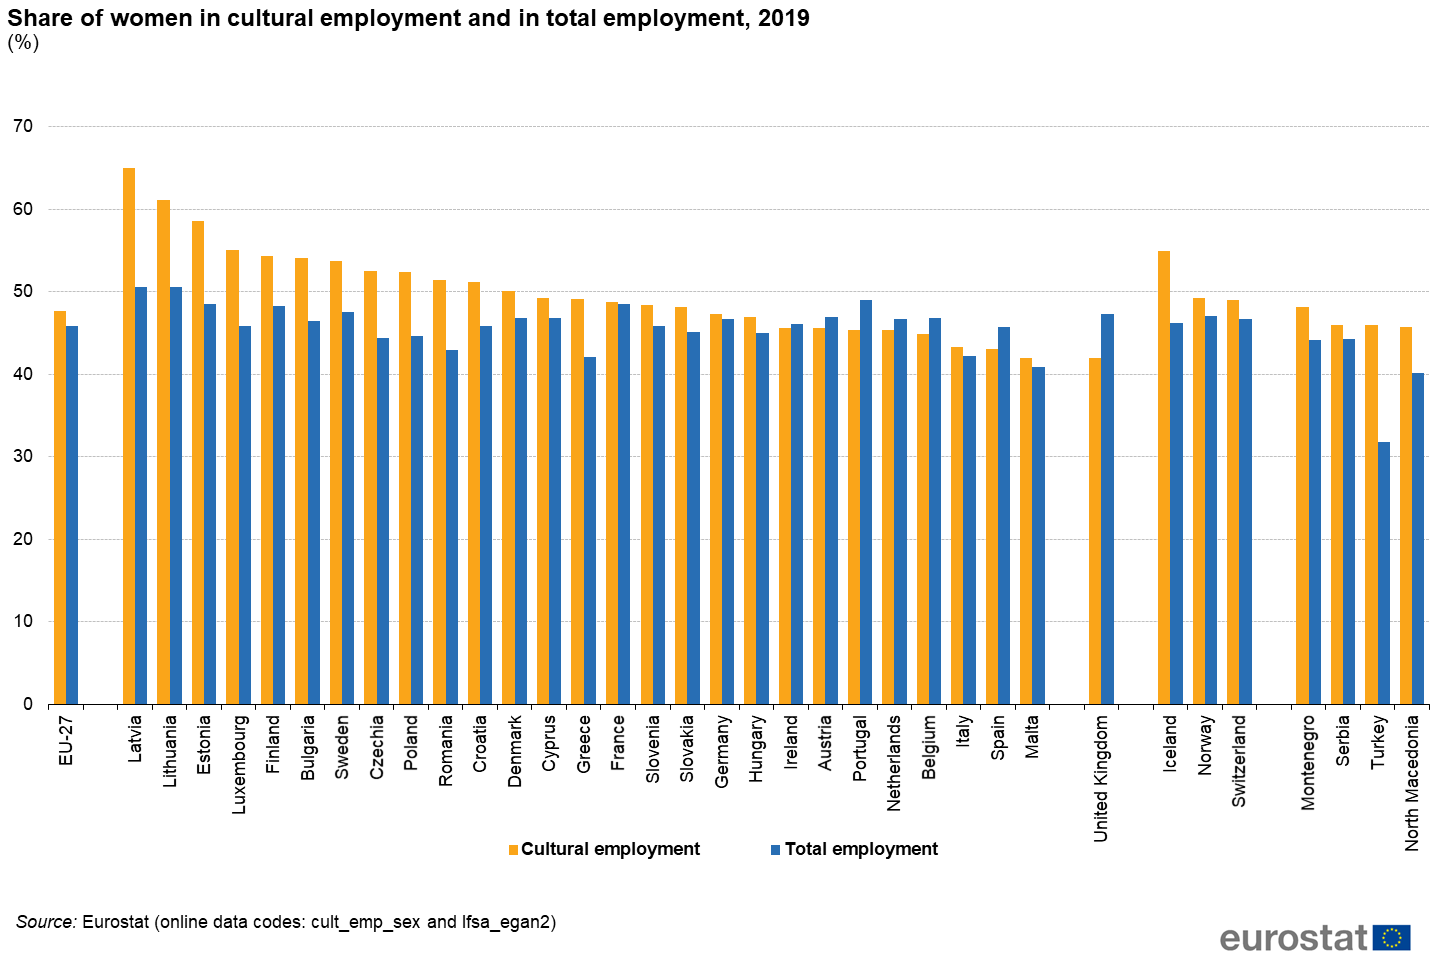
Fig2 Share of women in cultural employment and in total employment 2019 (%).png
(
file
)
172 KB
1
08:42, 15 July 2020
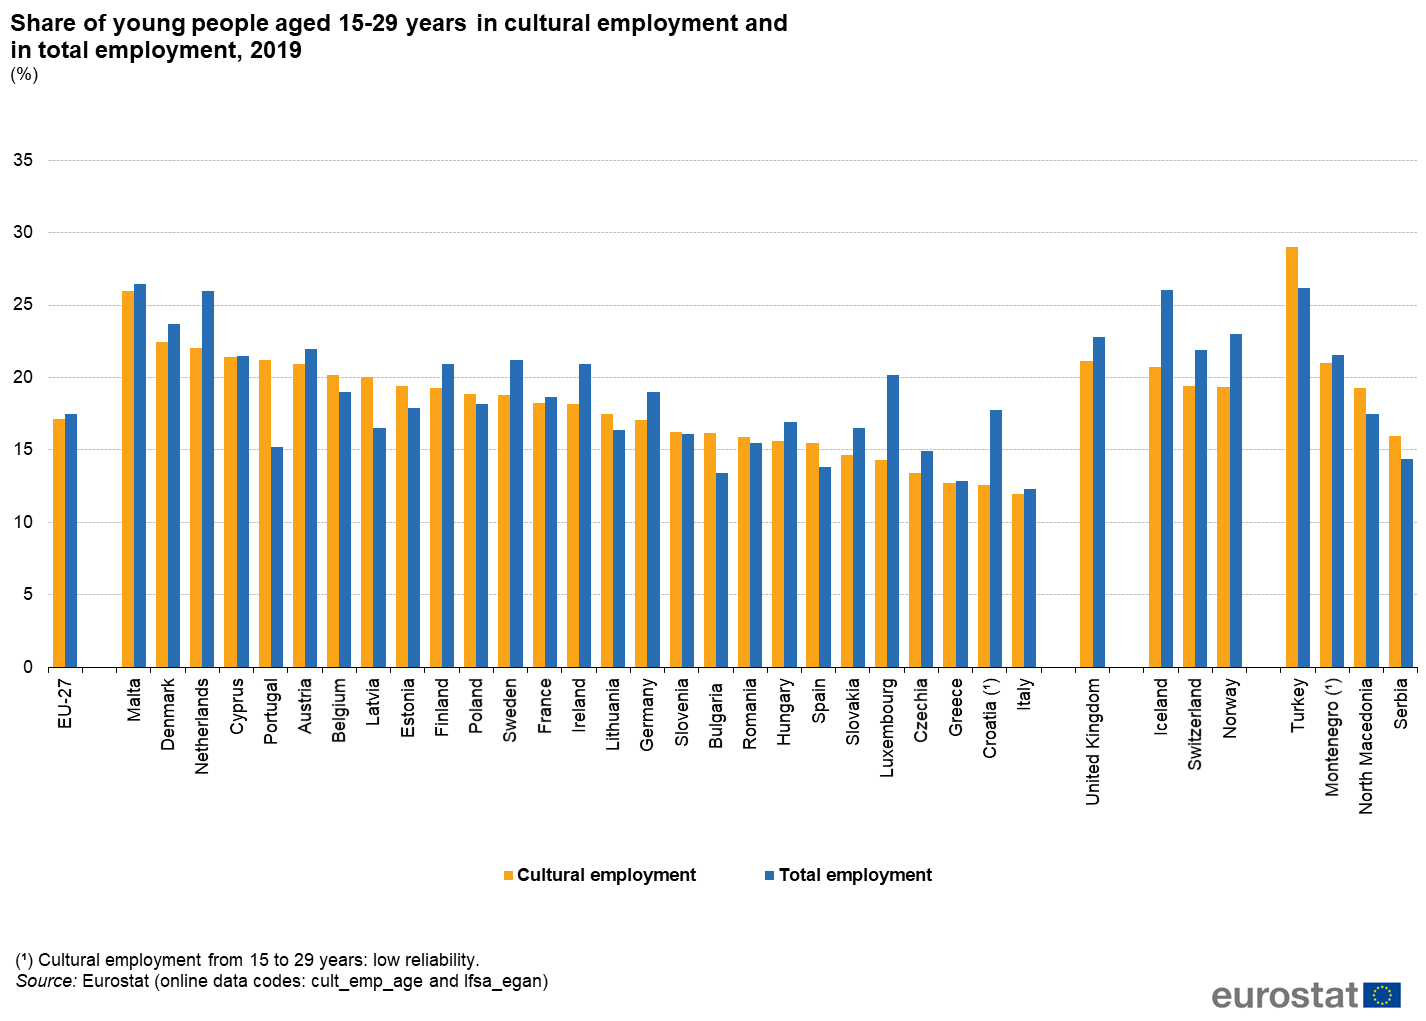
Fig3 Share of young people aged 15-29 years in cultural employment and in total employment 2019 (%).png
(
file
)
153 KB
1
08:42, 15 July 2020
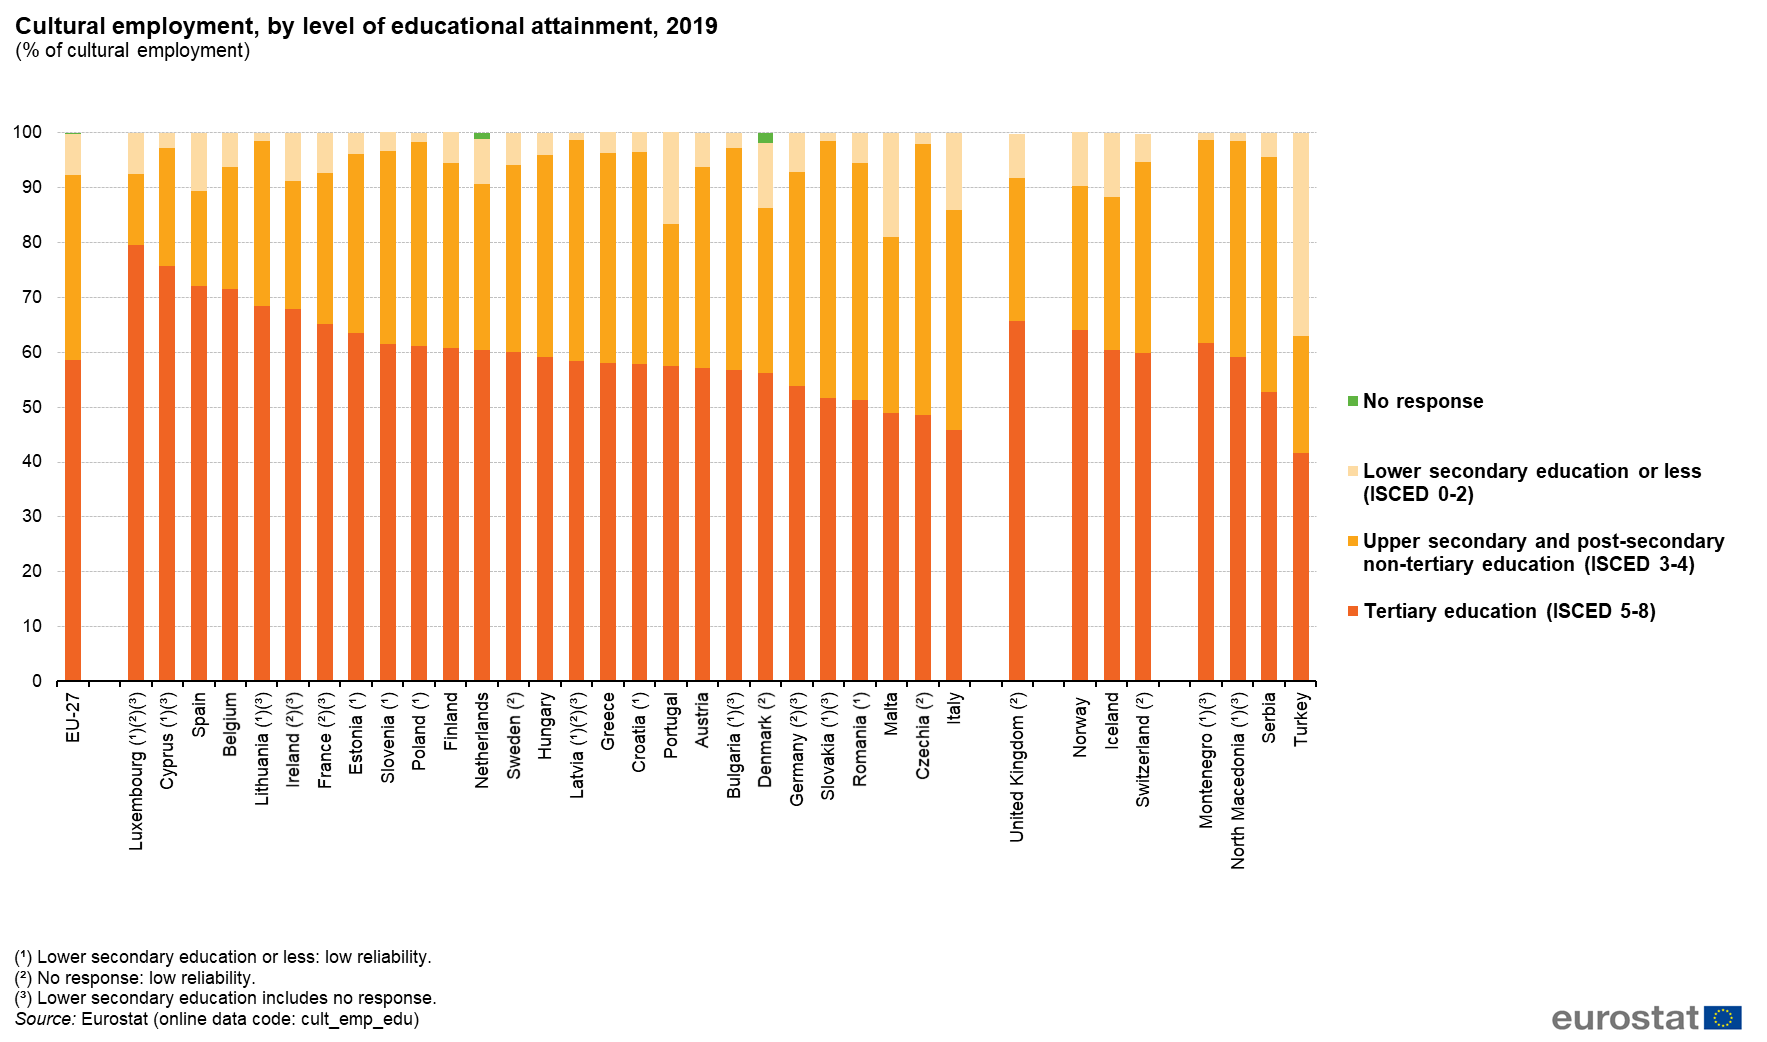
Fig4 Cultural employment by level of educational attainment 2019.png
(
file
)
194 KB
1
08:42, 15 July 2020
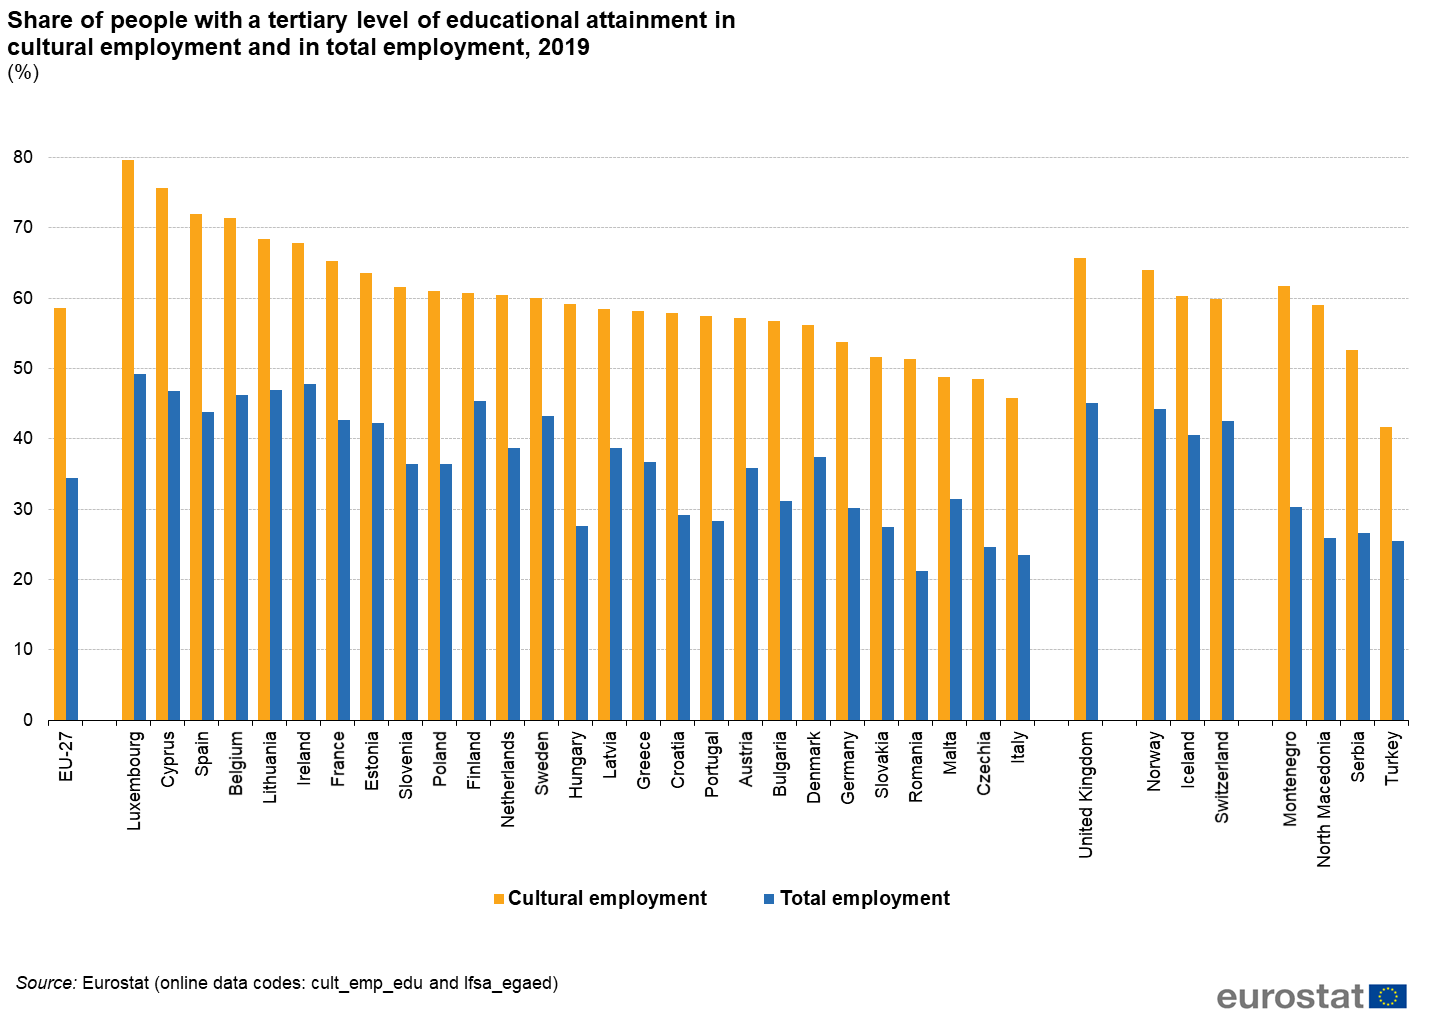
Fig5 Share of people with a tertiary level of educational attainment in cultural employment and in total employment 2019 (%).png
(
file
)
171 KB
1
08:42, 15 July 2020
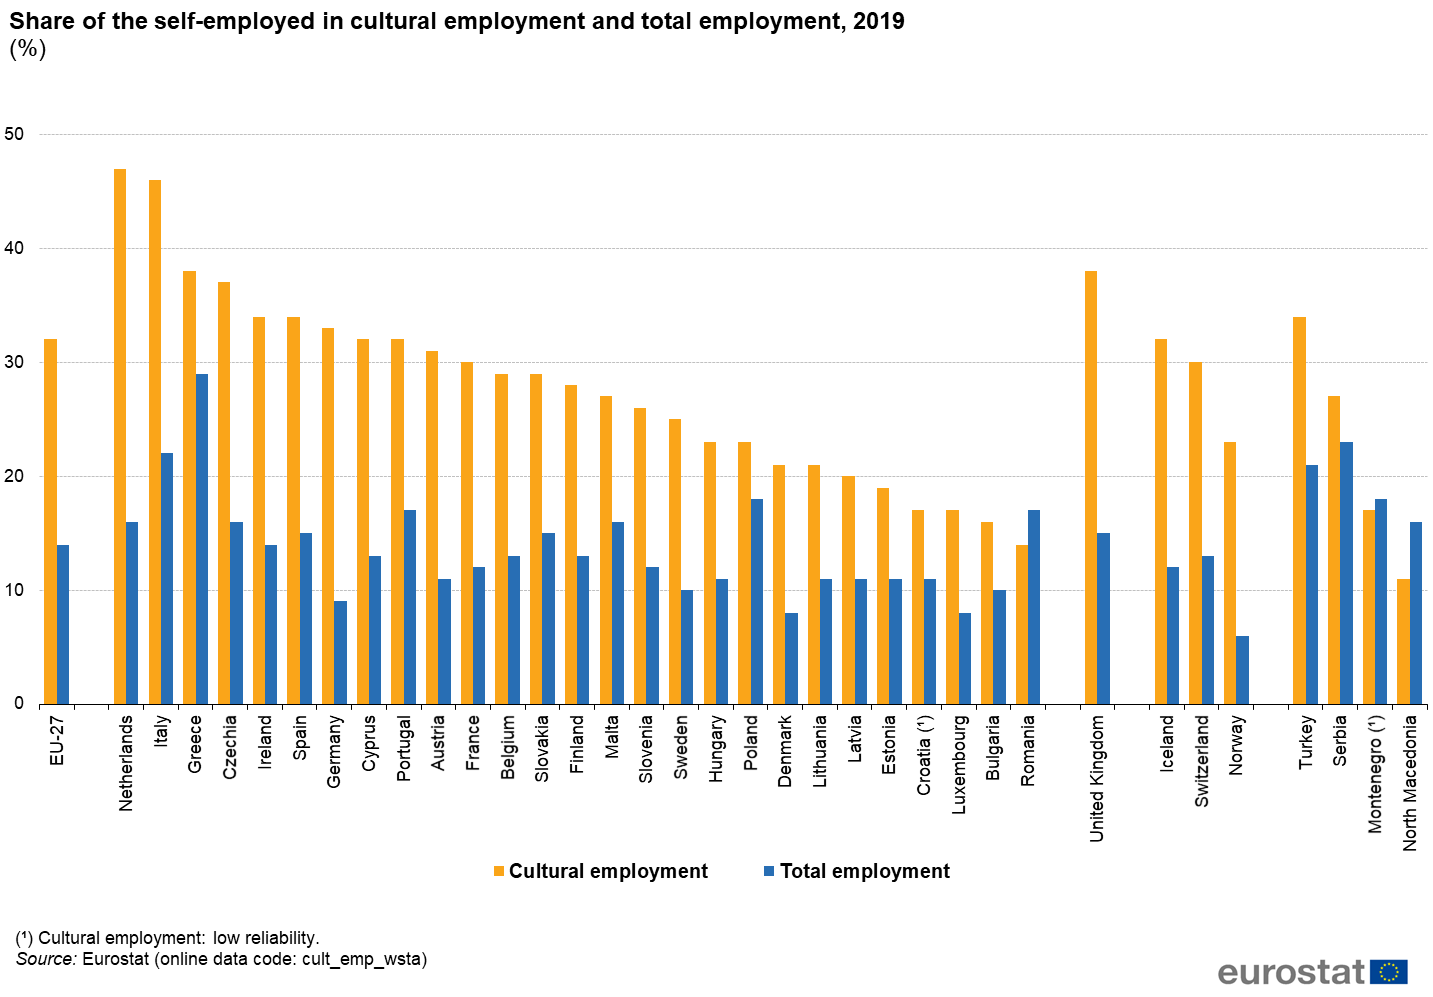
Fig6 Share of the self-employed in cultural employment and total employment 2019 (%).png
(
file
)
144 KB
1
08:42, 15 July 2020
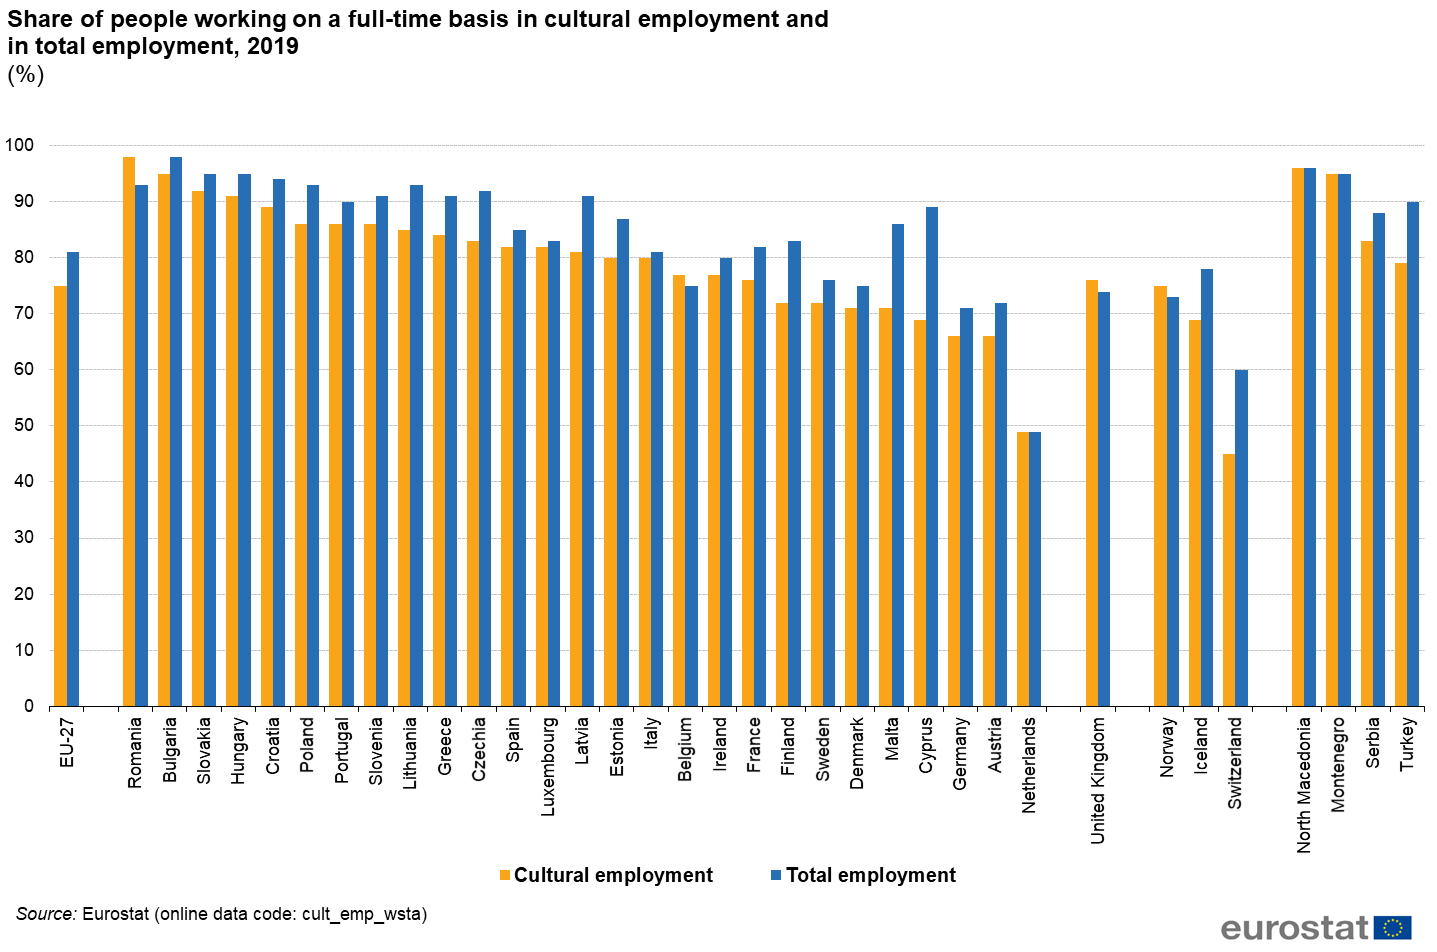
Fig7 Share of people working on a full-time basis in cultural employment and in total employment 2019 (%).png
(
file
)
190 KB
1
08:42, 15 July 2020
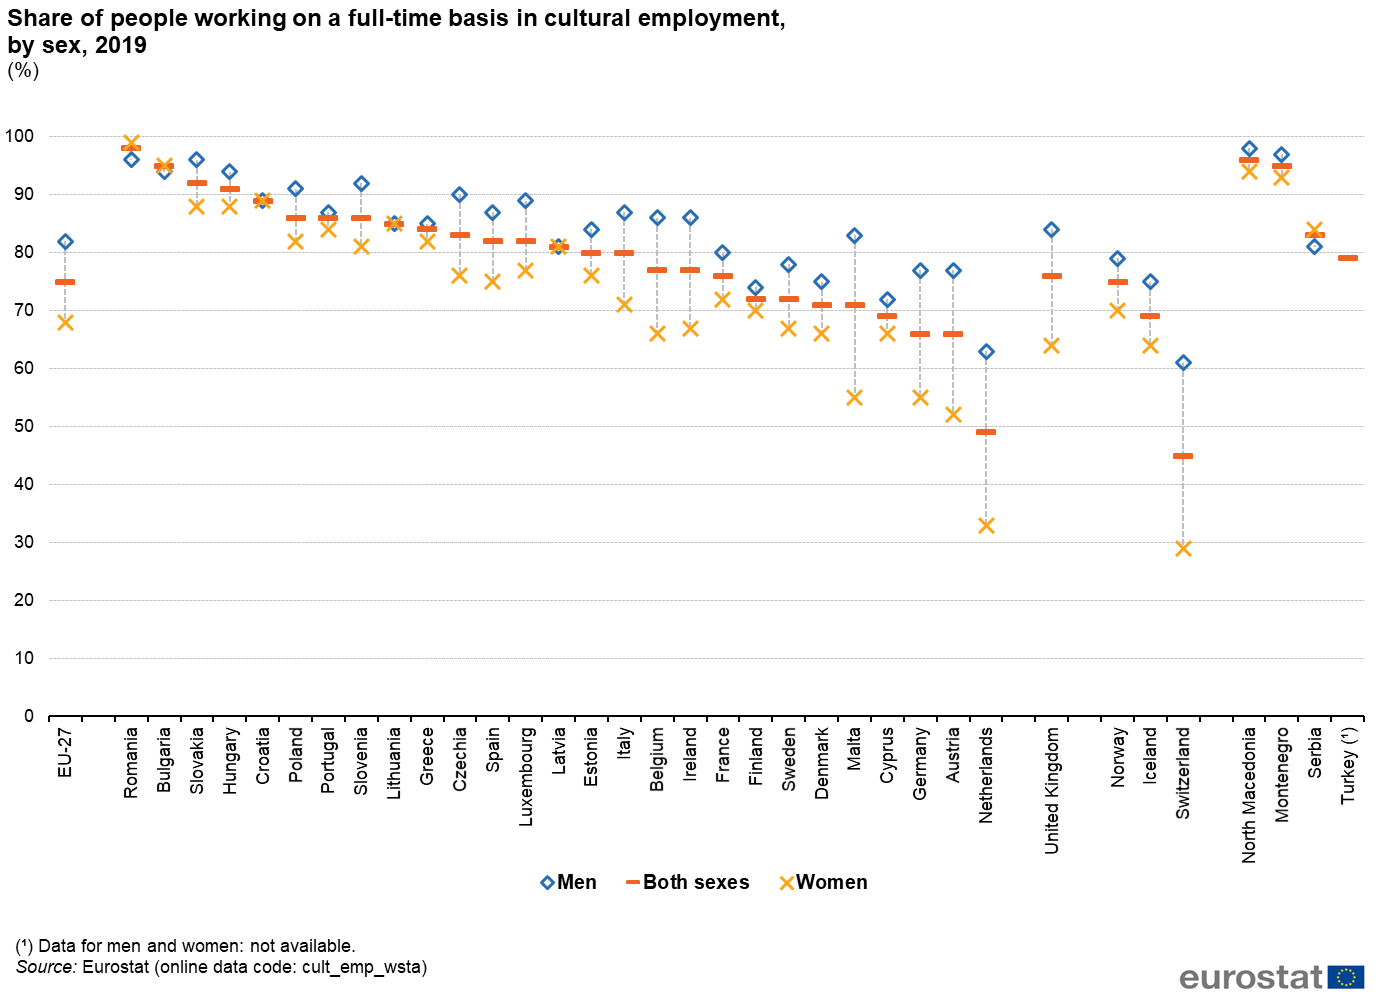
Fig8 Share of people working on a full-time basis in cultural employment by sex 2019 (%).png
(
file
)
98 KB
1
08:42, 15 July 2020
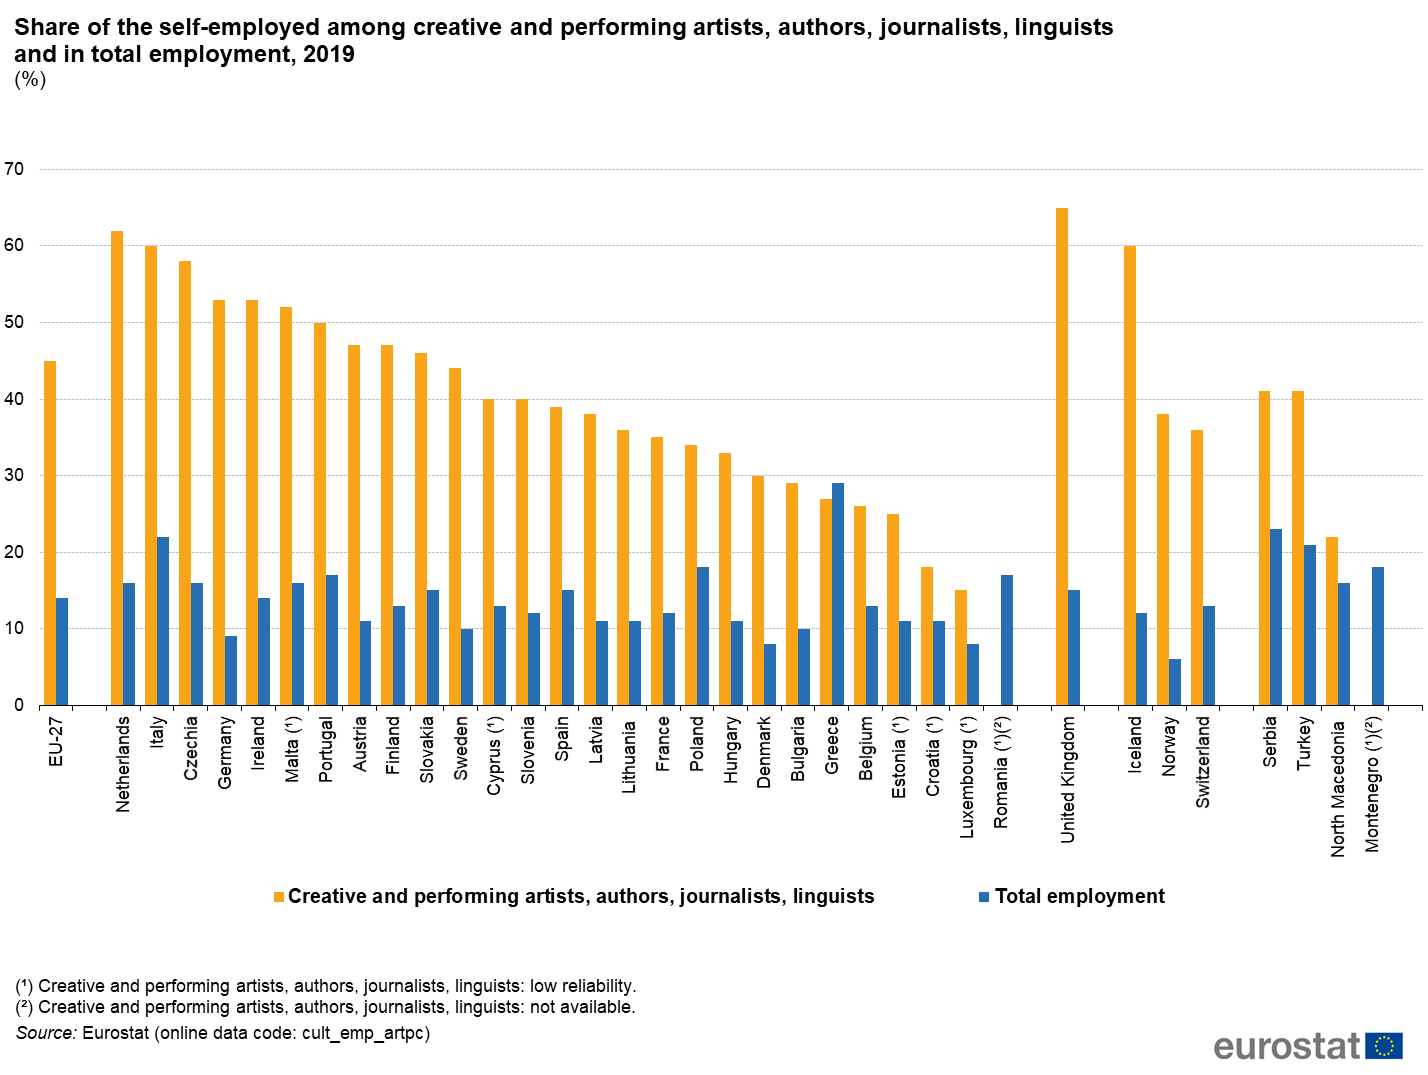
Fig9 Share of the self-employed among creative and performing artists authors journalists linguists and in total employment 2019 (%).png
(
file
)
152 KB
1
08:42, 15 July 2020
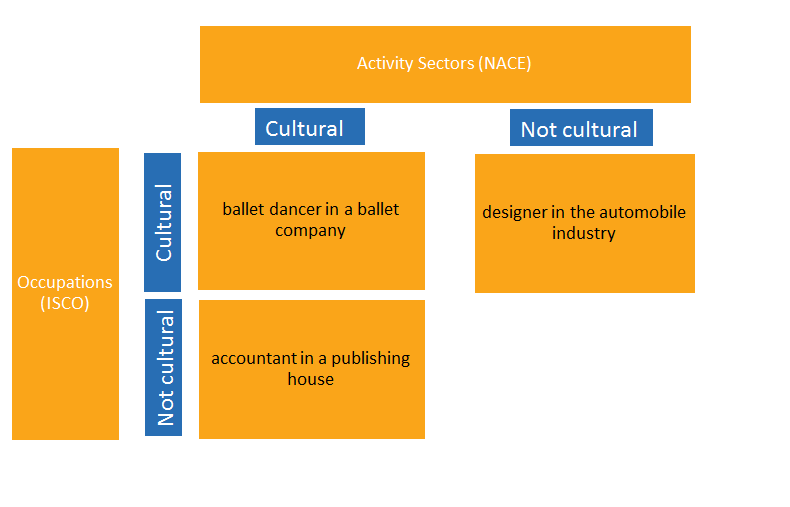
Fig10 Classification system for cultural employment (examples).png
(
file
)
15 KB
1
11:14, 17 July 2020
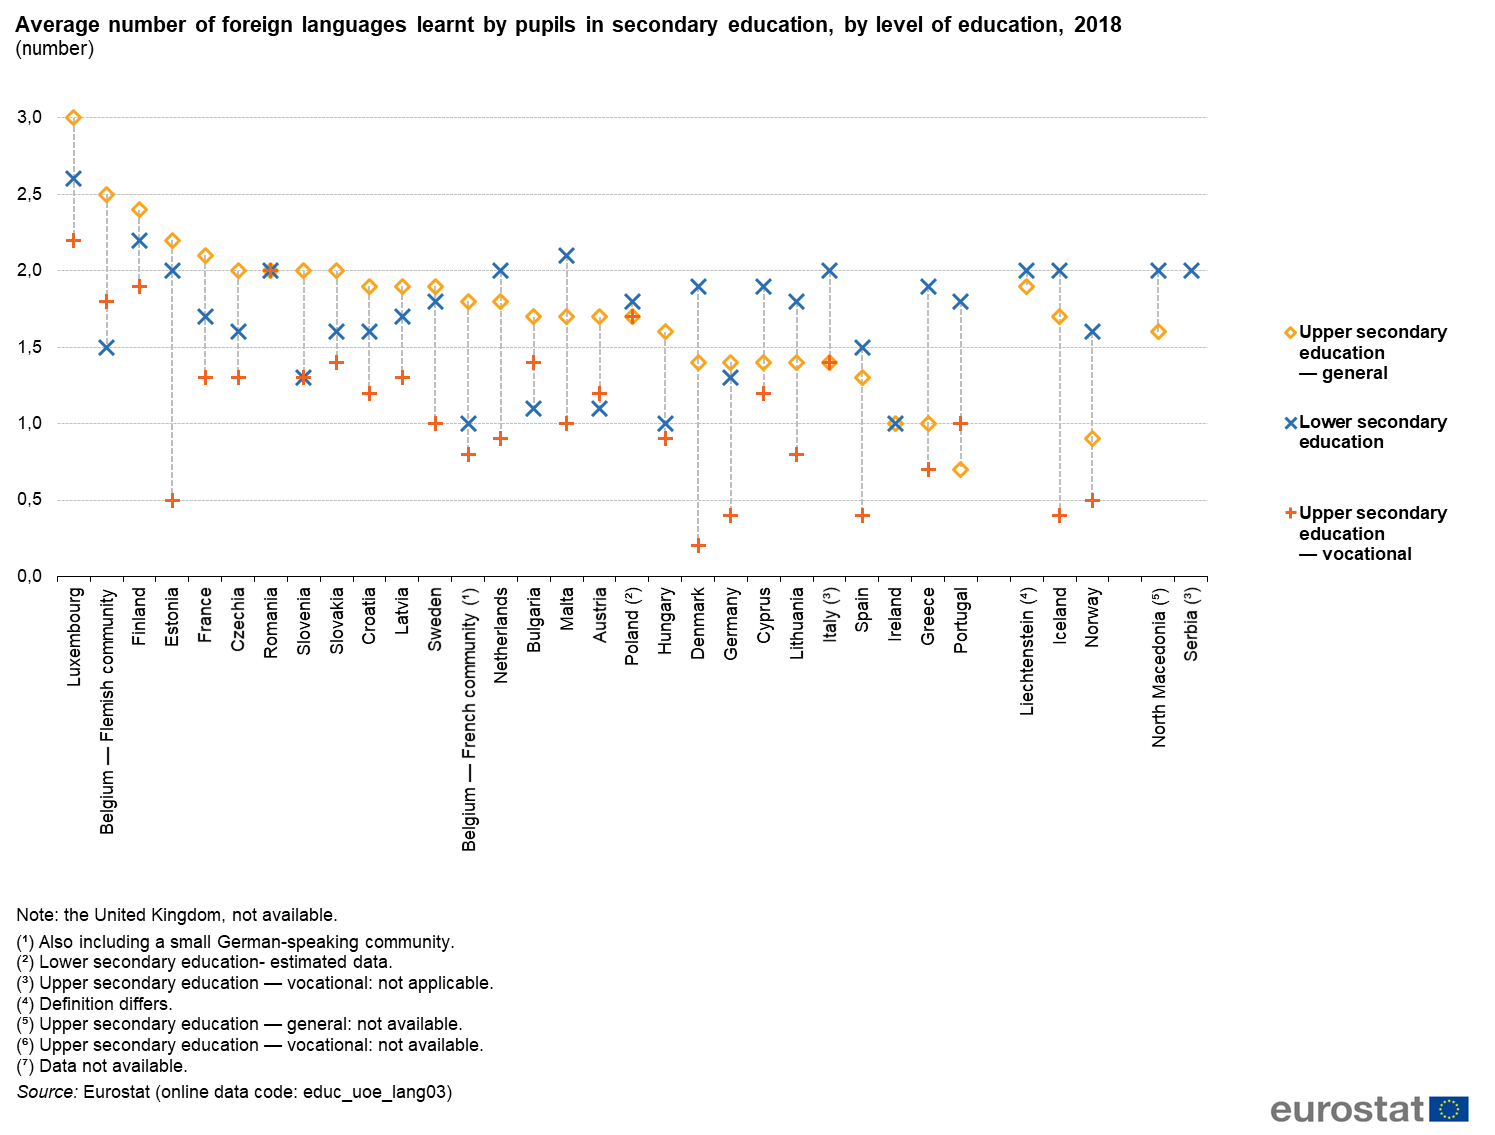
Figure4 Average number of foreign languages learnt by pupils in secondary education by level 2018 (number).png
(
file
)
127 KB
1
11:14, 17 July 2020
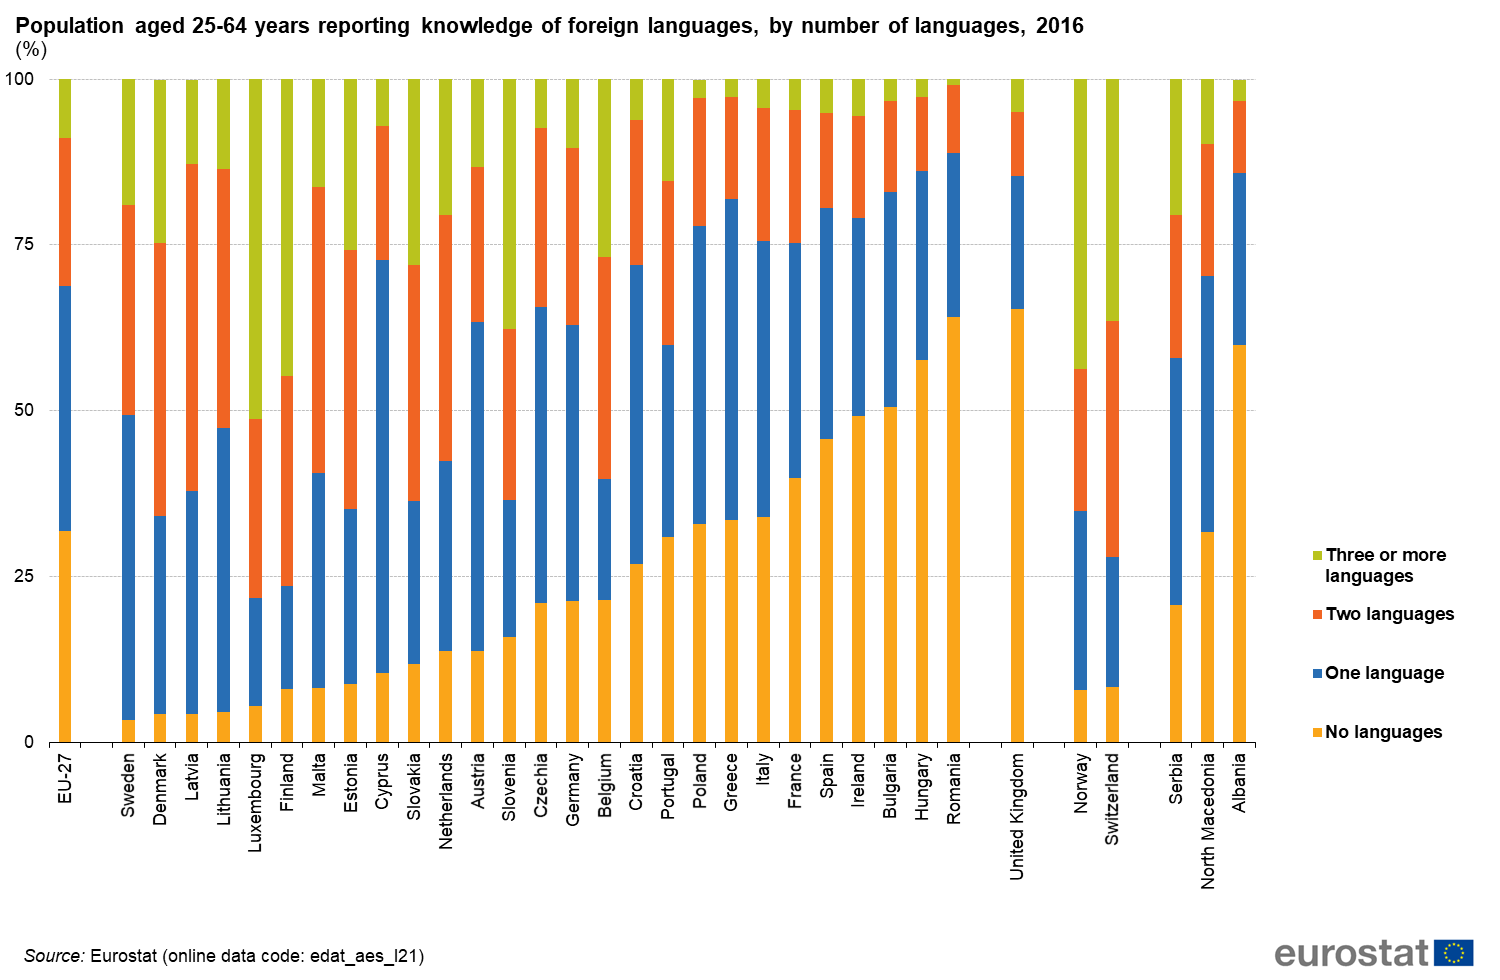
Figure5 Population aged 25-64 years reporting knowledge of foreign languages by number of languages 2016 (%).png
(
file
)
179 KB
1
11:14, 17 July 2020
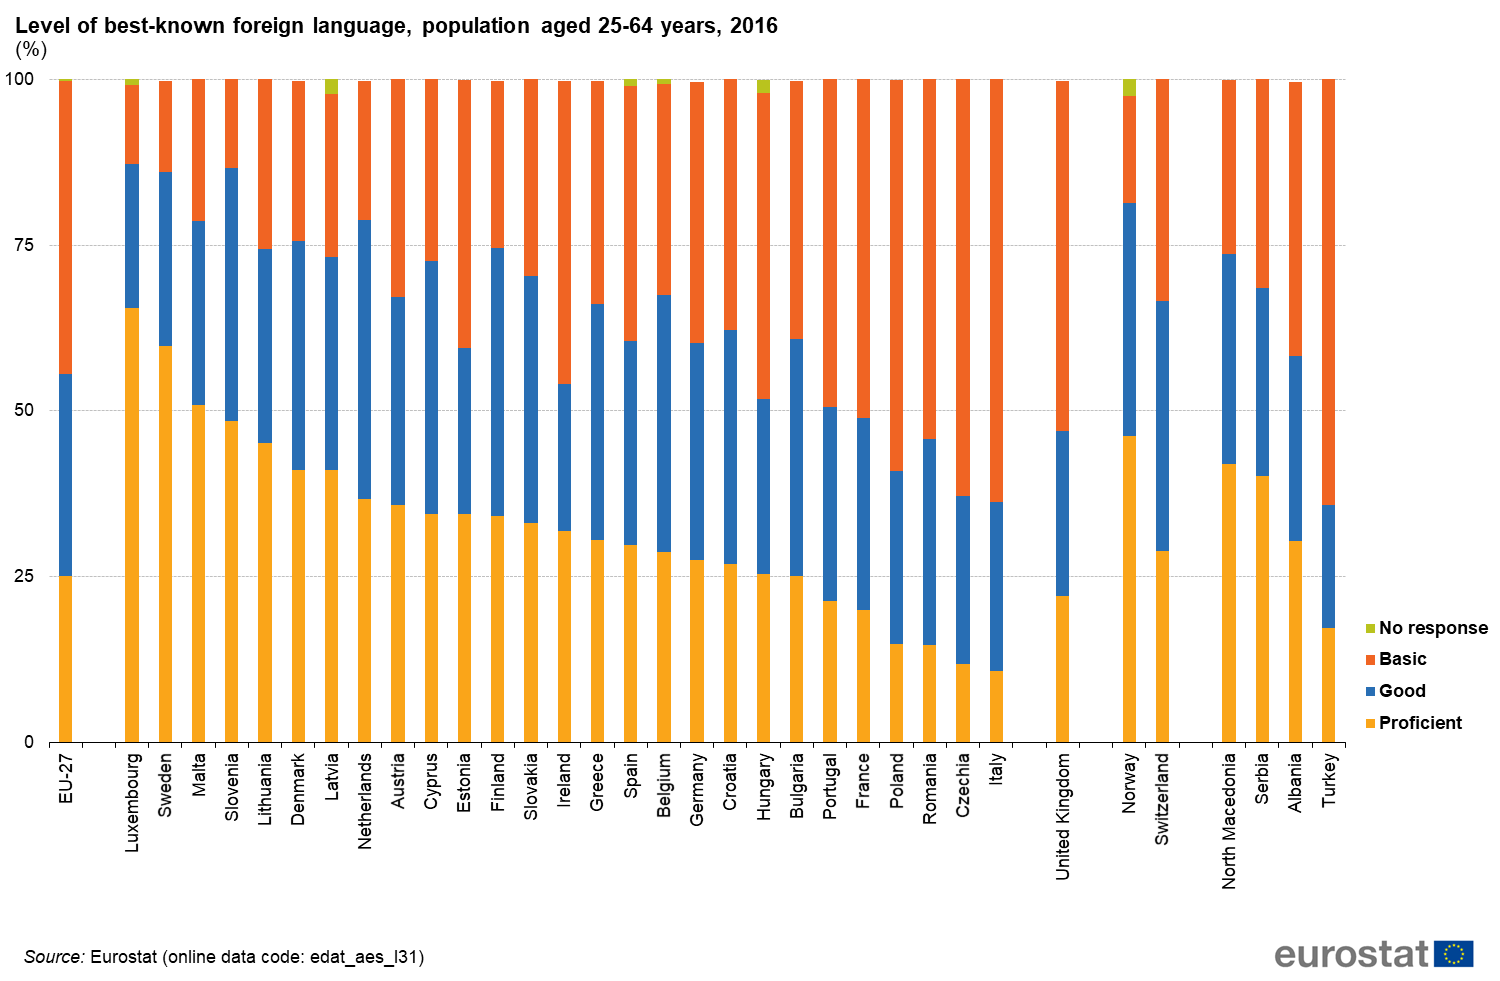
Figure6 Level of best-known foreign language population aged 25-64 years 2016 (%).png
(
file
)
179 KB
1
11:14, 17 July 2020
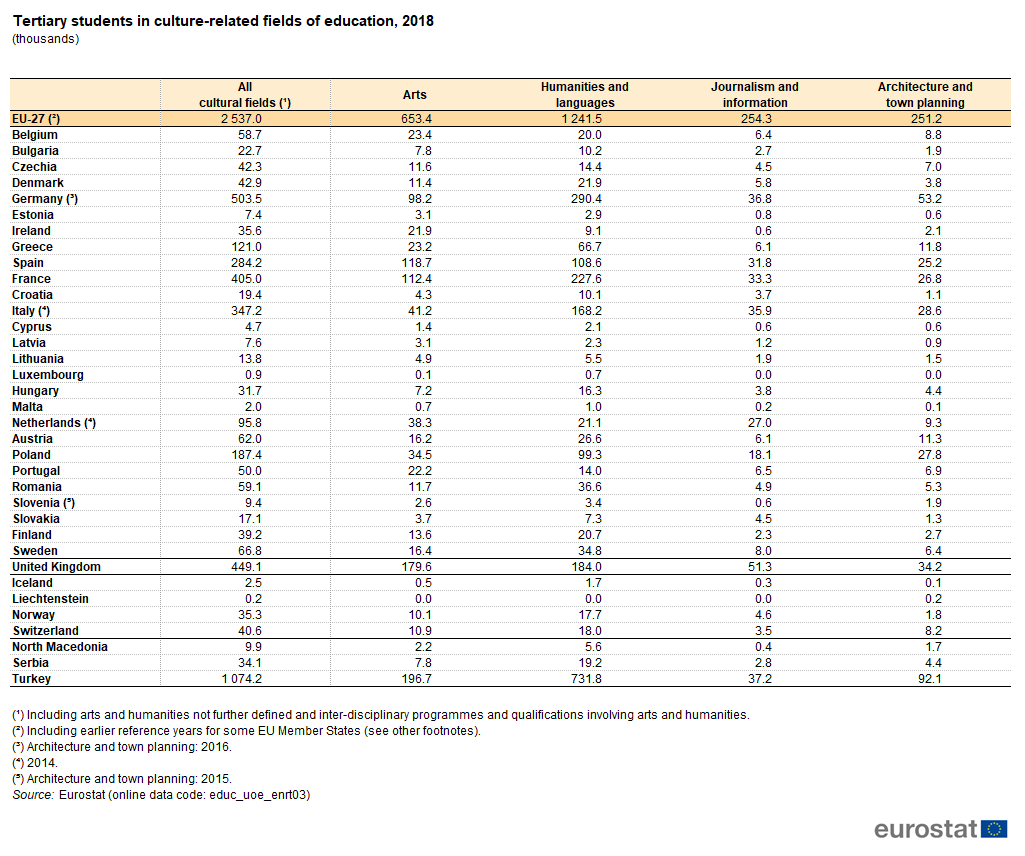
Table1 Tertiary students in culture-related fields of education 2018 (thousands).png
(
file
)
75 KB
1
11:14, 17 July 2020
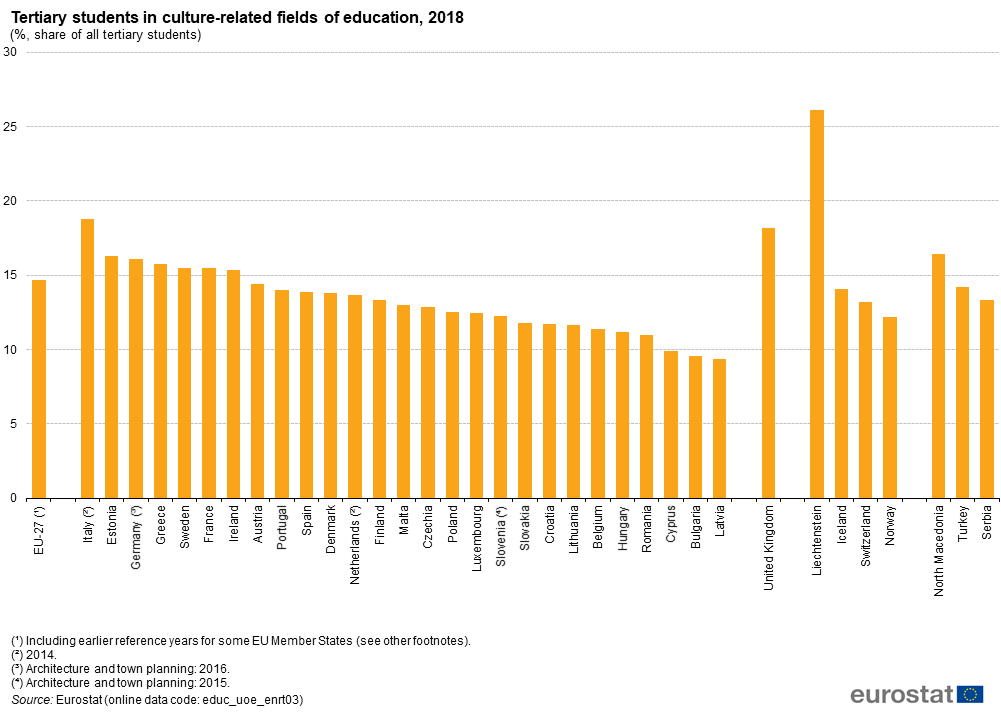
Figure1 Tertiary students in culture-related fields of education 2018 (% share of all tertiary students).png
(
file
)
74 KB
1
11:14, 17 July 2020
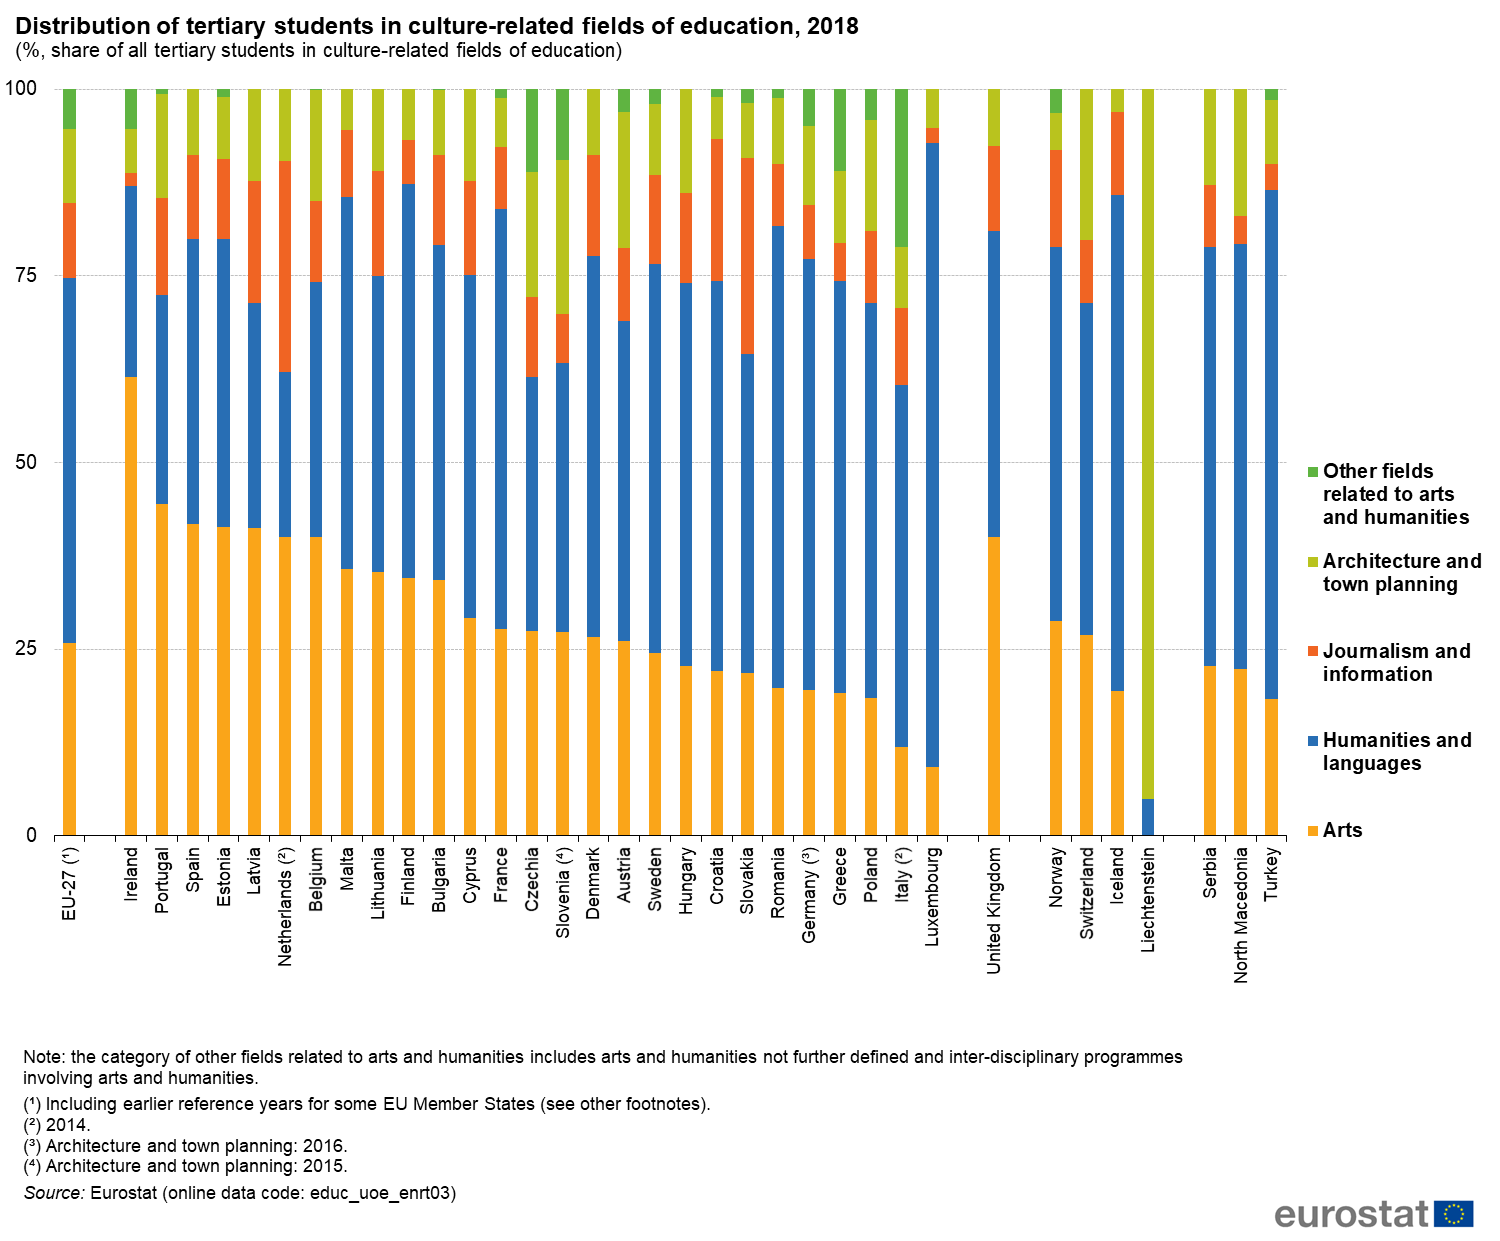
Figure2 Distribution of tertiary students in culture-related fields of education 2018.png
(
file
)
231 KB
1
11:14, 17 July 2020
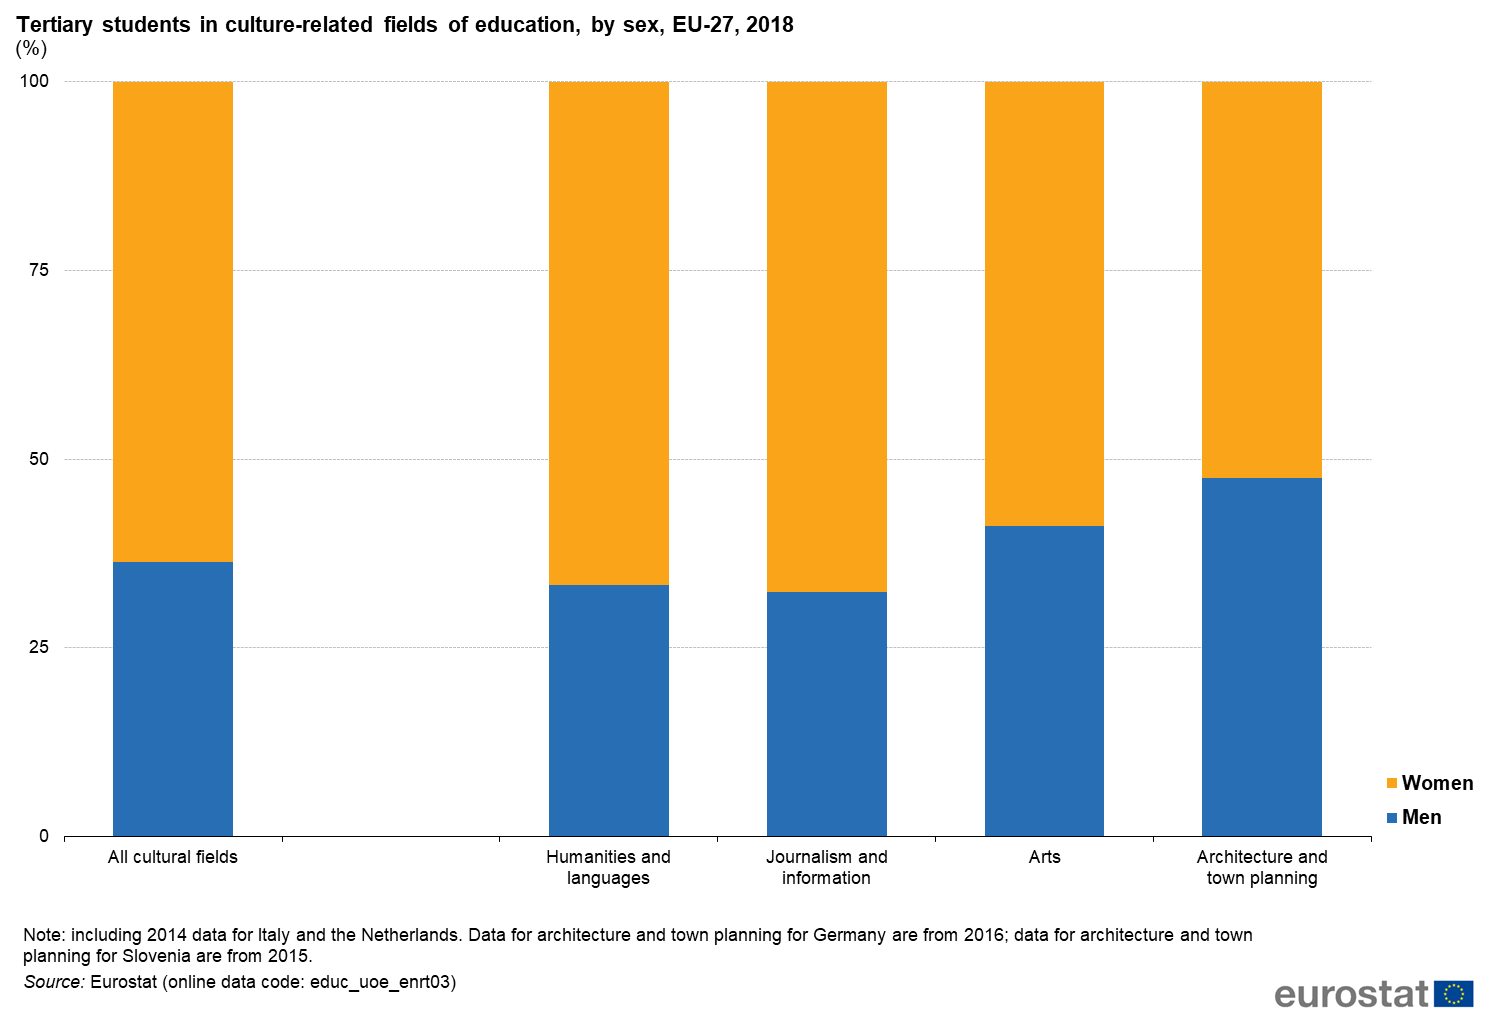
Figure3 Tertiary students in culture-related fields of education by sex EU-27 2018 (%).png
(
file
)
79 KB
1
19:11, 23 July 2020
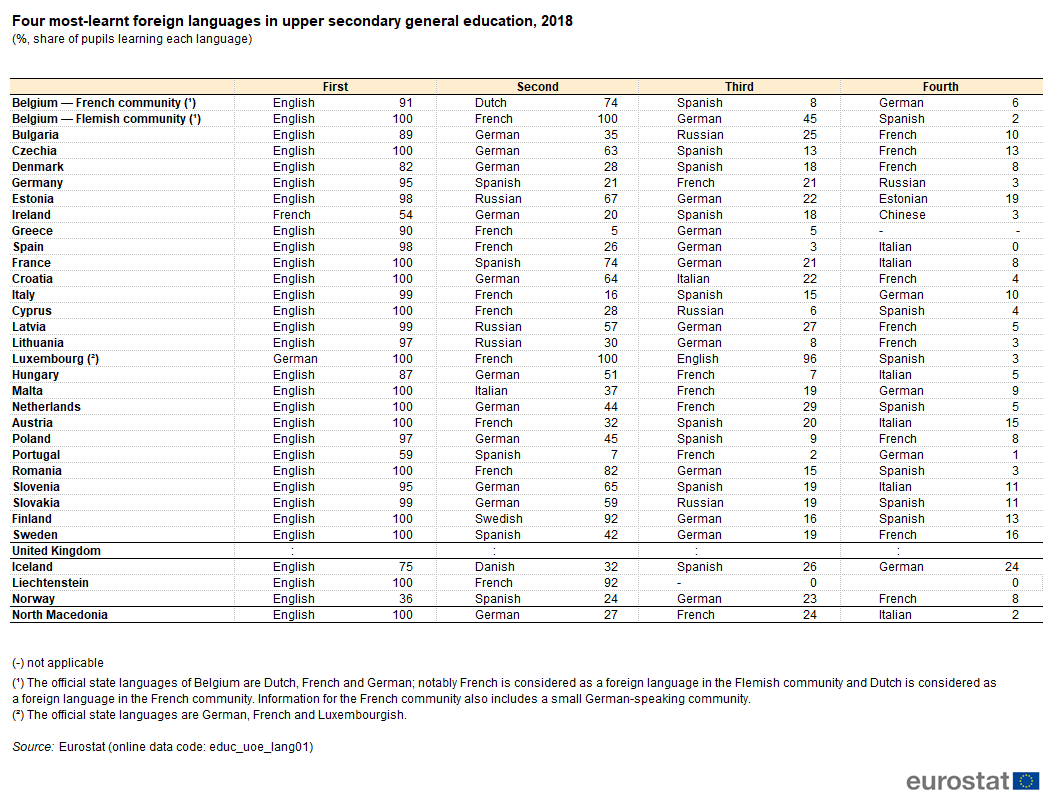
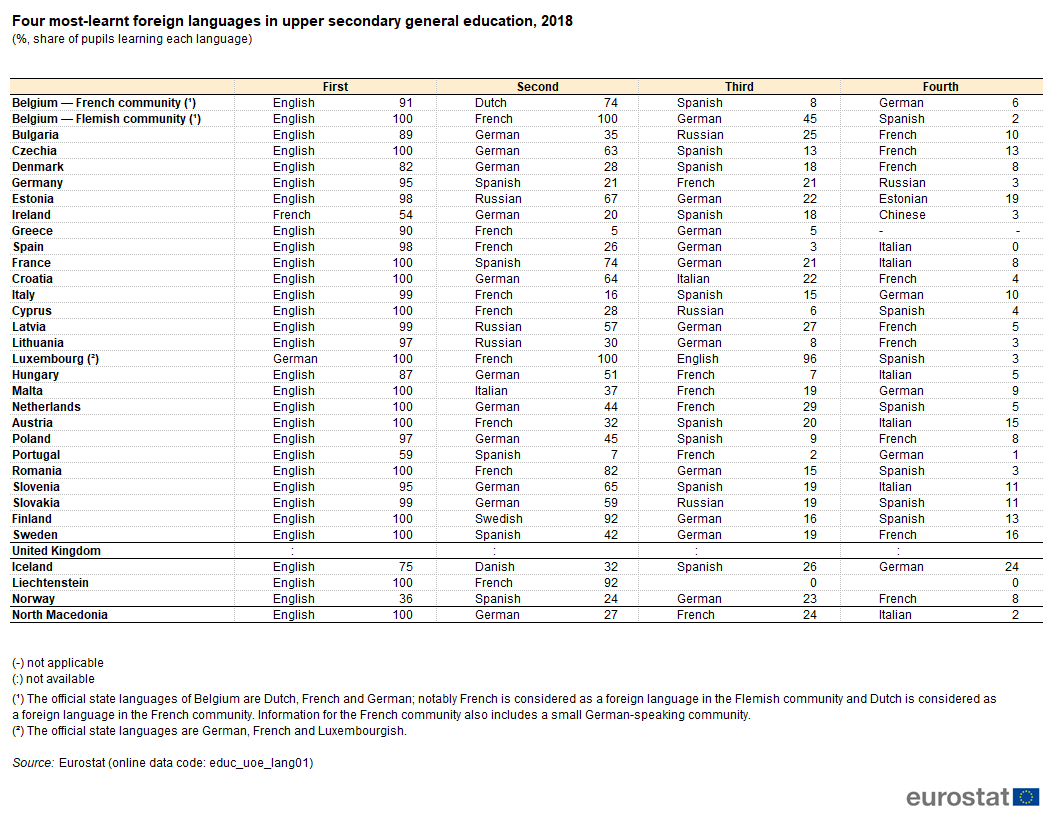
Table2 Four most-learnt foreign languages in upper secondary general education 2018 upt.png
(
file
)
89 KB
1
19:11, 23 July 2020
Table3 Degree mobile students from abroad by level of tertiary education and by country of origin upt.png
(
file
)
70 KB
1
19:11, 23 July 2020
Culture-related education CP2020 update.xlsx
(
file
)
113 KB
1
09:02, 24 July 2020
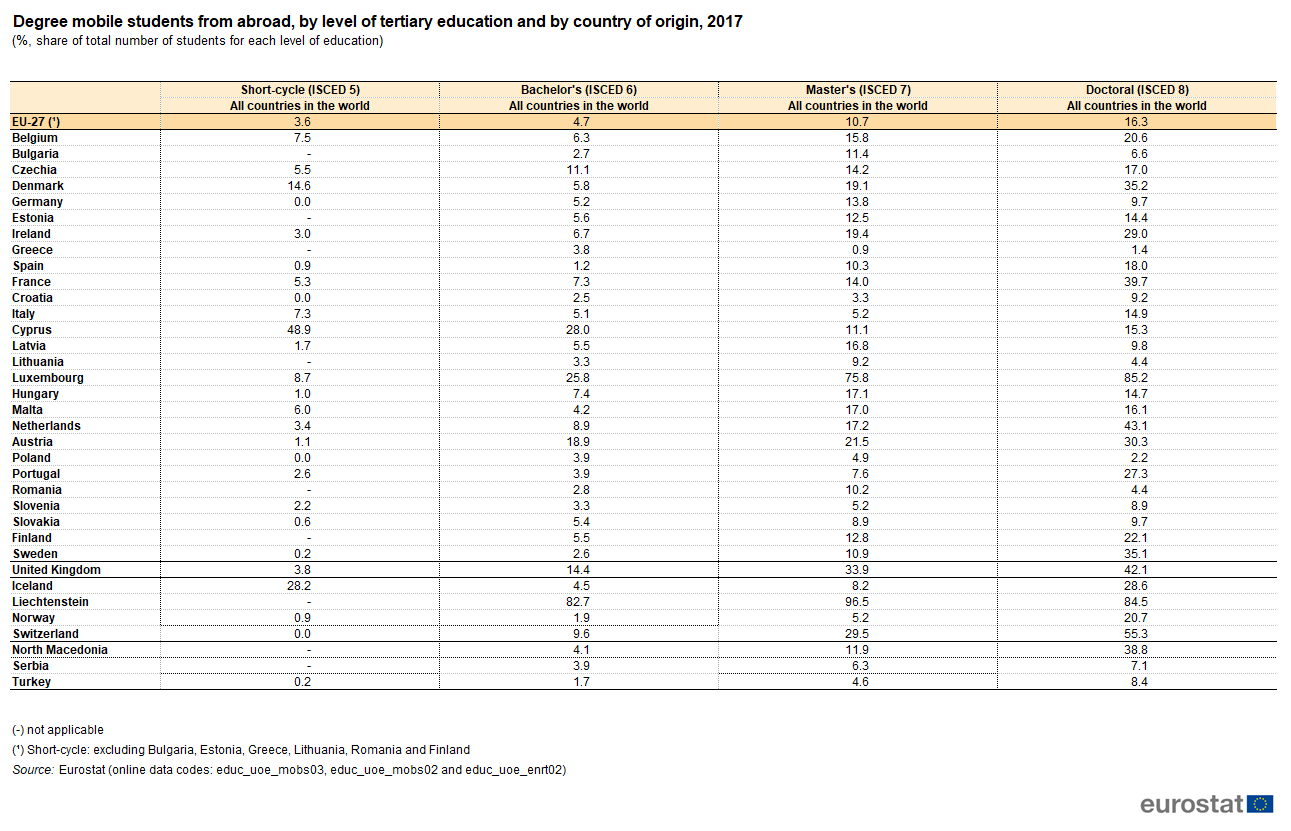
Table3 Degree mobile students from abroad by level of tertiary education and by country of origin.png
(
file
)
70 KB
4
11:18, 24 July 2020
Table2 Four most-learnt foreign languages in upper secondary general education 2018.png
(
file
)
89 KB
4
11:19, 24 July 2020
Culture-related education CP2020.xlsx
(
file
)
115 KB
5
13:02, 10 August 2020
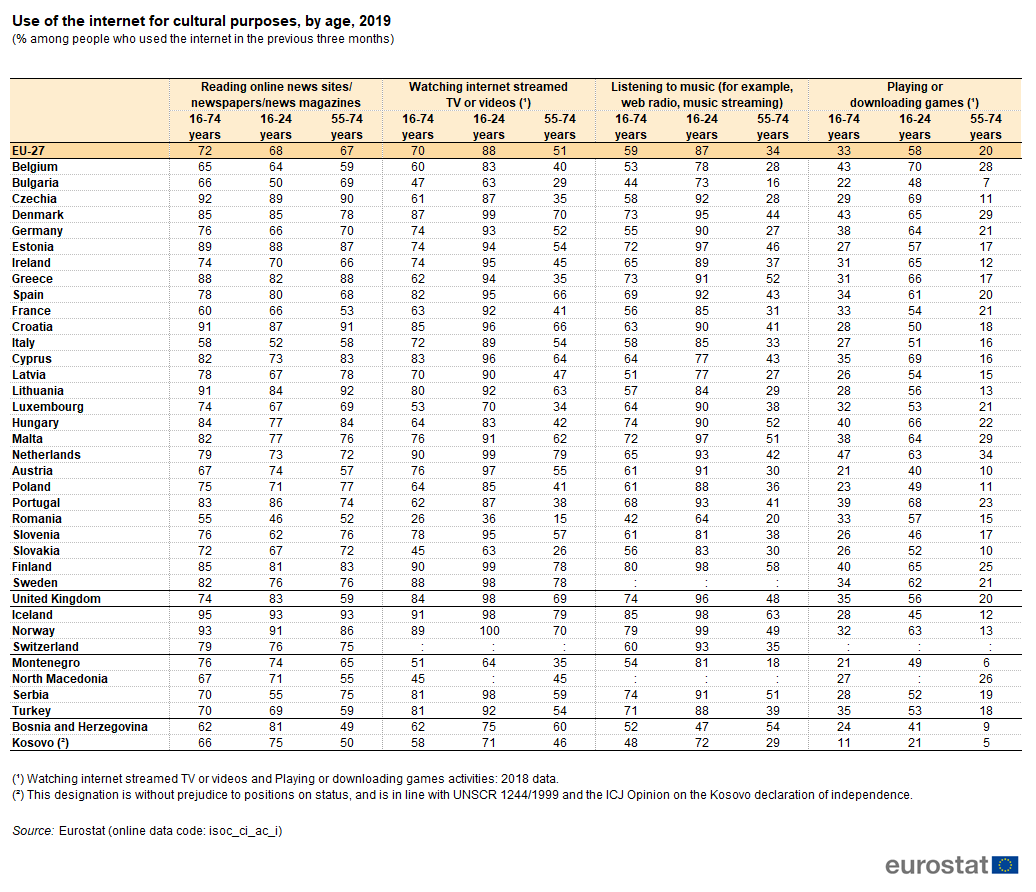
Table1 Use of the internet for cultural purposes by age 2019.png
(
file
)
102 KB
1
13:02, 10 August 2020
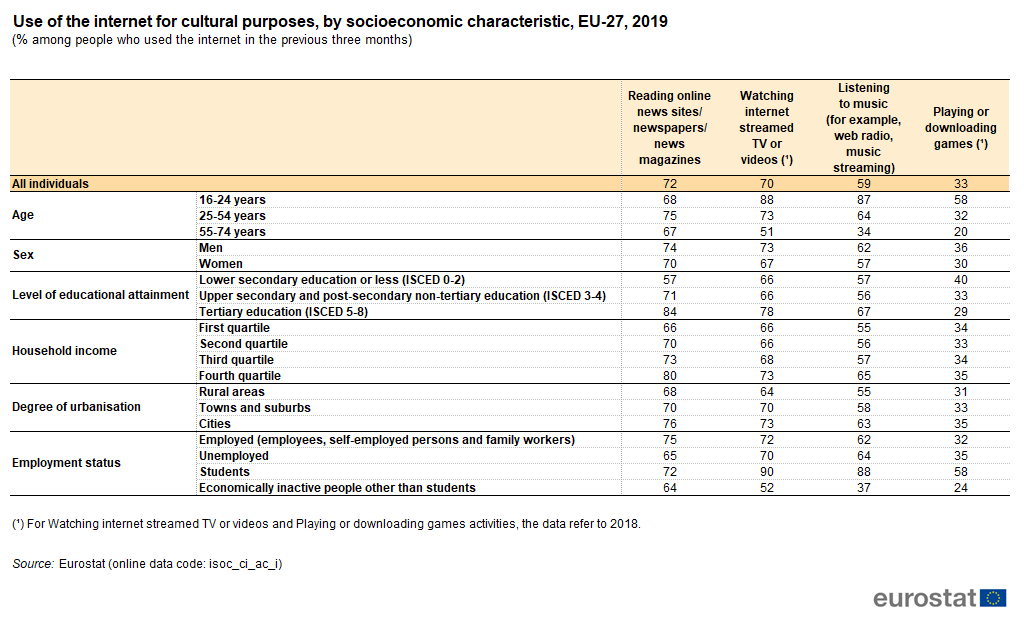
Table2 Use of the internet for cultural purposes by socioeconomic characteristic EU-27 2019.png
(
file
)
60 KB
1
13:02, 10 August 2020
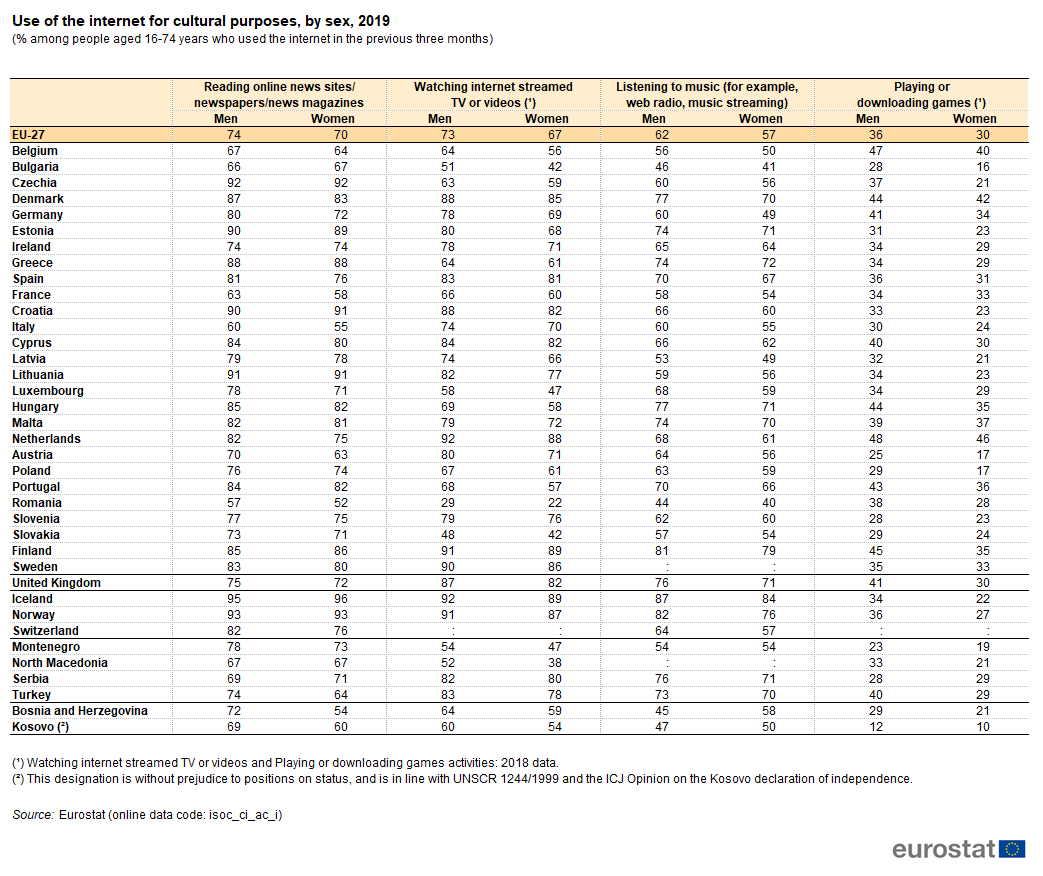
Table3 Use of the internet for cultural purposes by sex 2019.png
(
file
)
88 KB
1
13:02, 10 August 2020
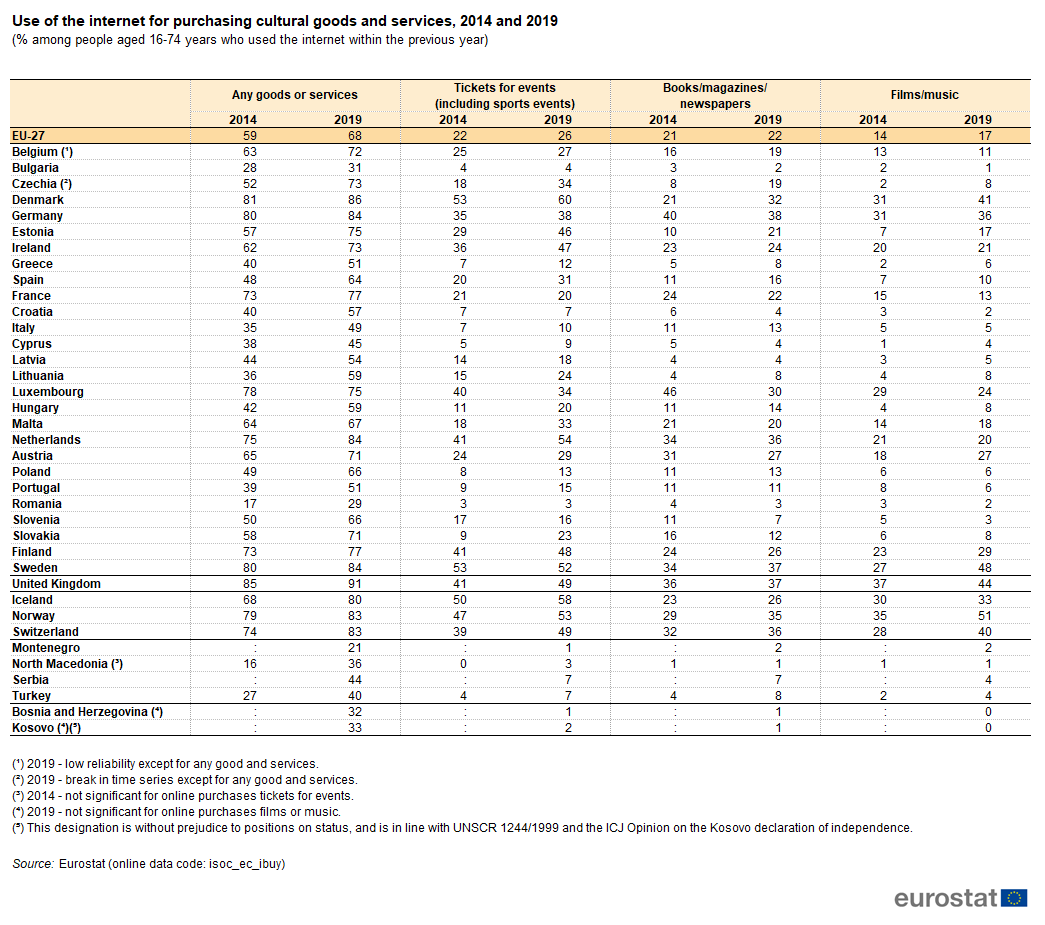
Table4 Use of the internet for purchasing cultural goods and services 2014 and 2019.png
(
file
)
84 KB
1
13:02, 10 August 2020
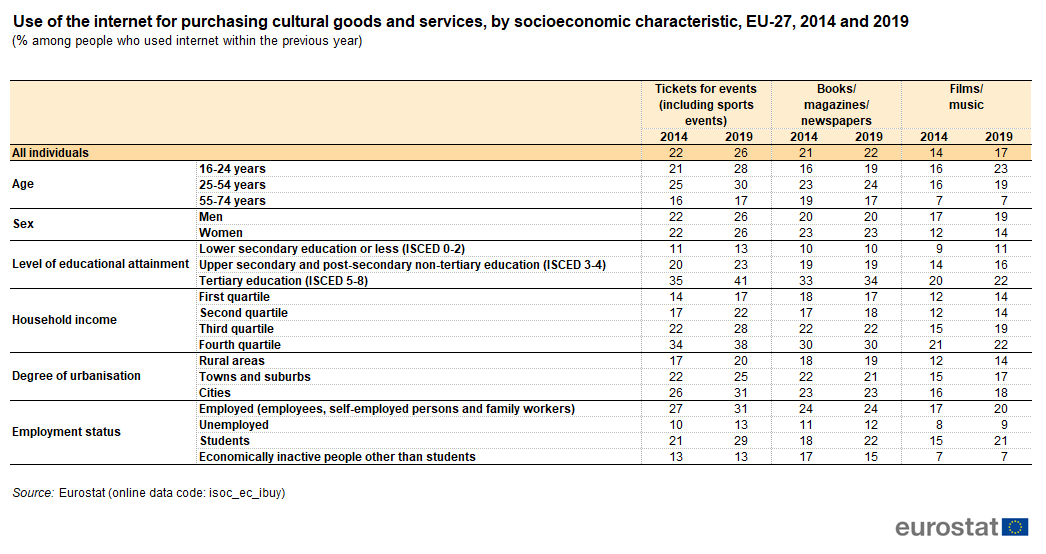
Table5 Use of the internet for purchasing cultural goods and services by socioeconomic characteristic EU-27 2014 and 2019.png
(
file
)
60 KB
1
13:02, 10 August 2020
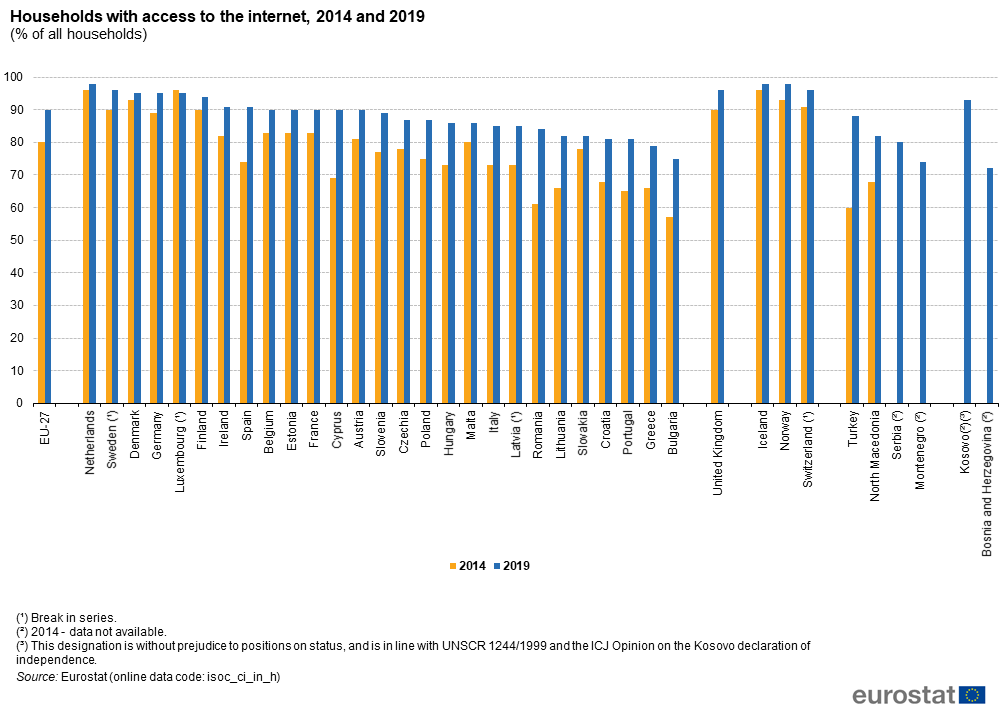
Figure1 Households with access to the internet 2014 and 2019 (% of all households).png
(
file
)
94 KB
1
13:02, 10 August 2020
Figure3 Use of the internet for cultural purposes by level of educational attainment 2019.png
(
file
)
171 KB
1
13:02, 10 August 2020
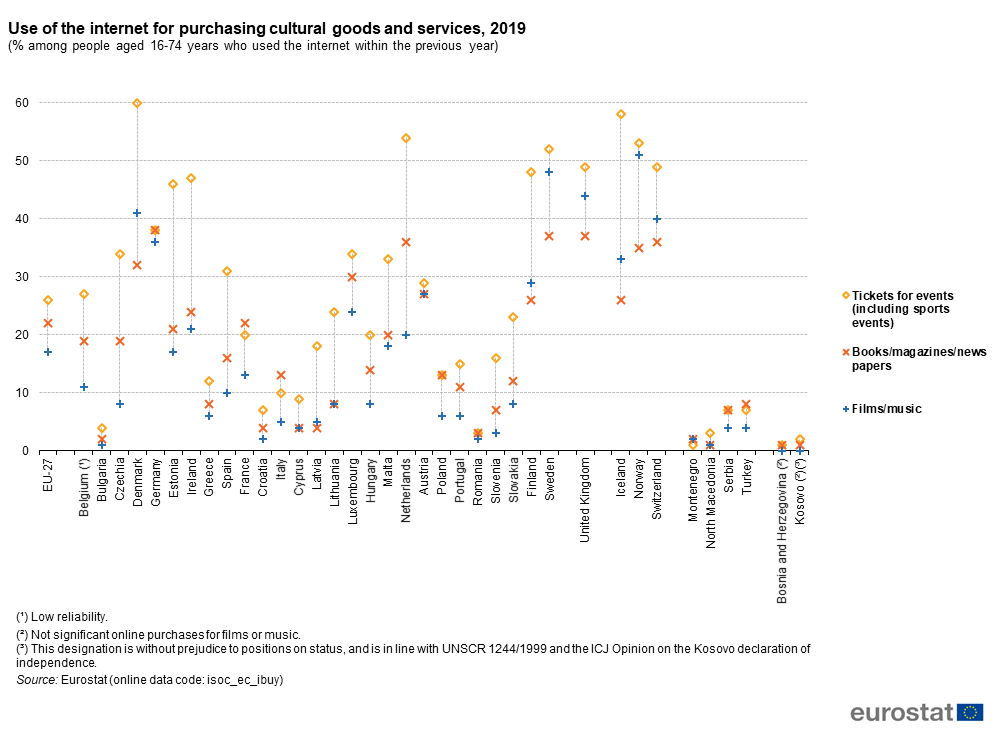
Figure4 Use of the internet for purchasing cultural goods and services 2019.png
(
file
)
69 KB
1
11:06, 13 August 2020
Figure2 Use of the internet for selected cultural activities during the previous three months 2019.png
(
file
)
88 KB
correction of graphic representation for Italy and Bosnia and Herzegovina according to the same pattern as for Ireland and UK.
6
11:15, 13 August 2020
Use of ICT in cultural participation CP2020.xlsx
(
file
)
2.13 MB
Improving the graphic representation of selected elements of the figure 2
5
First page
Previous page
Next page
Last page
Special page
ISSN 2443-8219
.png)


.png)


.png)
.png)

.png)
.png)
.png)
.png)
.png)
.png)
.png)
.png)
.png)
.png)
.png)

.png)


.png)


