Tutorials
Log in
Statistics Explained
menu
search
search
Navigation
Main page
Statistical themes
Glossary
Categories
Statistics 4 beginners
Tutorials
Help
Eurostat home
Education corner
Online publications
Regional yearbook
Sustainable development
Full list
Tools
User contributions
Logs
View user groups
Special pages
search
Navigation
Main page
Statistical themes
Glossary
Categories
Statistics 4 beginners
Tutorials
Help
Eurostat home
Education corner
Online publications
Regional yearbook
Sustainable development
Full list
Tools
User contributions
Logs
View user groups
Special pages
Navigation
Main page
Statistical themes
Glossary
Categories
Statistics 4 beginners
Tutorials
Help
Eurostat home
Education corner
Online publications
Regional yearbook
Sustainable development
Full list
Tools
User contributions
Logs
View user groups
Special pages
Uploads by Bacheda
This special page shows all uploaded files.
File list
Items per page:
20
50
100
250
500
Search for media name:
Username:
Include old versions of files
Go
Date
Name
Thumbnail
Size
Description
Versions
13:45, 27 November 2019
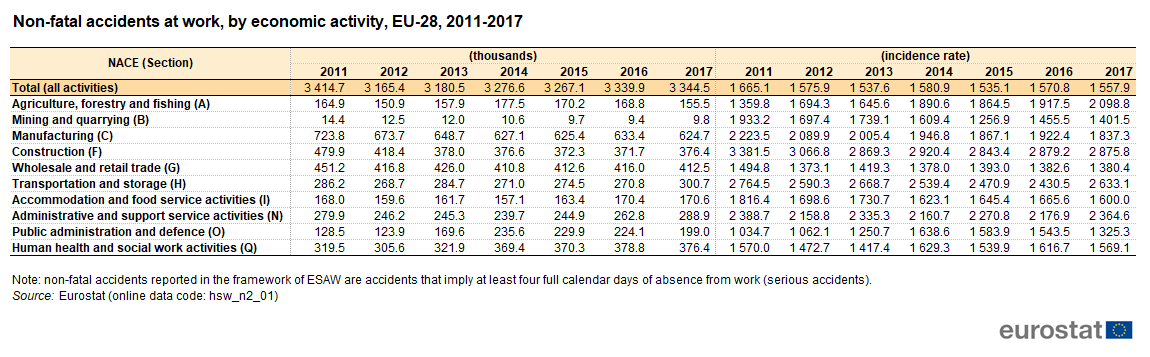
Non-fatal accidents at work, by economic activity, EU-28, 2011-2017.png
(
file
)
62 KB
1
15:05, 27 November 2019
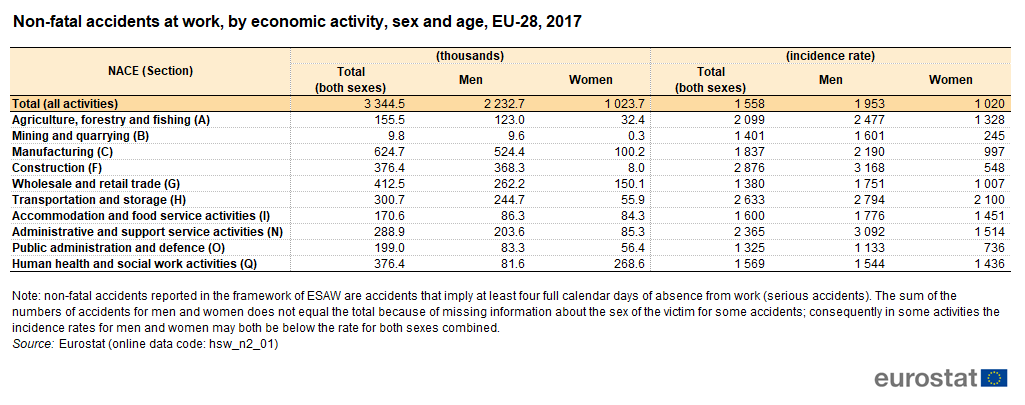
Non-fatal accidents at work, by economic activity, sex and age, EU-28, 2017.png
(
file
)
54 KB
1
15:10, 27 November 2019
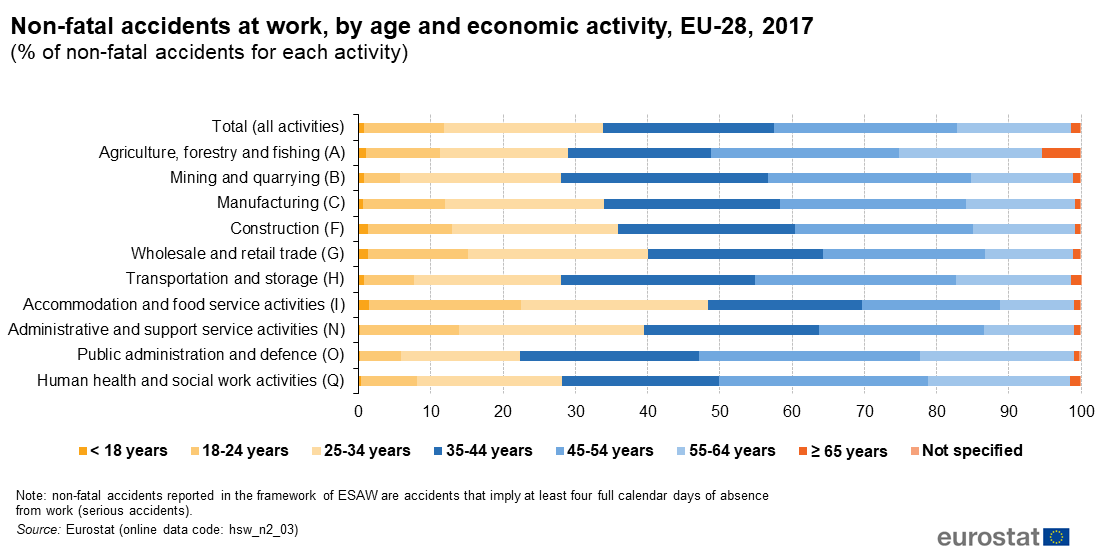
Non-fatal accidents at work, by age and economic activity, EU-28, 2017 (% of non-fatal accidents for each activity).png
(
file
)
60 KB
1
15:19, 27 November 2019
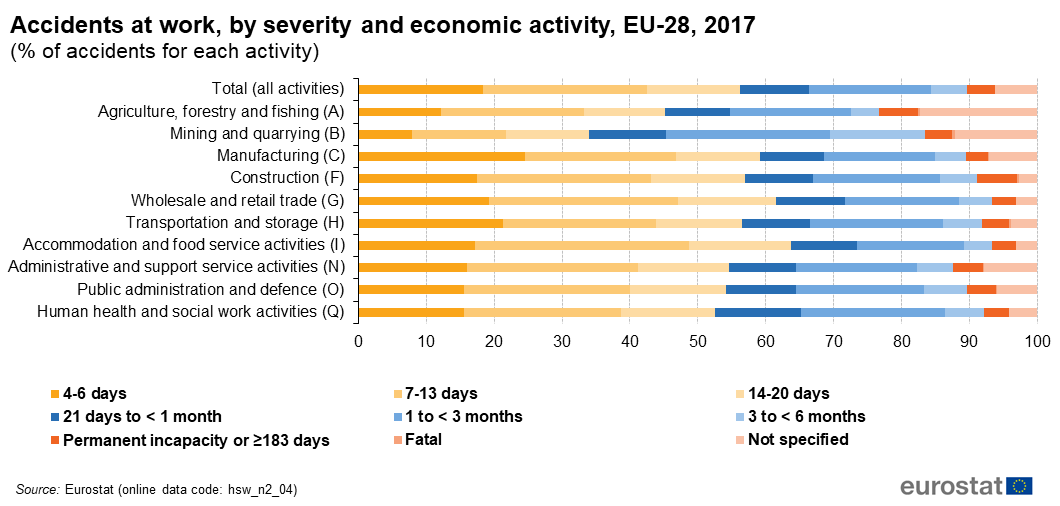
Accidents at work, by severity and economic activity, EU-28, 2017 (% of accidents for each activity).png
(
file
)
56 KB
4
15:26, 27 November 2019
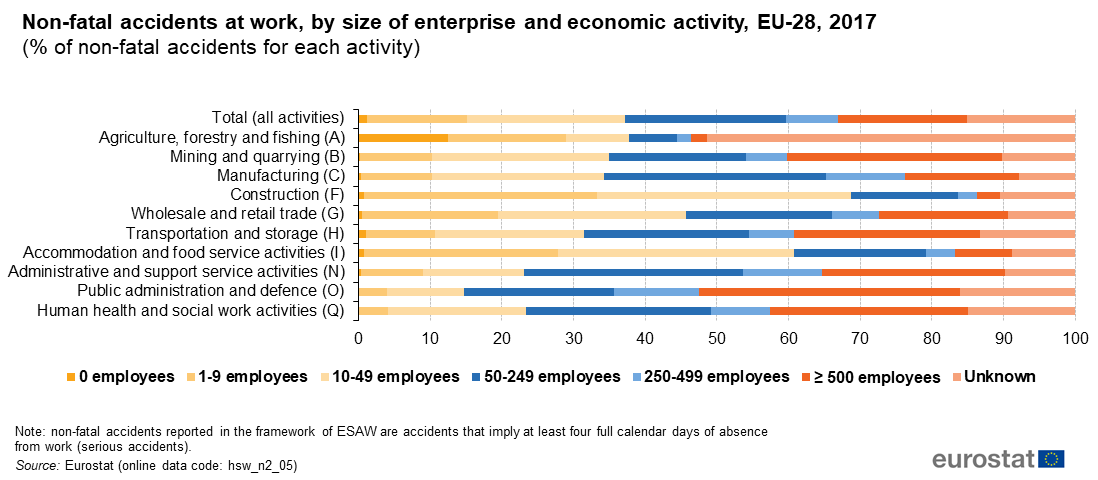
Non-fatal accidents at work, by size of enterprise and economic activity, EU-28, 2017 (% of non-fatal accidents for each activity).png
(
file
)
57 KB
1
15:29, 27 November 2019
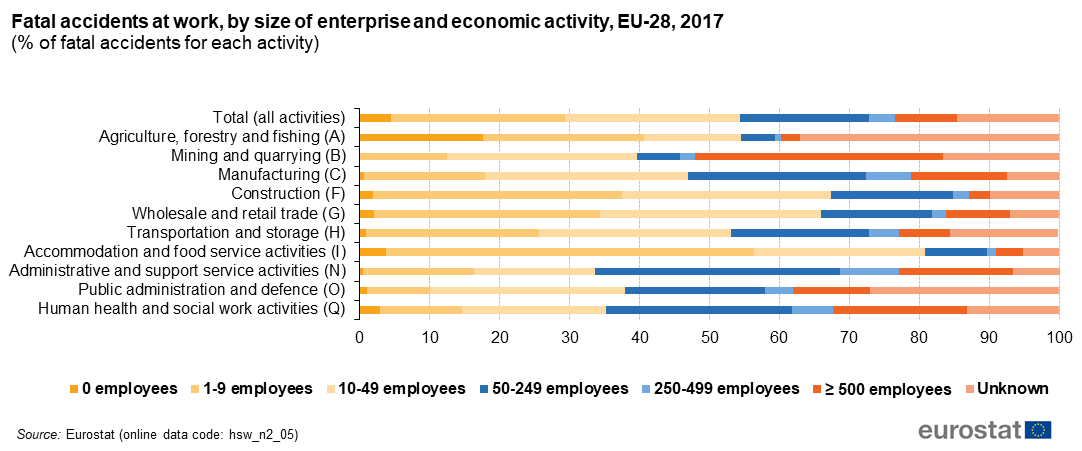
Fatal accidents at work, by size of enterprise and economic activity, EU-28, 2017 (% of fatal accidents for each activity).png
(
file
)
51 KB
1
15:36, 27 November 2019
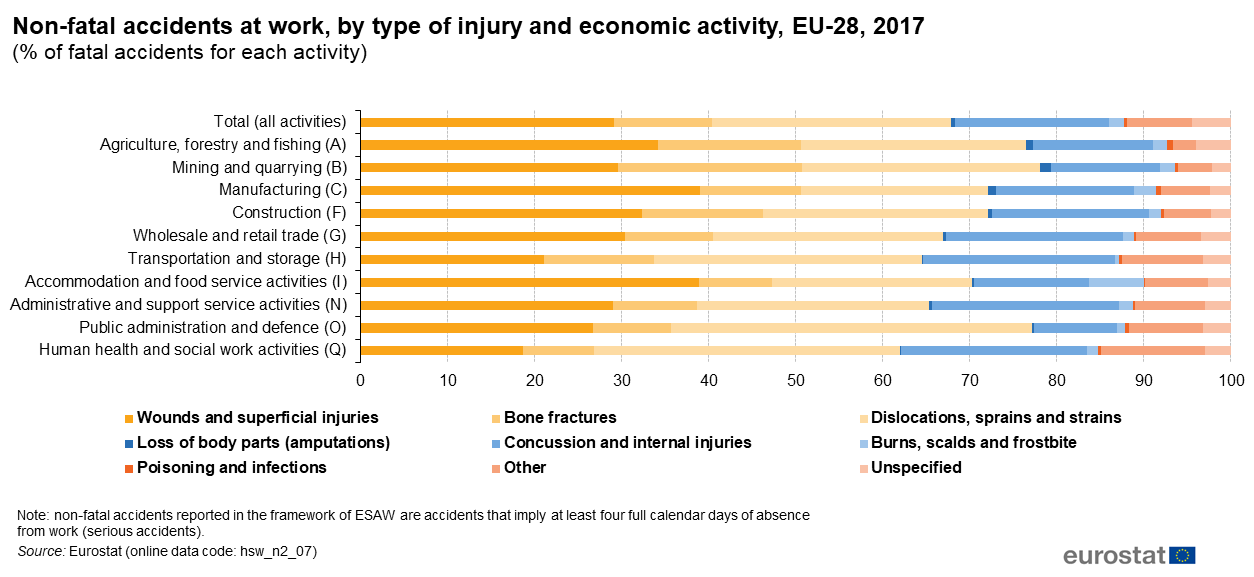
Non-fatal accidents at work, by type of injury and economic activity, EU-28, 2017 (% of fatal accidents for each activity).png
(
file
)
70 KB
1
15:39, 27 November 2019
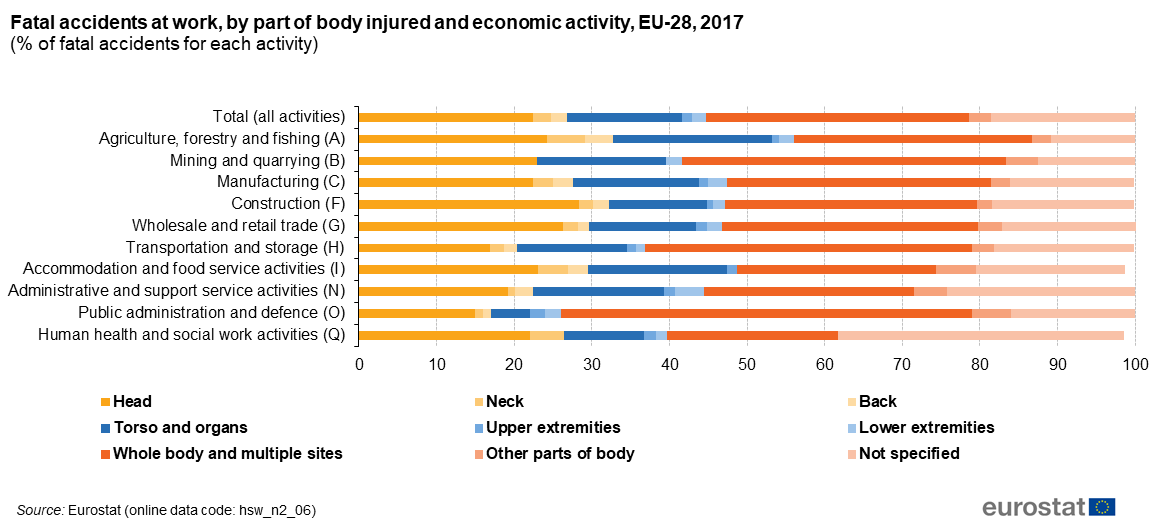
Fatal accidents at work, by part of body injured and economic activity, EU-28, 2017 (% of fatal accidents for each activity).png
(
file
)
57 KB
1
15:40, 27 November 2019
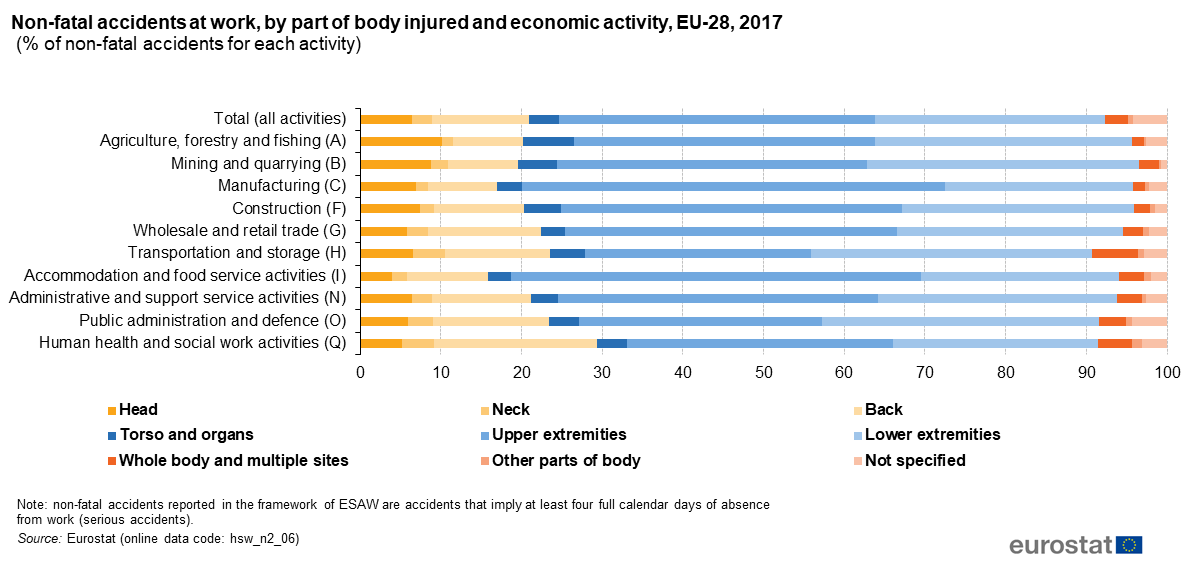
Non-fatal accidents at work, by part of body injured and economic activity, EU-28, 2017 (% of non-fatal accidents for each activity).png
(
file
)
64 KB
1
12:18, 28 November 2019
Accidents at work by activity nov2019.xlsx
(
file
)
147 KB
4
12:22, 28 November 2019
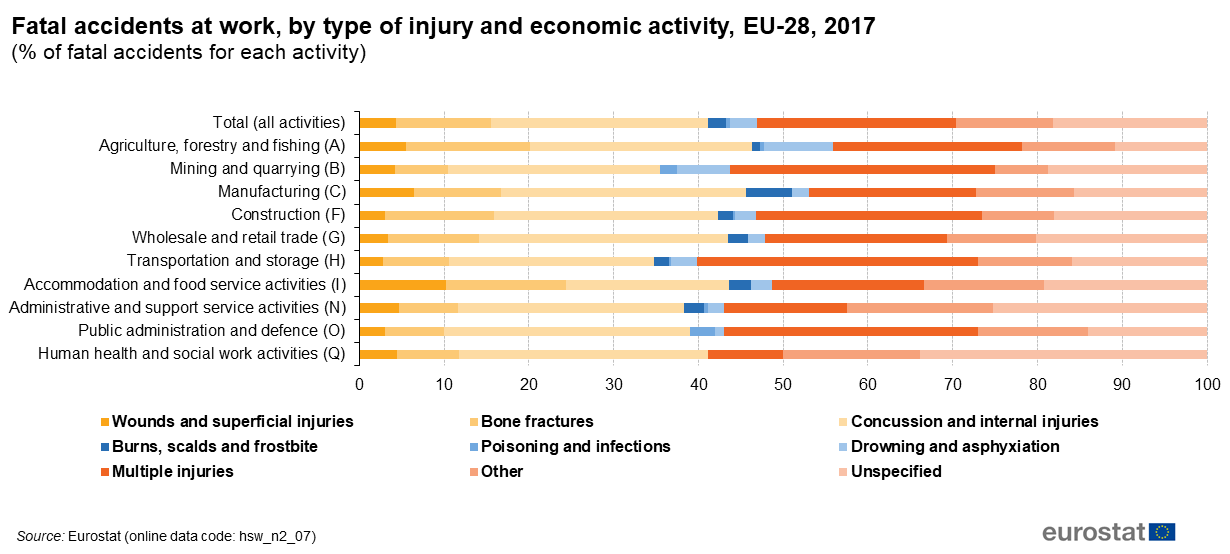
Fatal accidents at work, by type of injury and economic activity, EU-28, 2017 (% of fatal accidents for each activity).png
(
file
)
63 KB
4
12:27, 28 November 2019
Accidents at work by activity 2019.xlsx
(
file
)
147 KB
1
17:22, 9 December 2019
Tables and Figures-2019.xlsx
(
file
)
171 KB
1
17:30, 9 December 2019
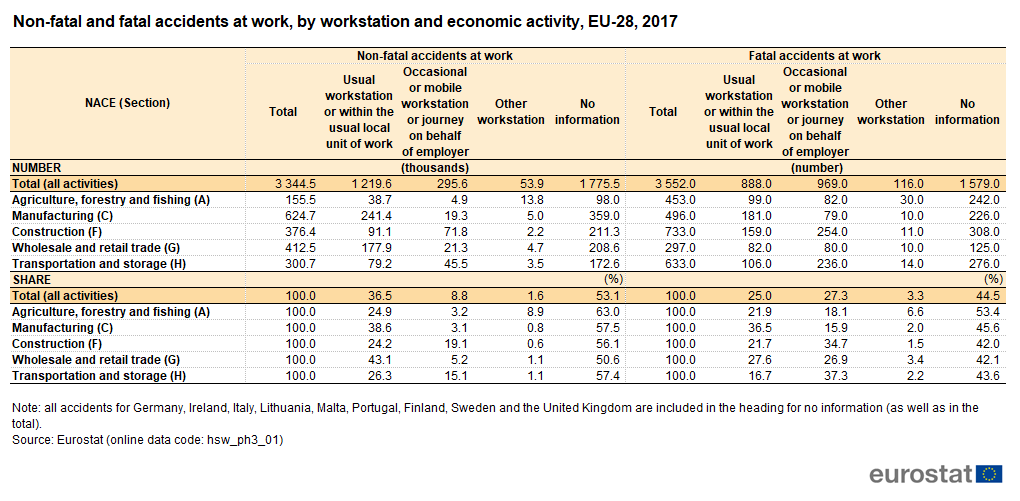
Non-fatal and fatal accidents at work, by workstation and economic activity, EU-28, 2017.png
(
file
)
61 KB
3
17:37, 9 December 2019
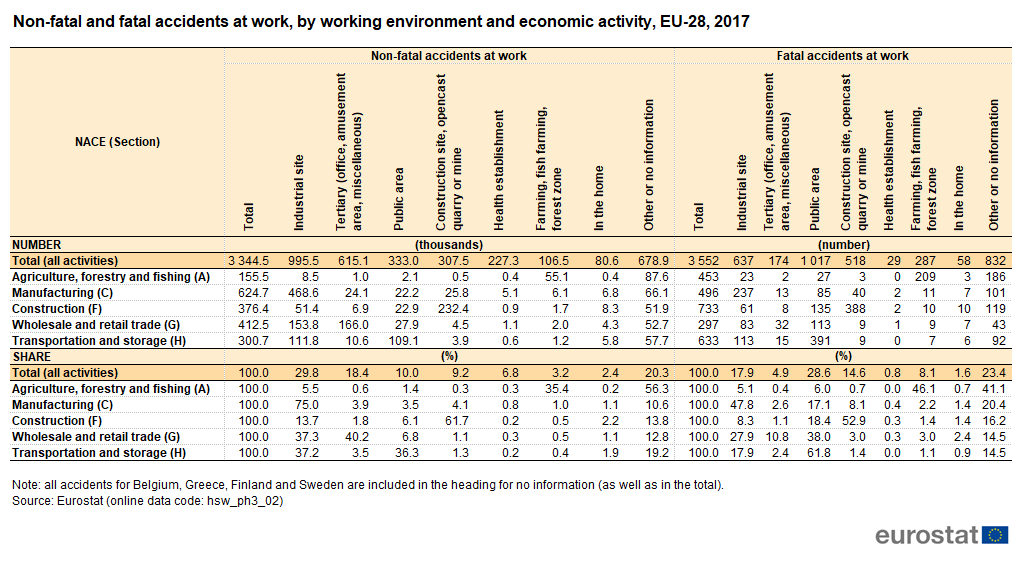
Non-fatal and fatal accidents at work, by working environment and economic activity, EU-28, 2017.png
(
file
)
84 KB
1
17:41, 9 December 2019
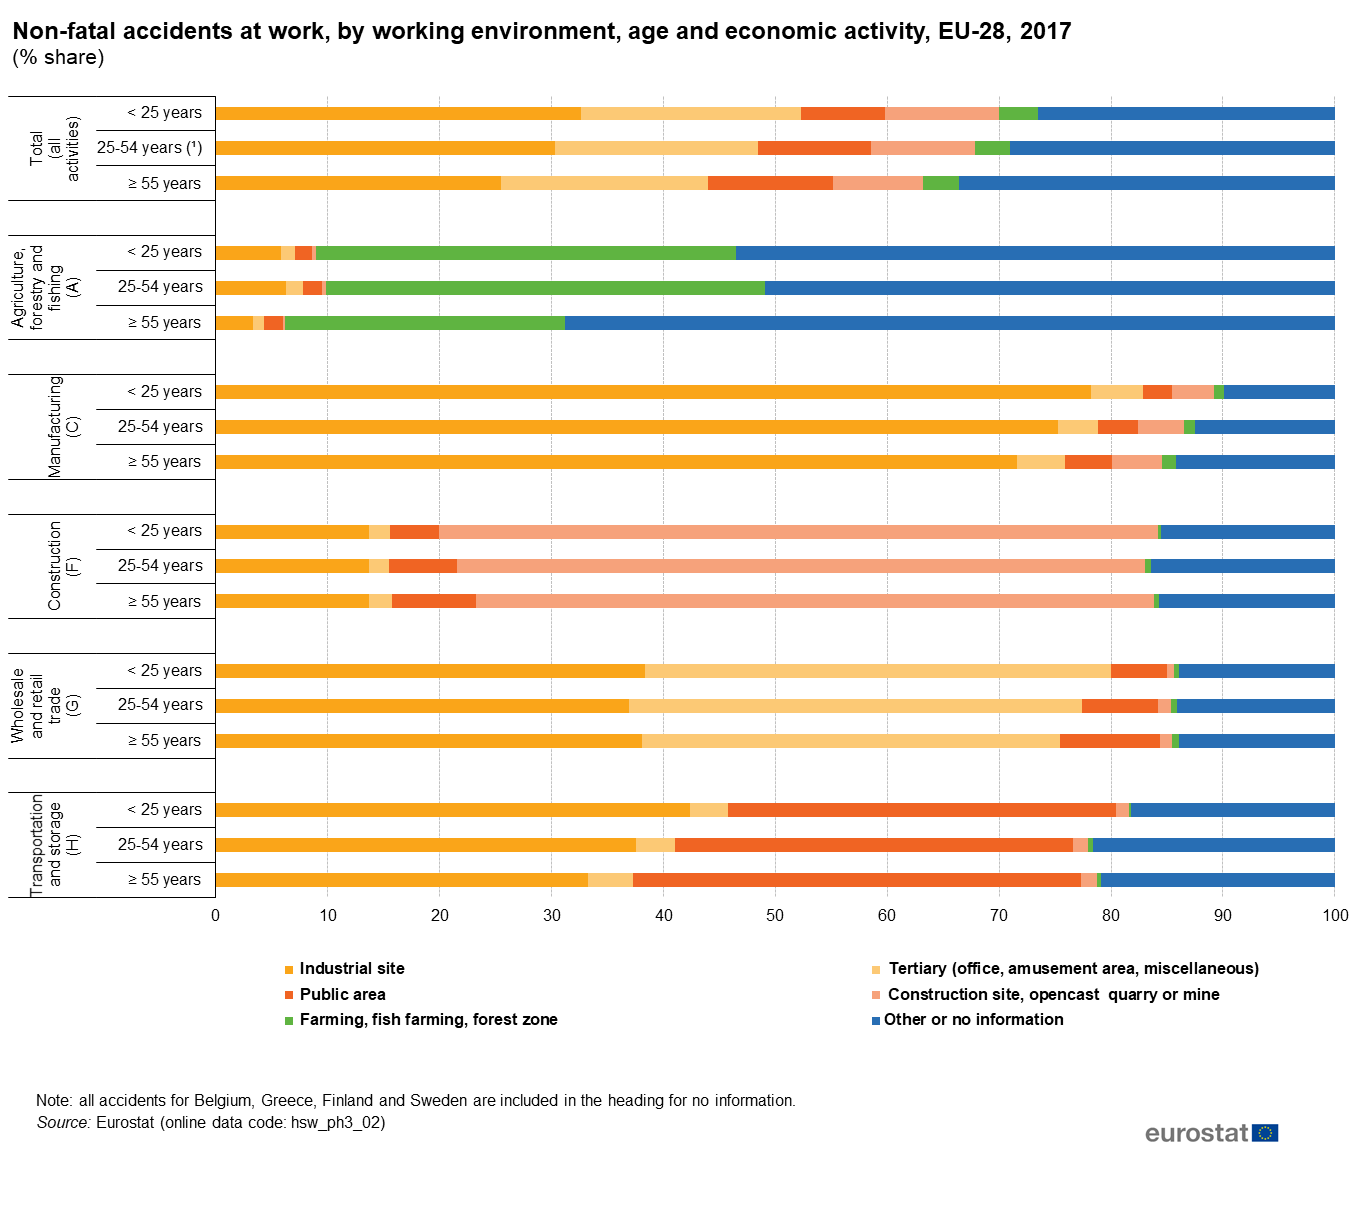
Non-fatal accidents at work, by working environment, age and economic activity, EU-28, 2017 (% share).png
(
file
)
94 KB
1
17:42, 9 December 2019
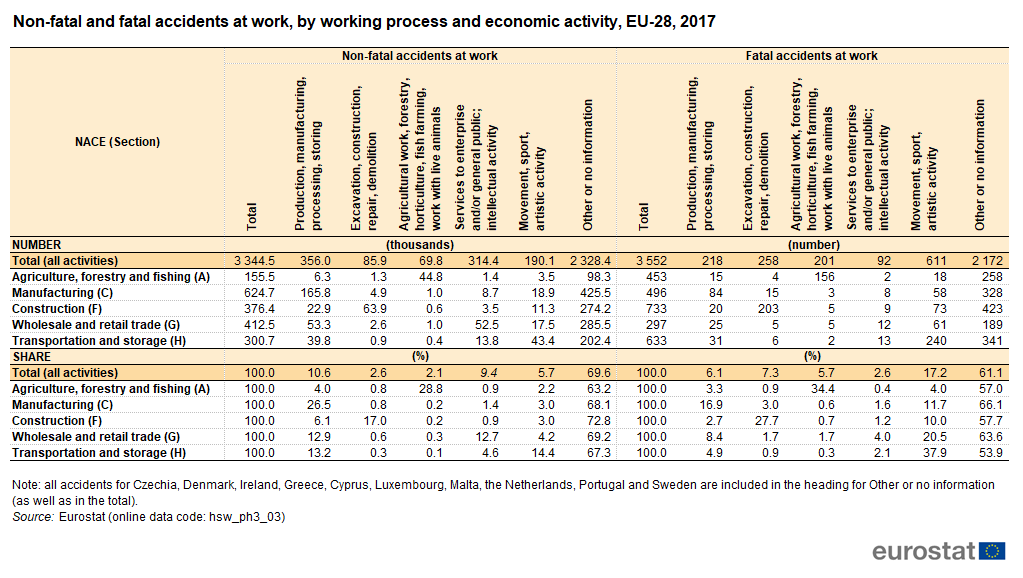
Non-fatal and fatal accidents at work, by working process and economic activity, EU-28, 2017.png
(
file
)
79 KB
1
17:44, 9 December 2019
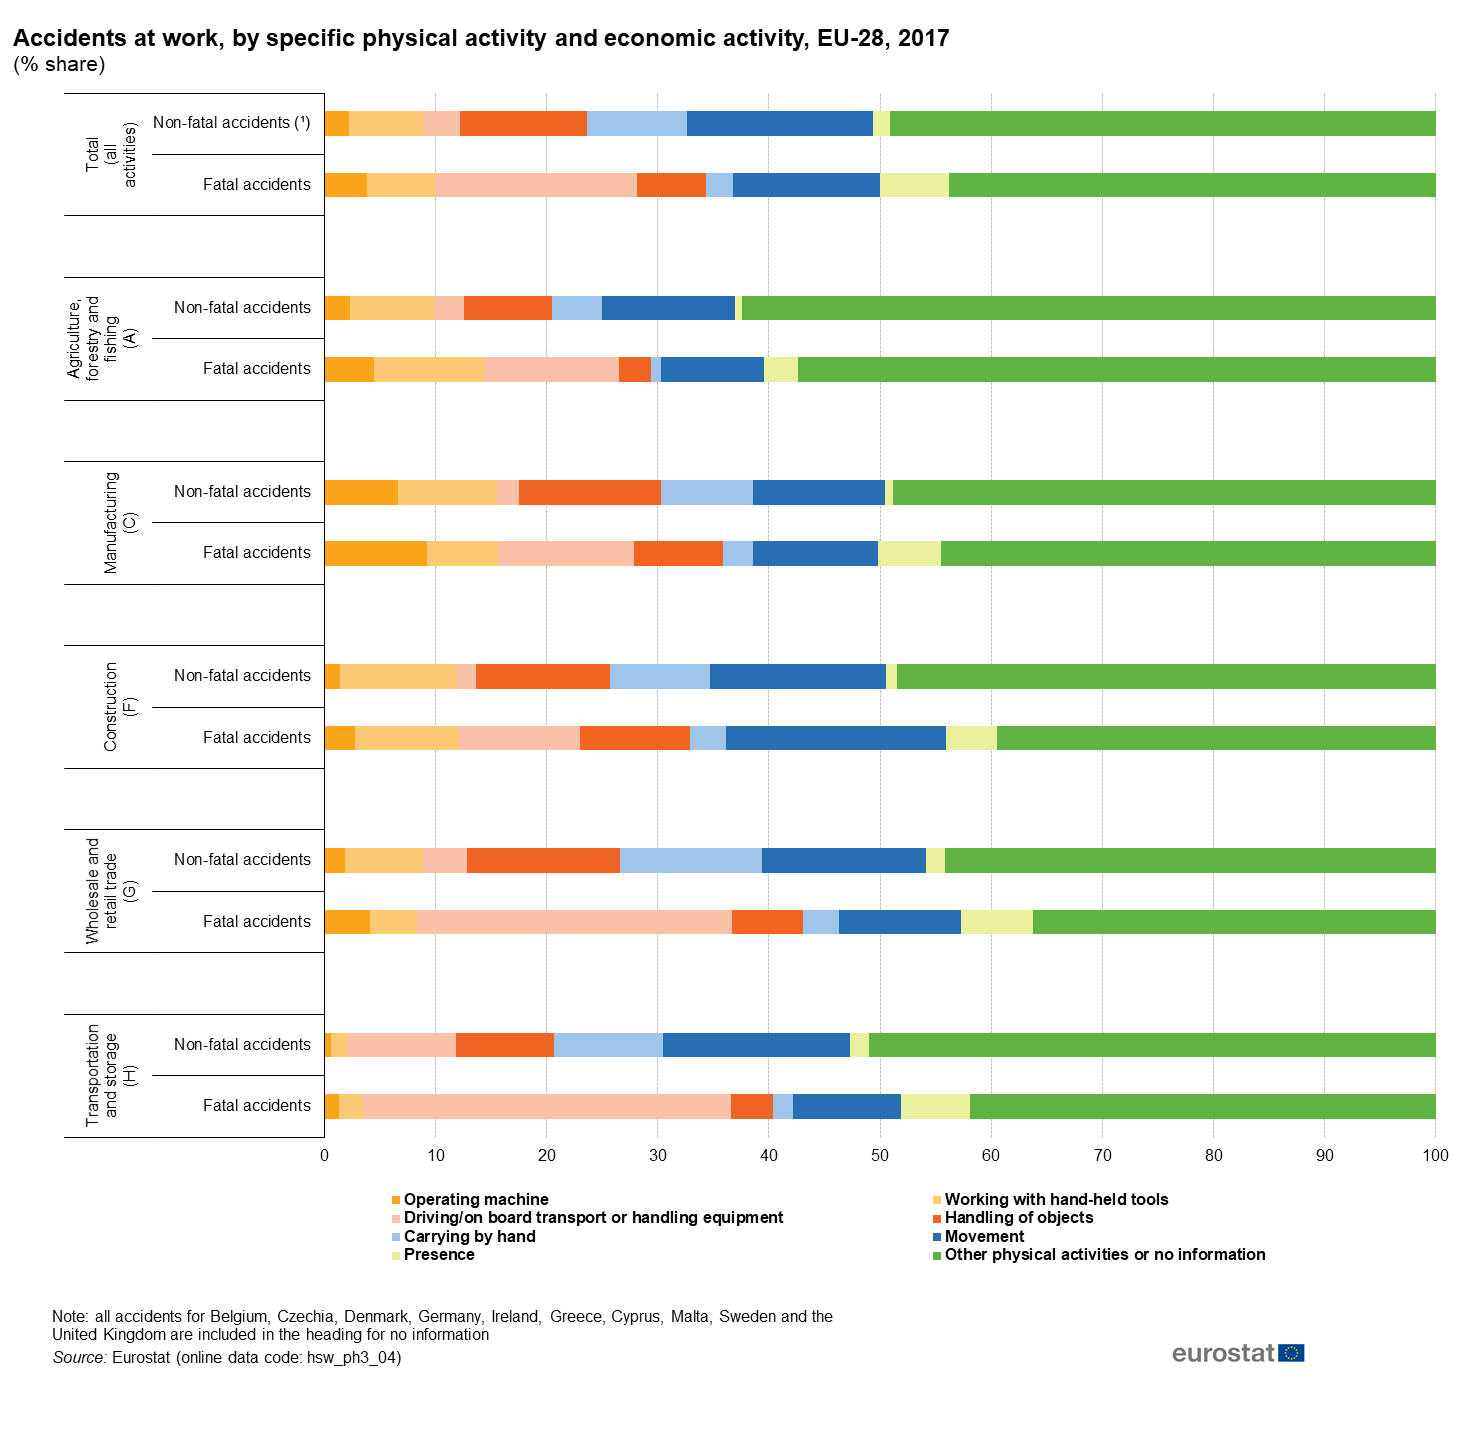
Accidents at work, by specific physical activity and economic activity, EU-28, 2017 (% share).png
(
file
)
117 KB
1
17:49, 9 December 2019
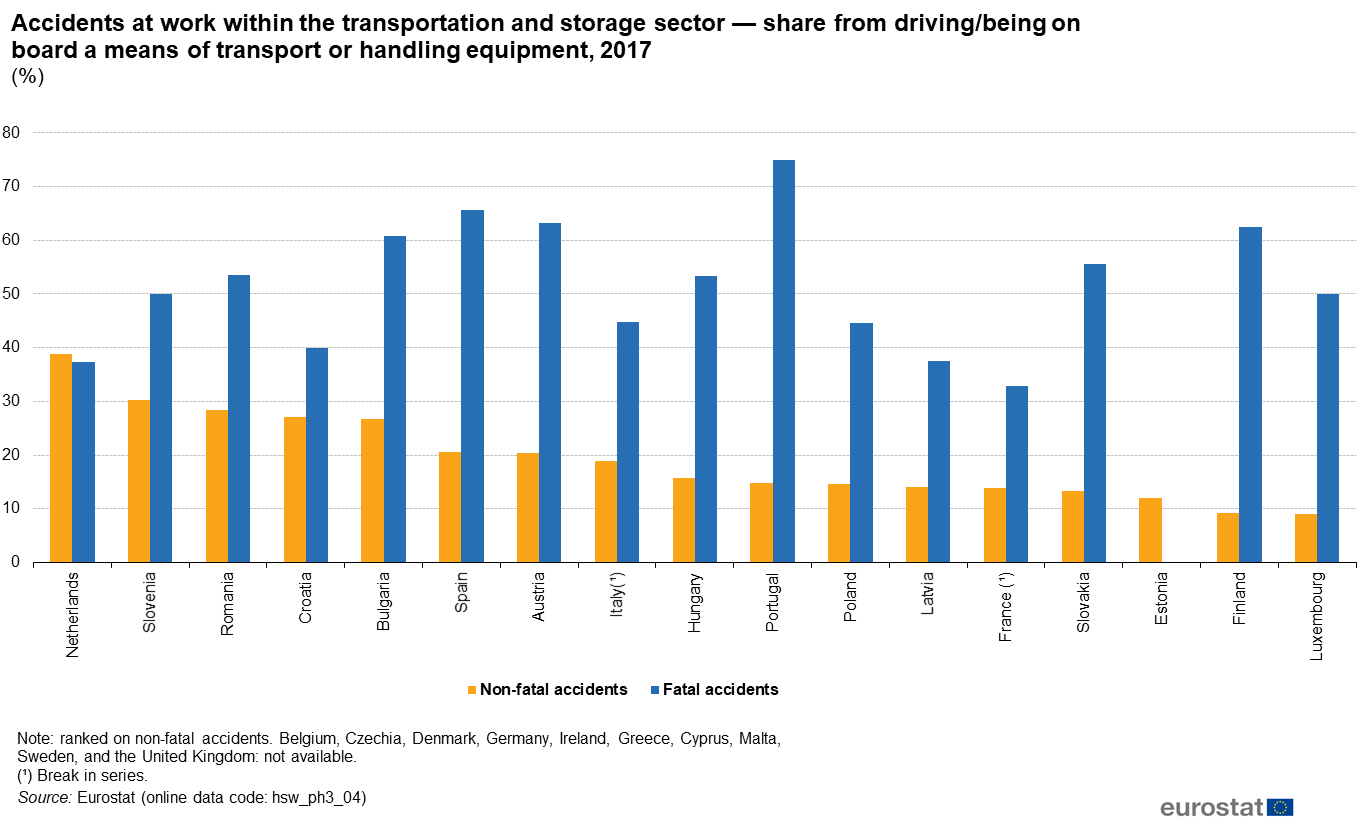
Accidents at work within the transportation and storage sector,2017(%).png
(
file
)
91 KB
1
17:51, 9 December 2019
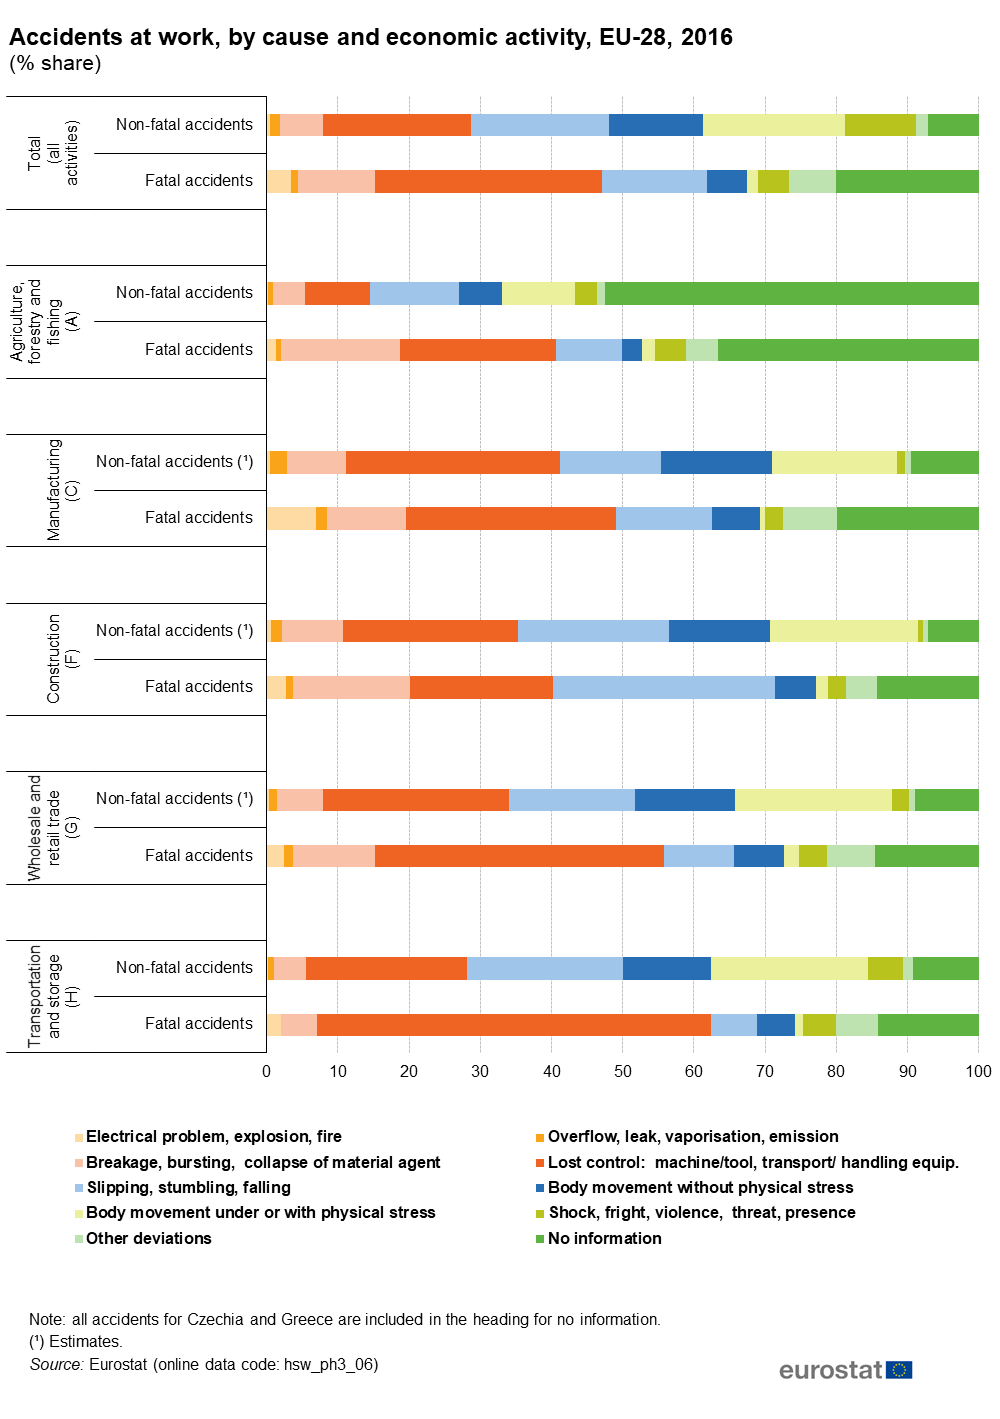
Accidents at work, by cause and economic activity, EU-28, 2016 (% share).png
(
file
)
107 KB
1
17:54, 9 December 2019
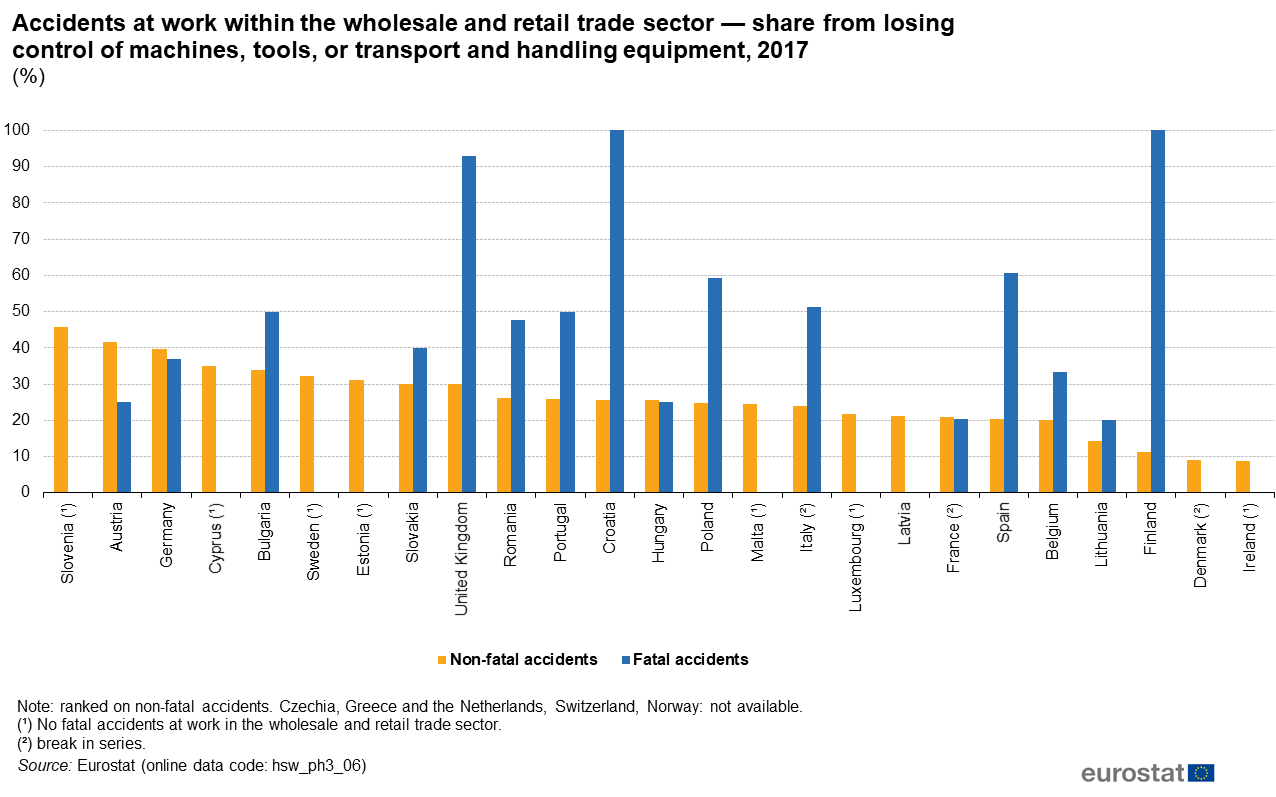
Accidents at work within the wholesale and retail trade sector,2017 (%).png
(
file
)
91 KB
1
17:56, 9 December 2019
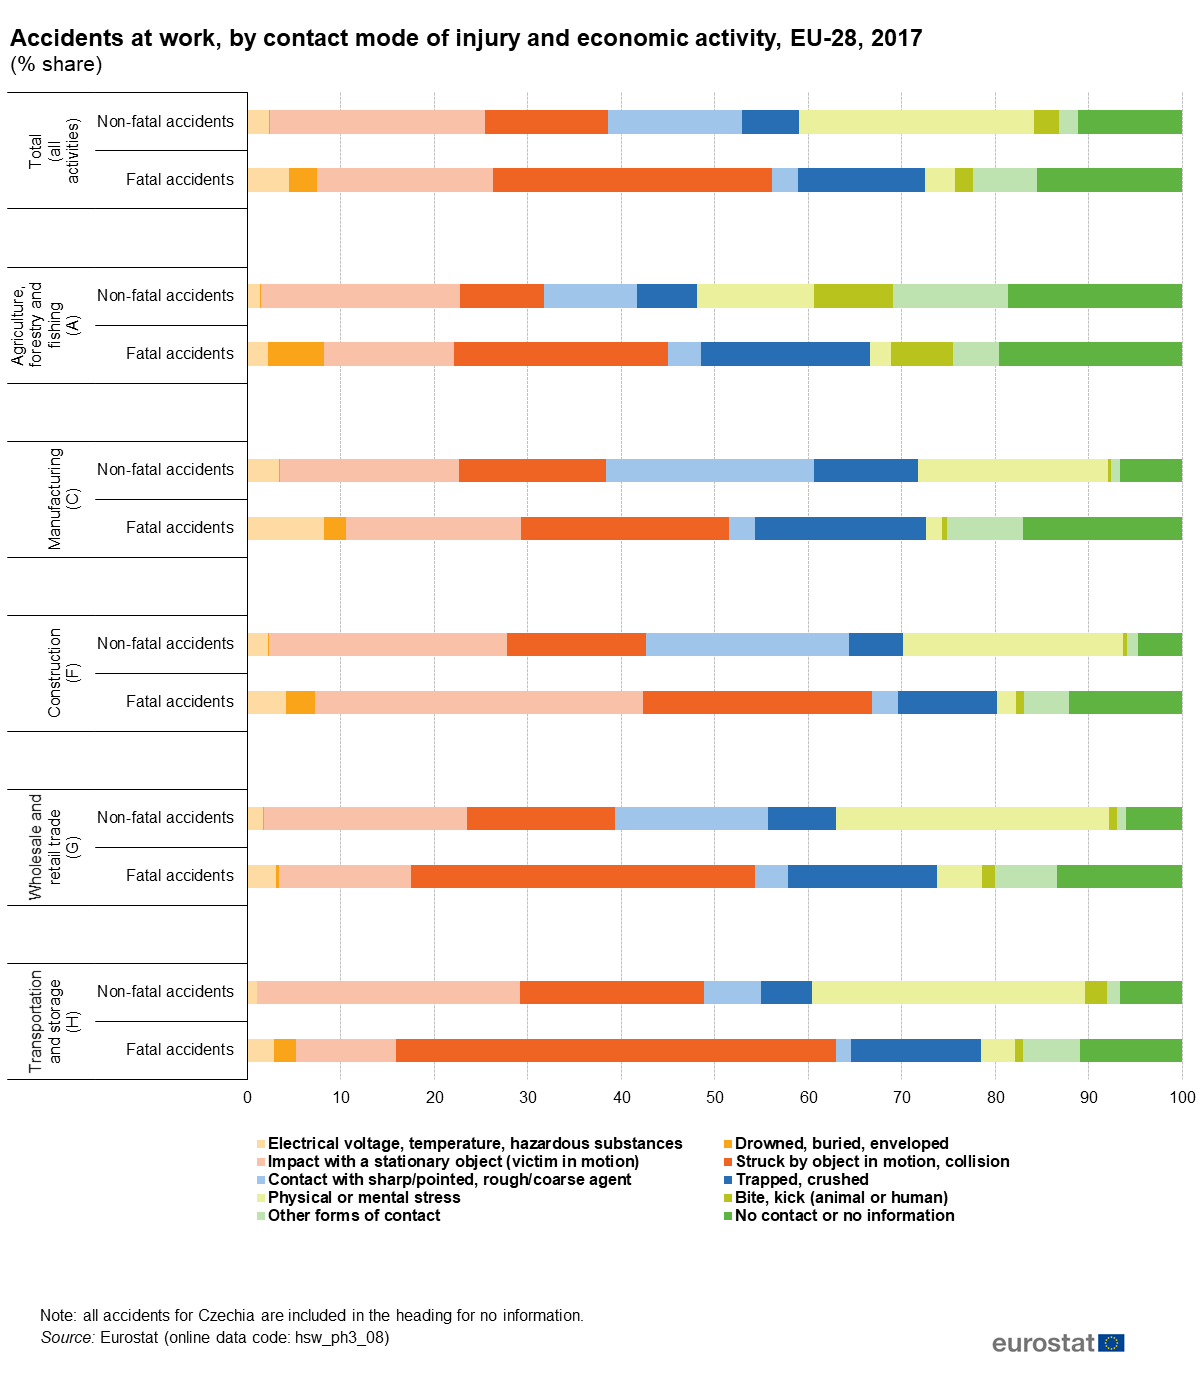
Accidents at work, by contact mode of injury and economic activity, EU-28, 2017 (% share).png
(
file
)
112 KB
1
12:03, 13 December 2019
Accidents at work by economic activity 2019.xlsx
(
file
)
147 KB
1
11:25, 19 December 2019
Tables and Figures Accidents causes and circumstances 2019.xlsx
(
file
)
171 KB
3
11:28, 19 December 2019
Tables and Figures Accidents causes and circumstances nov2019.xlsx
(
file
)
171 KB
1
Special page
ISSN 2443-8219


.png)
.png)
.png)
.png)
.png)
.png)
.png)
.png)


.png)

.png)
.png)
.png)
.png)
.png)