This tutorial is part of How to create an article step by step and describes inserting tables, graphs and maps to an article.
Once your text (including glossaries and links) is ready, it is time to insert graphs, tables and possibly maps to illustrate your text.
Preparing the images
- Create your tables and graphs in Excel
- Use the Eurostat add ins to get the right layout (see Eurostat Layout Tutorial)
- Name your graphs and tables in the right way: not just "Table 1" or "Figure 2", but also including a description of the content. This is because the graph or table can be found through Google search and therefore it has to "stand alone". The geographical area, the reference period and the unit have to be mentioned in the title. Example: Population structure, by broad age groups, by NUTS 3 regions, 1 January 2013 (% of total population). See more about titles here and here.
- As for the title of the article, characters to be avoided in the title are: / (slash), \ (backslash), ? (question mark), * (asterisk), + (plus) : (colon), | (vertical bar), " (quotation mark), long dash — or ' (apostrophe).
- Once your tables and graphs are finalised, they need to be uploaded to Statistics Explained and then inserted in the article.
Uploading to Statistics Explained
1. Create a PNG file from each image
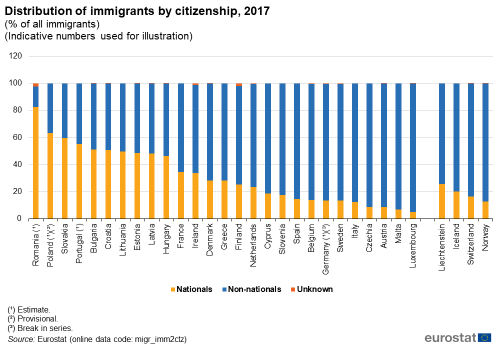
To publish your charts or tables in Statistics Explained, you have to provide a PNG file of the charts and tables.
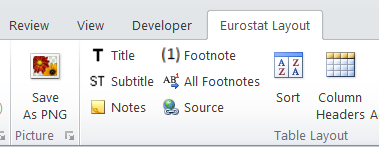
The Eurostat Layout add-in provides a command to support this task. There is a Picture group on the Eurostat Layout ribbon tab, as shown here:
Note: Title and source are mandatory items in the PNG, when publishing on Statistics explained. The Save as PNG command checks, whether you include these items. If not, you are asked to include them.
Saving Tables as PNG
To create a PNG file for a table, do the following:
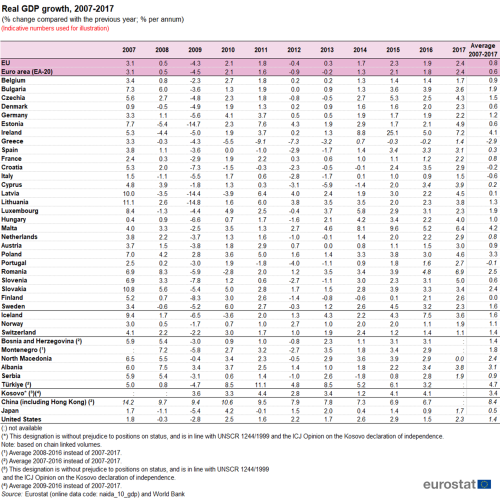
- (1) Select the range of cells to be displayed in the PNG including the table title, notes, footnotes and source.
- (2) Click on the Save As PNG button.
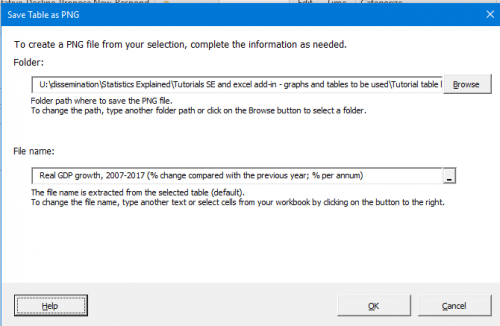
- (3) The following dialog box appears:
- (4) By default, the PNG is saved in the same folder where the active Excel file is located. The file name is extracted from the table title and subtitle. You can modify the folder and file name as needed.
- (5) Click on OK to save the PNG file.
Saving Charts as PNG
To create a PNG file for a chart, do the following:
- (1) select the chart and click on the layout button
- (2) In the excel worksheet, select the cells containing the chart title
- (3) Select the cells containing the source, footnotes and notes. The chart is formatted and contains the title, subtitle, footnotes, notes, source and the Eurostat logo.
- (4) Select the formatted chart to be displayed in the PNG.
- (5) Click on the Save As PNG button.
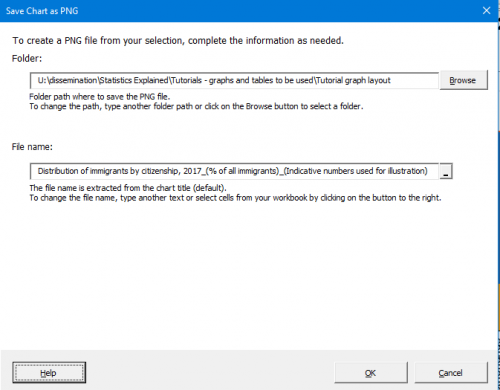
- (6) The following dialog box appears:
- (7) By default, the PNG is saved in the same folder where the active Excel file is located. The file name is extracted from the chart title. You can modify the folder and file name as needed.
- (8) Click on OK to save the PNG file.
- Keep track of the titles of the uploaded files, you will need them for the next step!
Inserting the images in the articles
1. Insert the image manually
- Go to the article where the image should be displayed
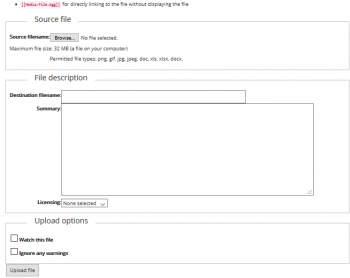
- click on 'Tools' on the top of the article , and chose 'upload file'
- click on browse and select the png file
- click on upload file at the bottom of the page.
- a new page opens with the title of the image and the image displayed: copy the descriptive title , including the 'png' extension (but without taking the word 'File:')
- use the back arrow twice to go back to the article where the image should be displayed
- click on the edit button at the bottom of the article
- paste the title into the template of the image, in both places (marked in yellow).
- Figure, Table or Map x: Title of the figure, table or map complete with the appropriate image type and number and its title you want to display below the image in the article;
- insert the data code with the corresponding data code from Database or Main table (if available). (marked in blue).
- save your page after each upload of image
- add the alternative text for the image immediately after the data code brackets }}
- For data included in the Excel file, the alternative text should be simple and timeless. At the end, add the sentence ‘The complete data of the visualisation are available in the Excel file at the end of the article.’
- Example: [[Image:F1_housing_2022.png|thumb|centre|500px|Figure 1: Main housing rates for persons aged 18 years or over, by citizenship, EU, 2022<br> (%)<br>'' Source:'' Eurostat {{Stable link|title=|code=ilc_lvps15}}, {{Stable link|title=|code=ilc_lvho15}} and {{Stable link|title=|code=ilc_lvho25}}|alt=A multi bar chart showing the main housing rates in the EU for persons aged 18 years or over, by citizenship for the year 2022. Data are shown in percentage.]]
- For data not available in the Excel file, the alternative text should be more detailed. Please follow the guidelines provided by the Publications Office Training on accessible publishing - alternative text
- If your article already contains alternative text, please check that it is still valid and change it as necessary.
2. Insert the image using the Editor automatic tool
(Follow the steps as above for inserting an image manually until 'copy the descriptive title with 'png' extension...')
- Go to the article where the image should be displayed, open an editing mode (click 'edit' at the bottom of the page), place your cursor where the image should be inserted and choose the following icon from the editor navigation bar:
- In the field 'Image file name' paste the exact title of the png file you uploaded (Example: Population structure, by broad age groups, by NUTS 3 regions, 1 January 2013 (1) (% of total population) RYB14.png).
- In the field 'Caption' paste the title you want to display below the image directly in the article (Example: Population structure, by broad age groups, by NUTS 3 regions, 1 January 2013 (% of total population)).
- The size and the position of the image are set up automatically as right and 350 px, however this should be manually changed to centre and 500 px
- Click insert and then save page.
- For adding alternative text, see instructions above for inserting image manually.
Dashboards, widgets etc.
- To insert dashboards, widgets and other visualisation tools, please contact the Statistics Explained team. For details, please see:Tutorial:Creating and inserting a flexible dashboard

