This is a machine translation provided by the European Commission’s eTranslation service to help you understand this page. Please read the conditions of use.
This special page shows all uploaded files.


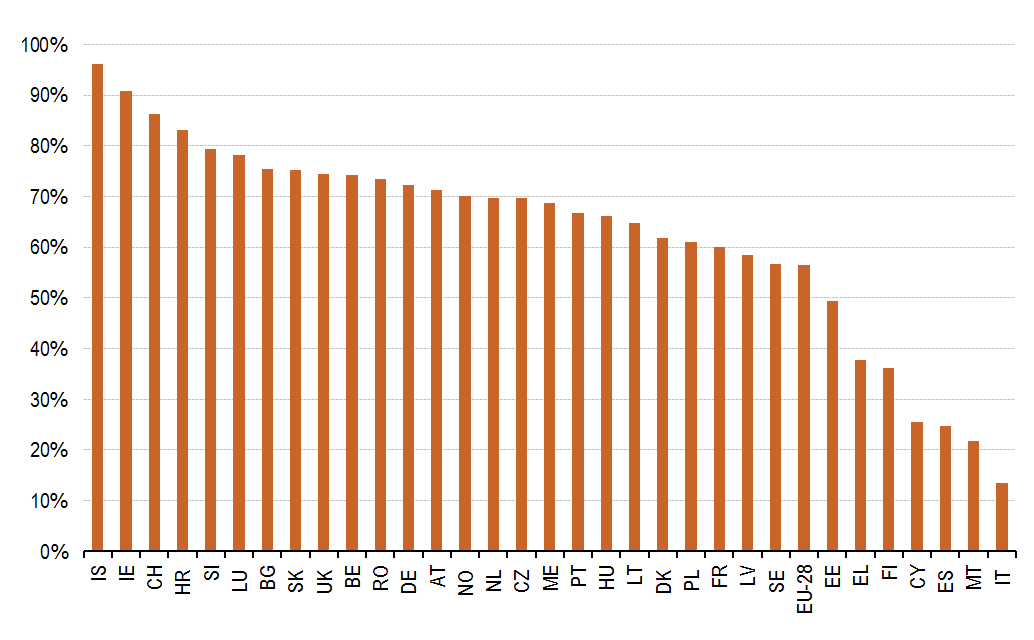
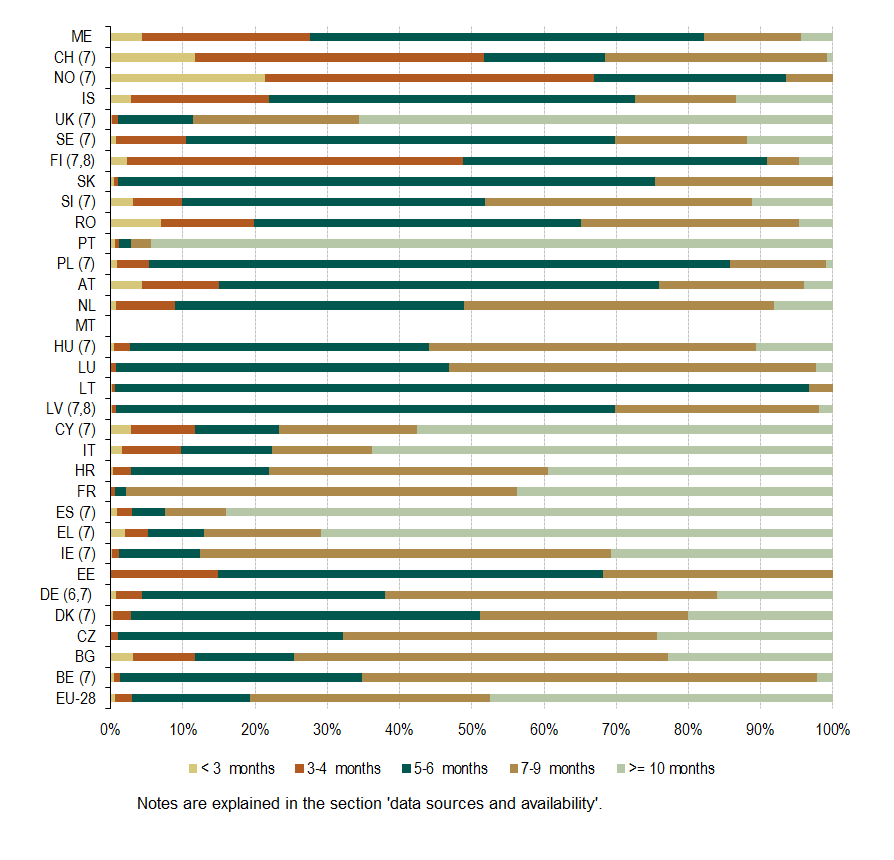
,_EU-28,_2010_.png)
,_EU-28,_2010_.png)
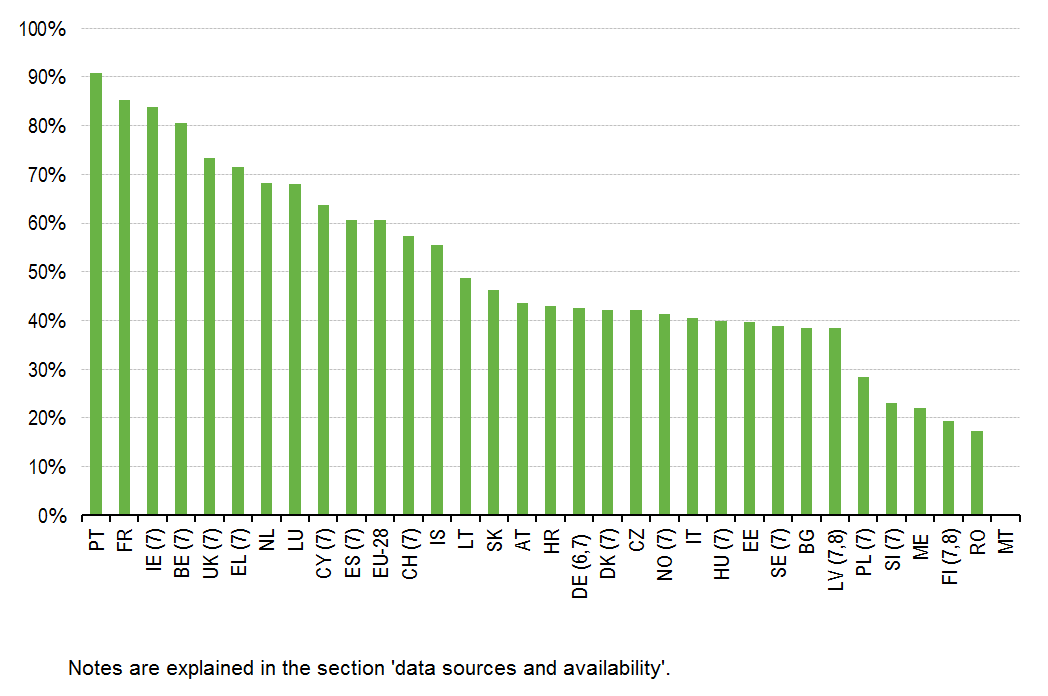
,_EU-28,_IS,_CH,_NO_and_ME,_2010.png)
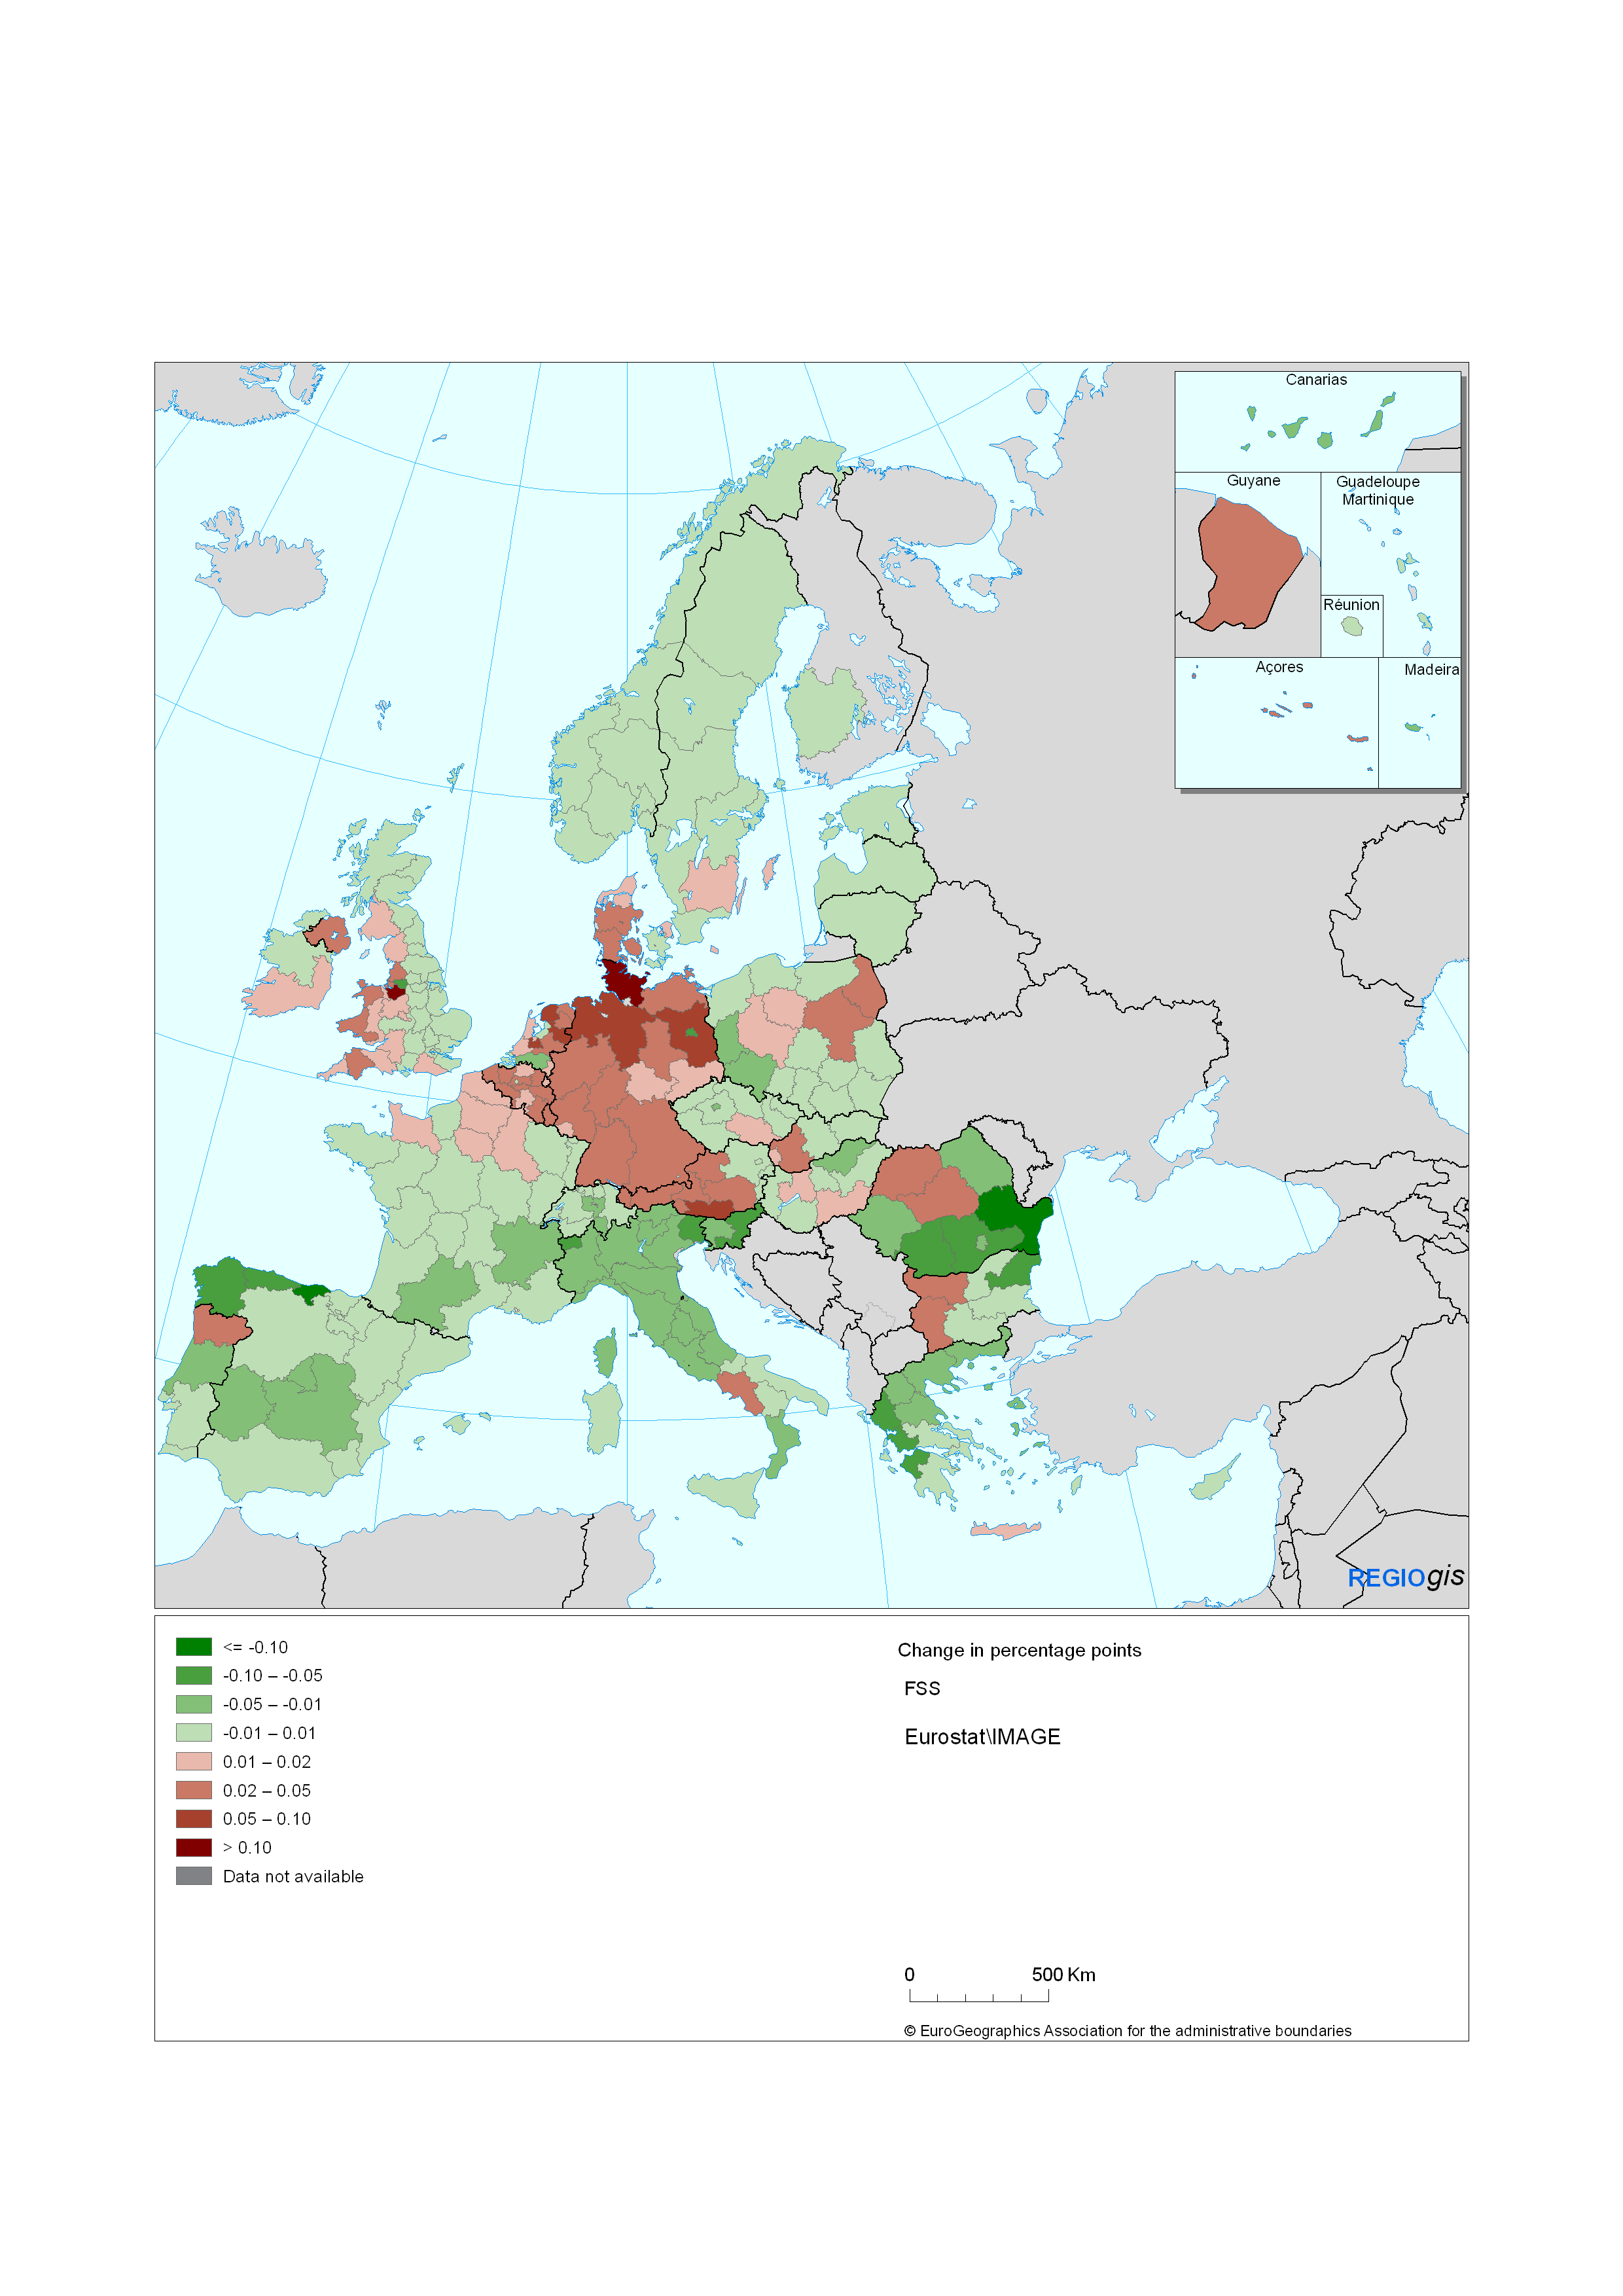
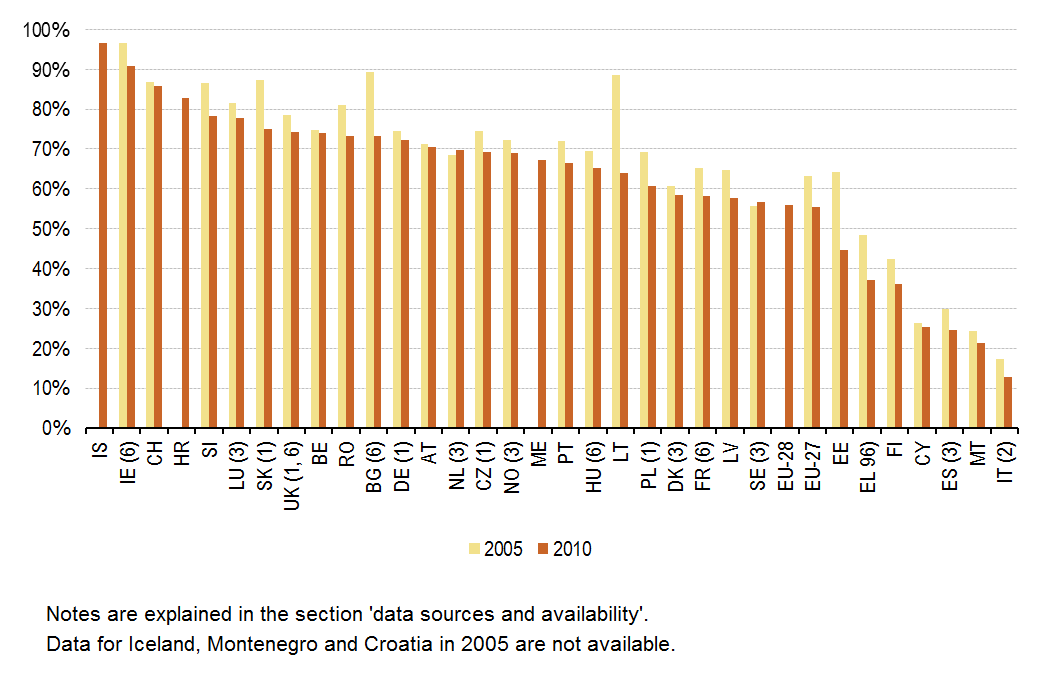
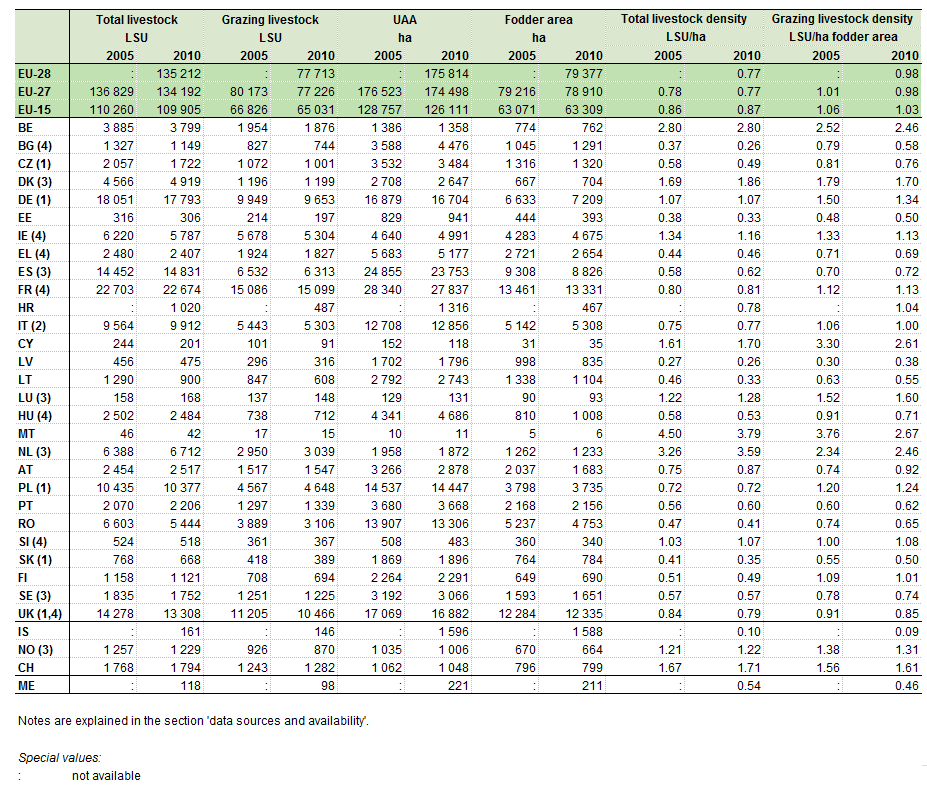
,_EU-27,_NO_and_CH,_NUTS2,_2005-2010_English.png)

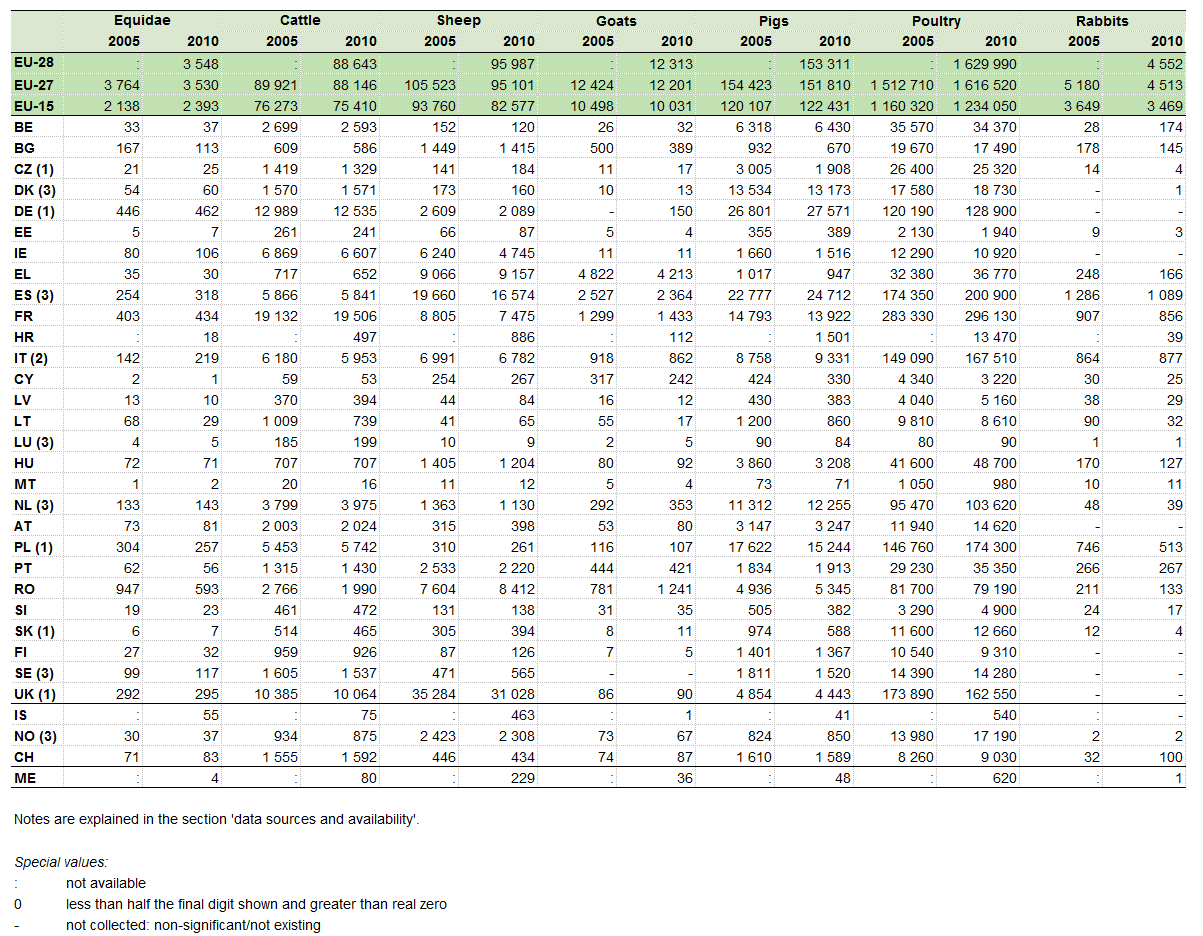
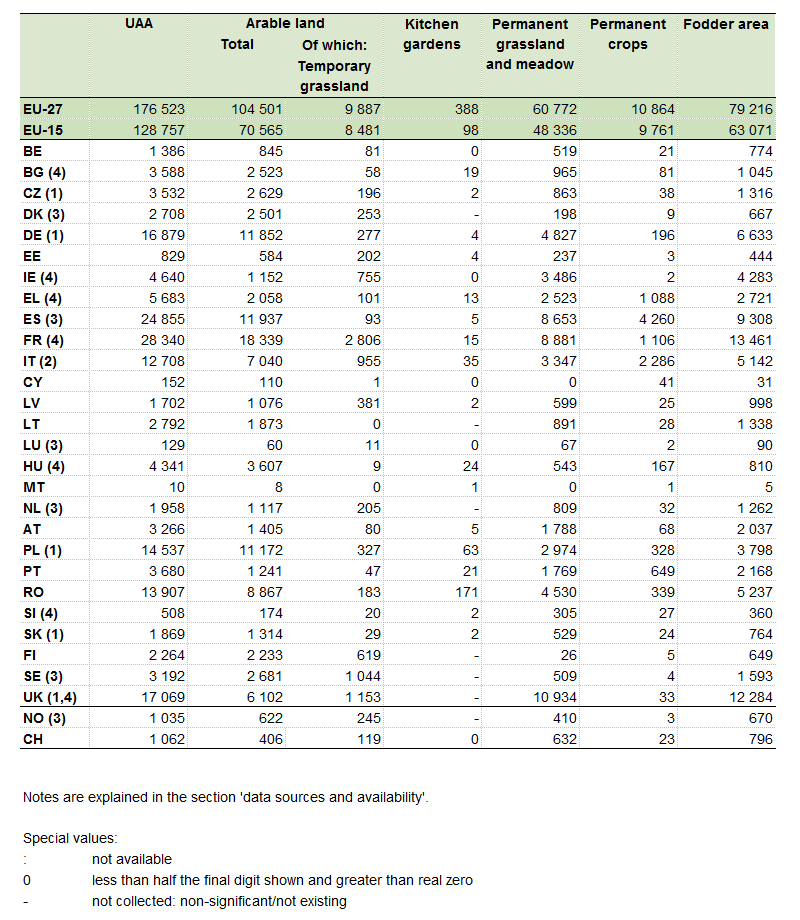
.png)


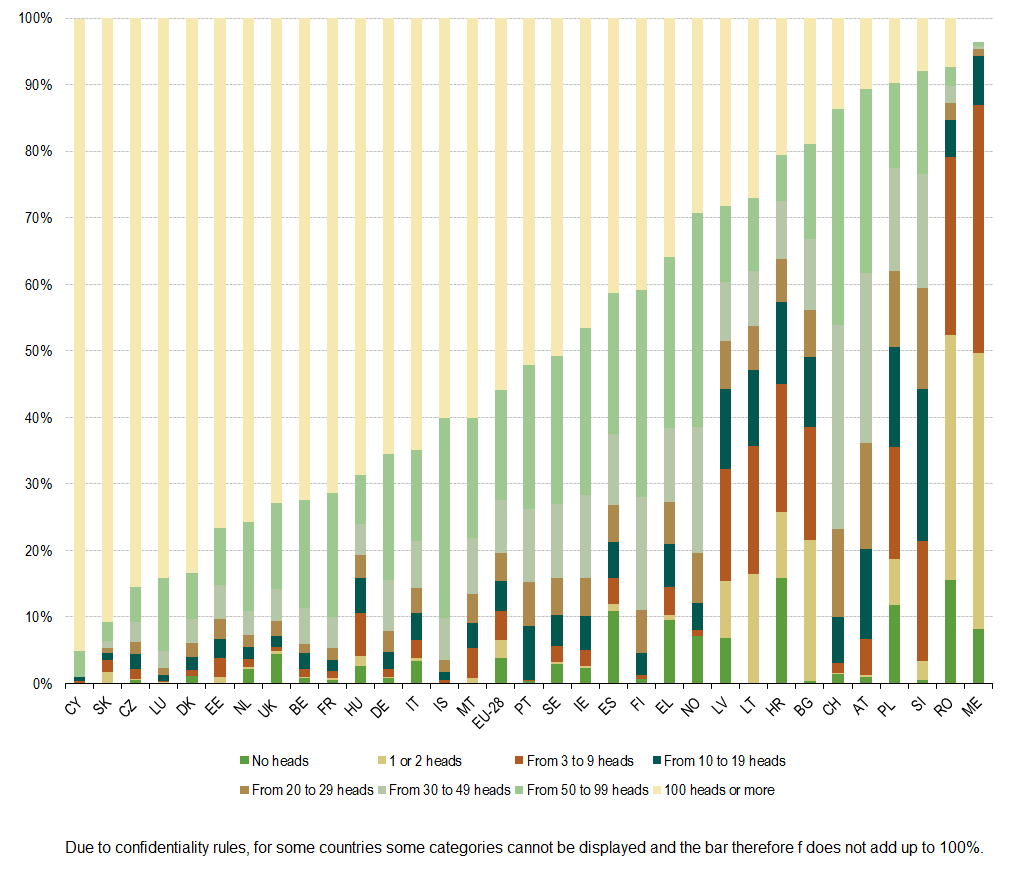
,_EU-28,_2010_.png)
,_EU-28,_2010_.png)


.png)

,_EU-28,_NO,_IS,_CH,_ME,_NUTS0,_2005-2010.png)


_grazing_on_common_land_by_size_of_the_holding_in_LSU,_2010.png)

,_2010.png)
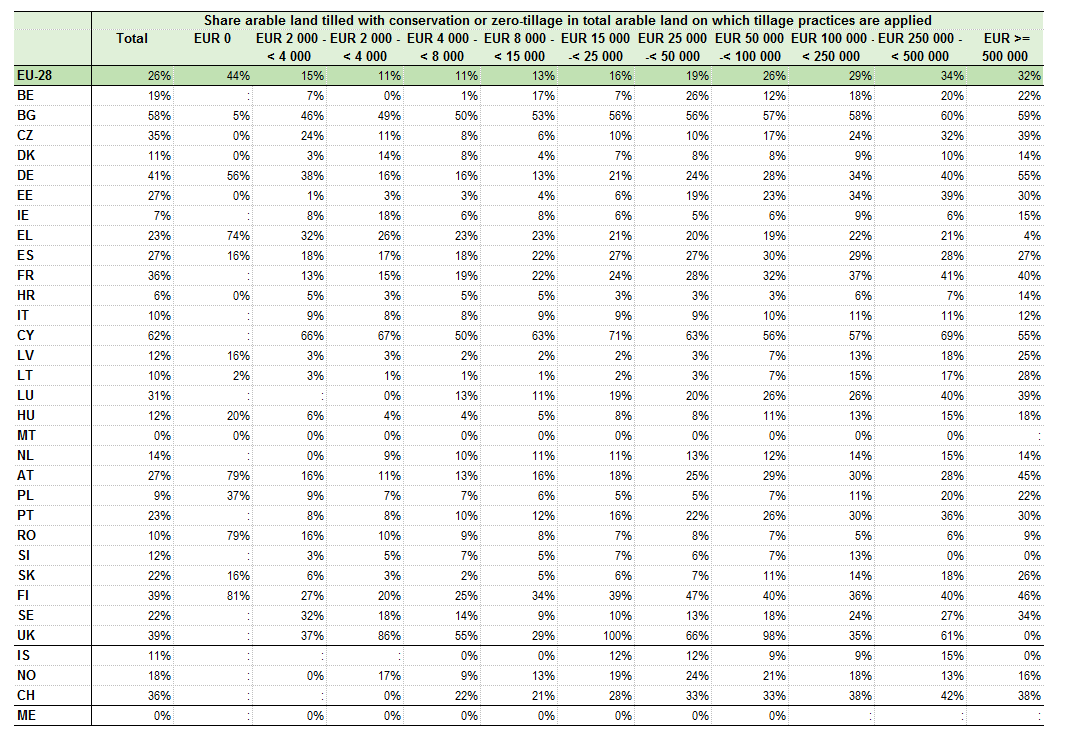
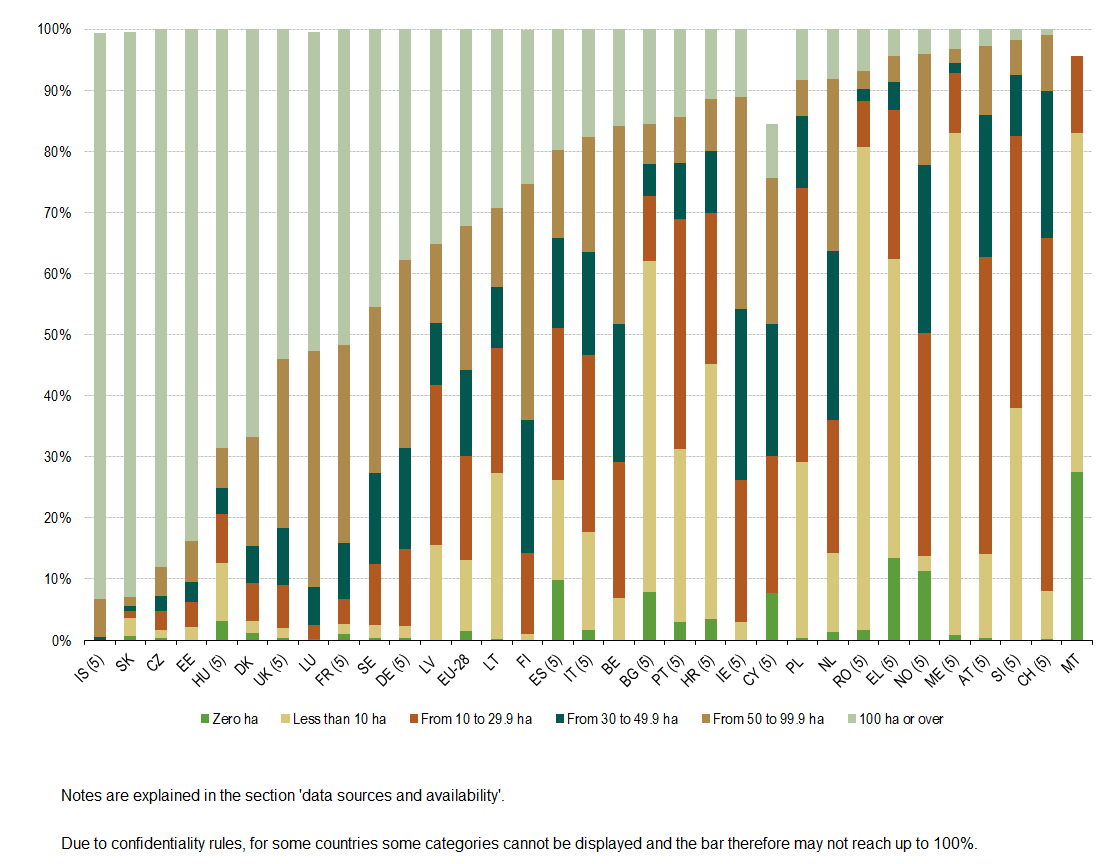
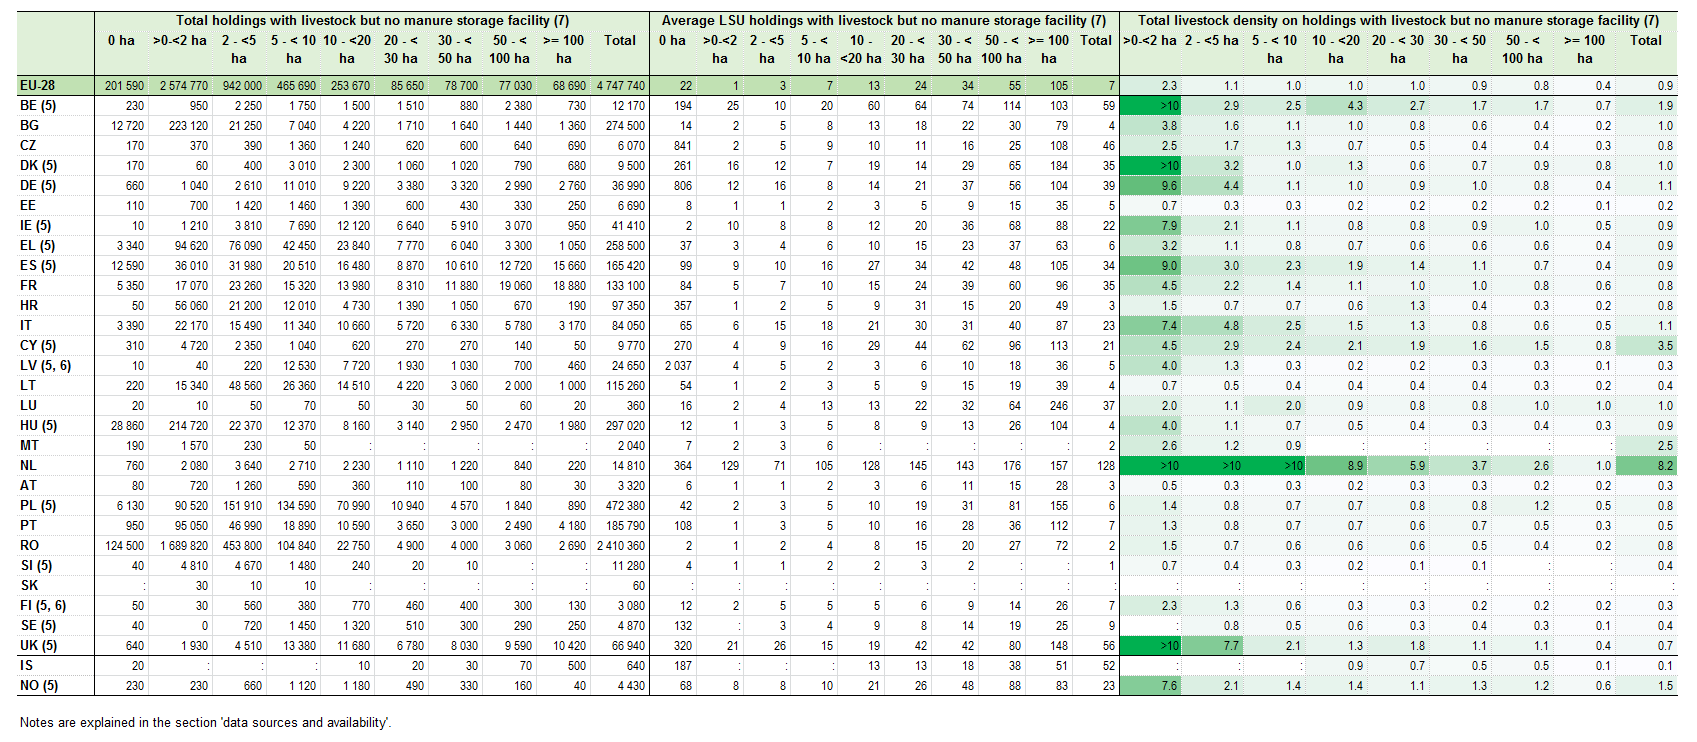
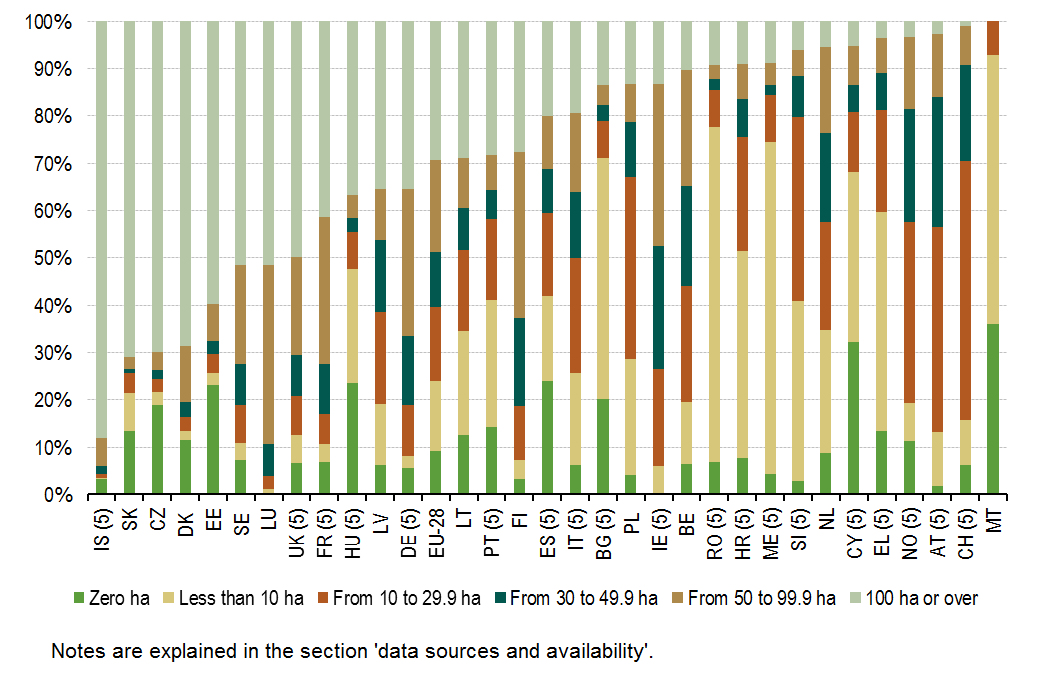
_by_size_of_the_holding_(ha_UAA),_EU-28,_NO,_IS,_CH,_ME,_NUTS0,_2010.png)
_by_size_of_the_holding_(ha_fodder_area),_EU-28,_NO,_IS,_CH,_ME,_NUTS0,_2010.png)
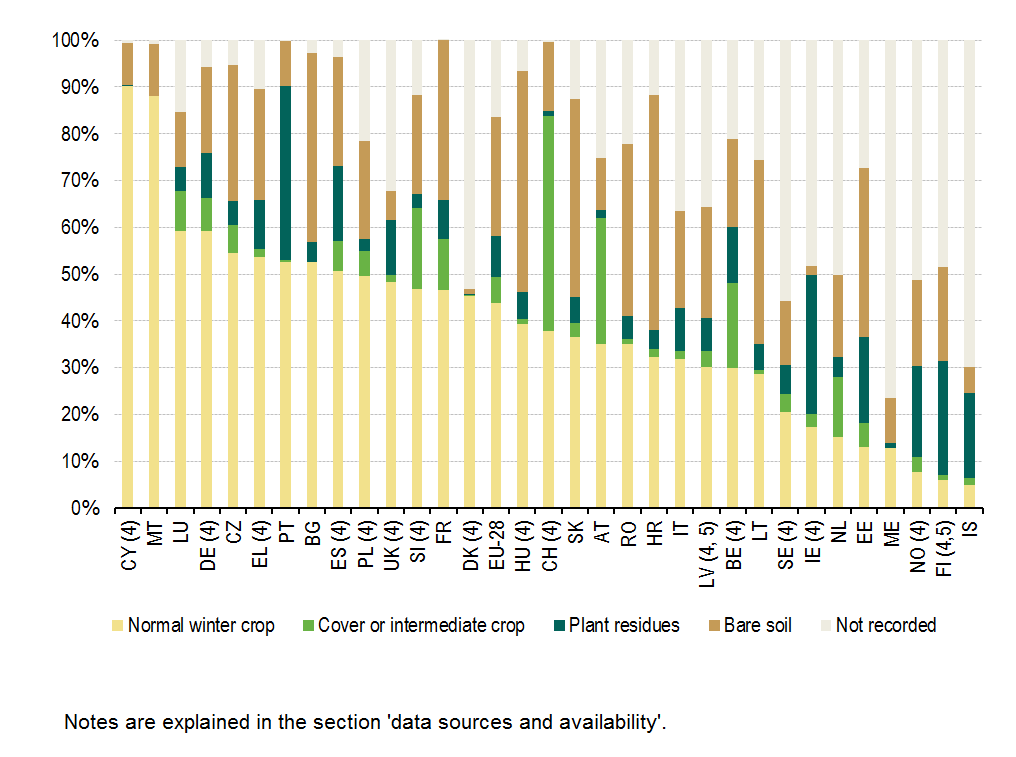
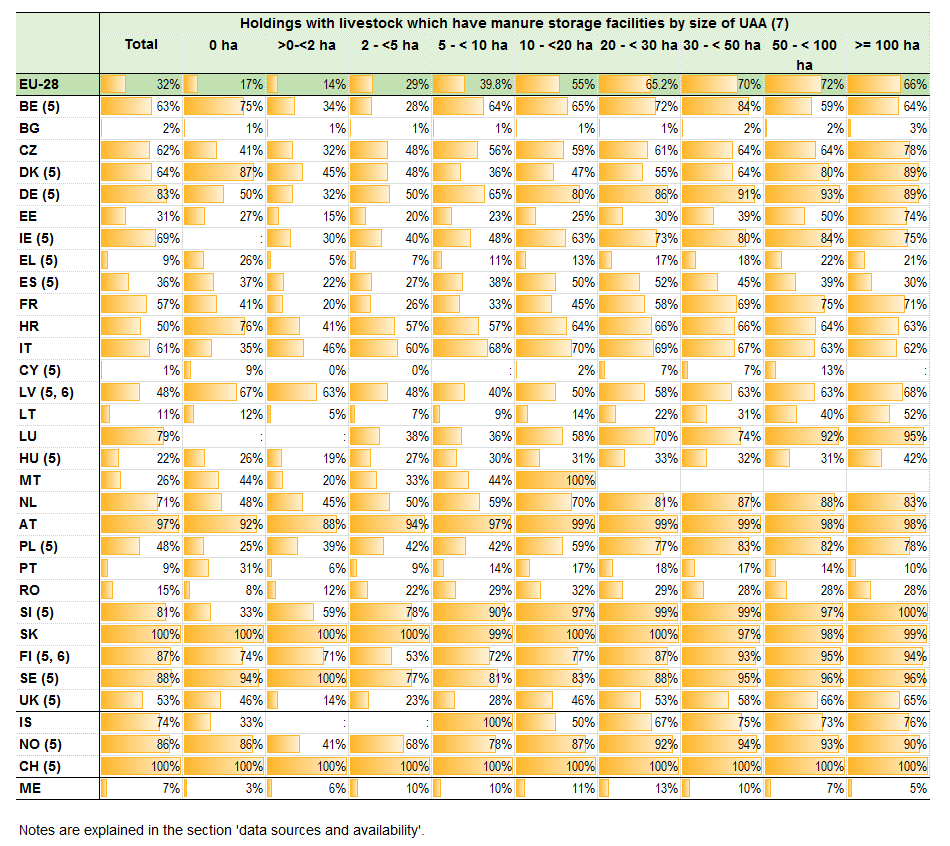
,_EU-28,_NO,_IS,_CH,_ME,_NUTS0,_2010.png)
_by_size_of_the_holding_(ha_UAA),_EU-27,_NO,_IS,_CH,_ME_and_HR,_NUTS0,_2010.png)


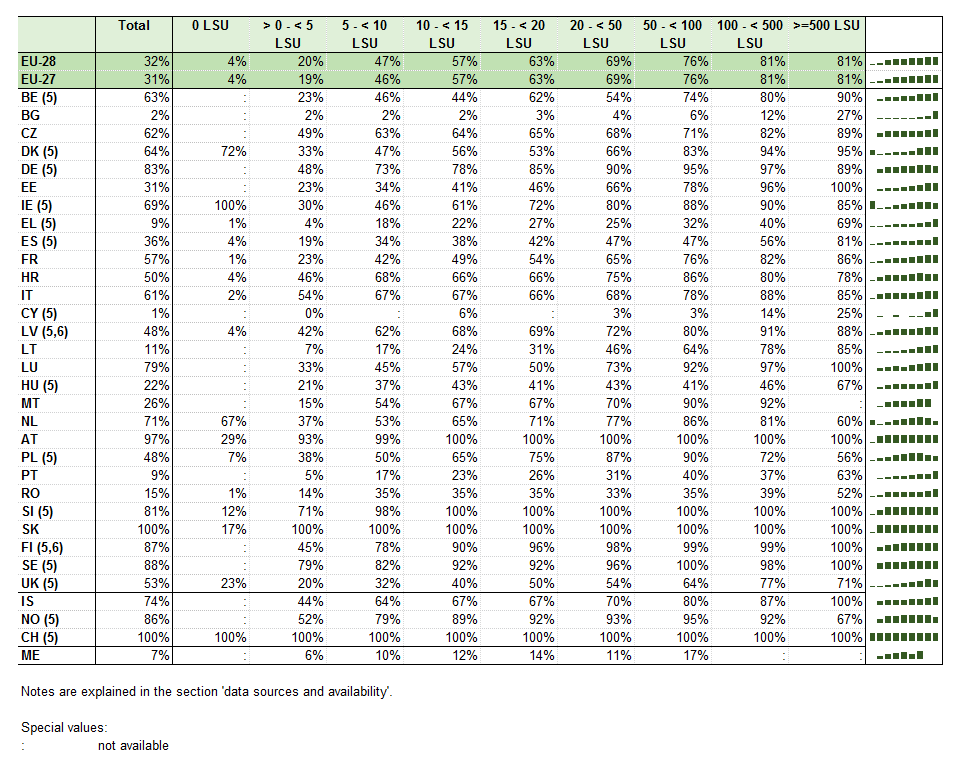
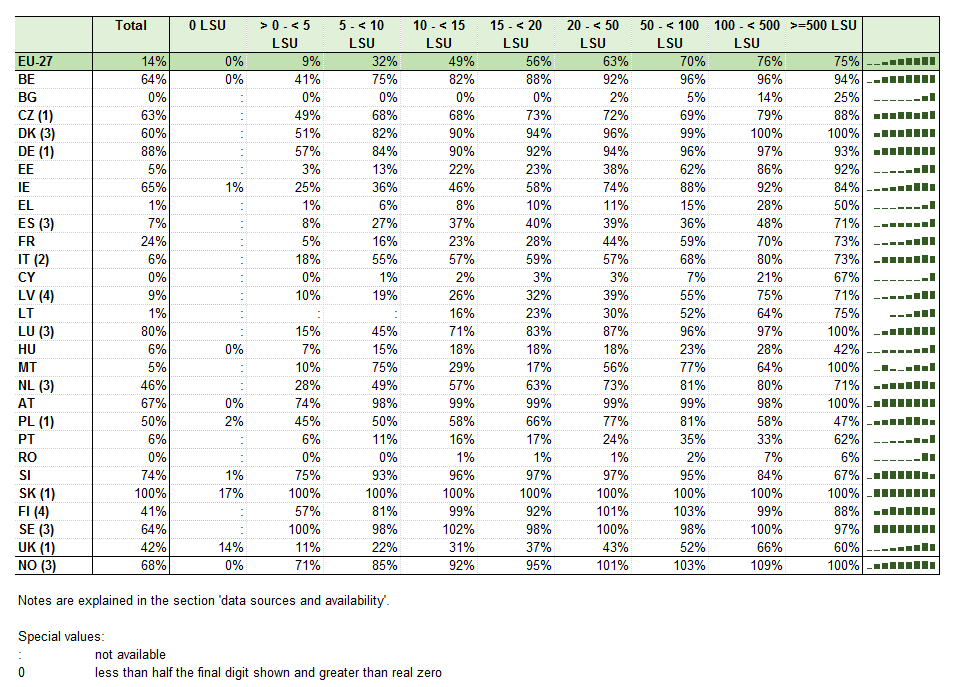
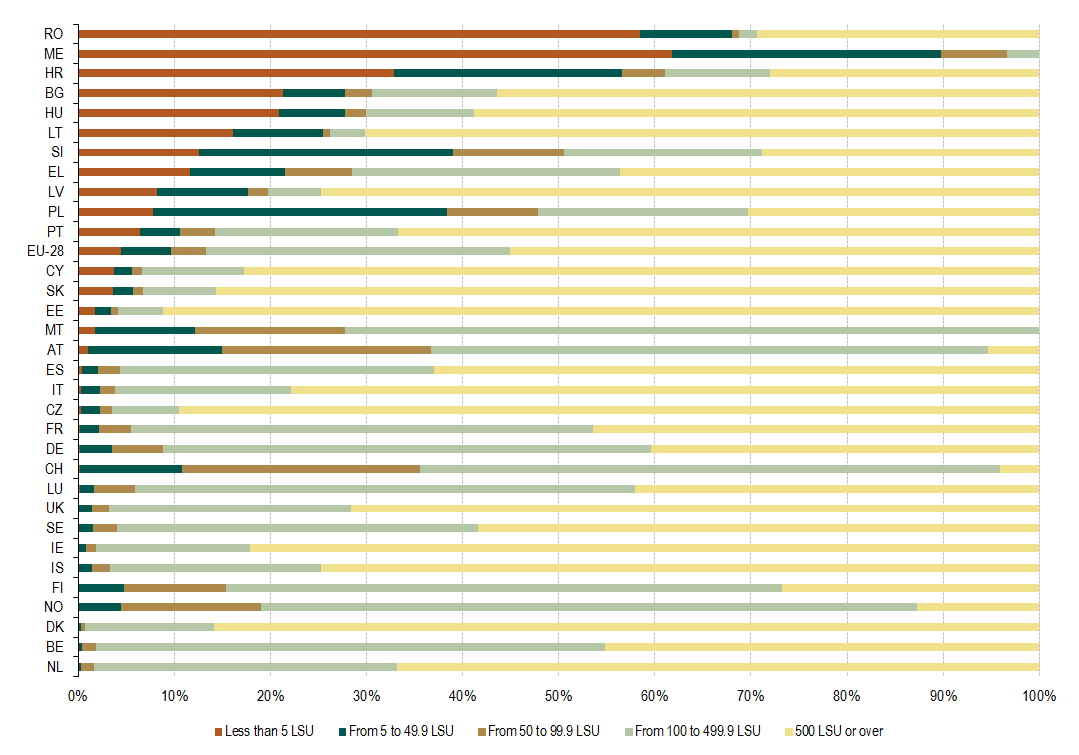
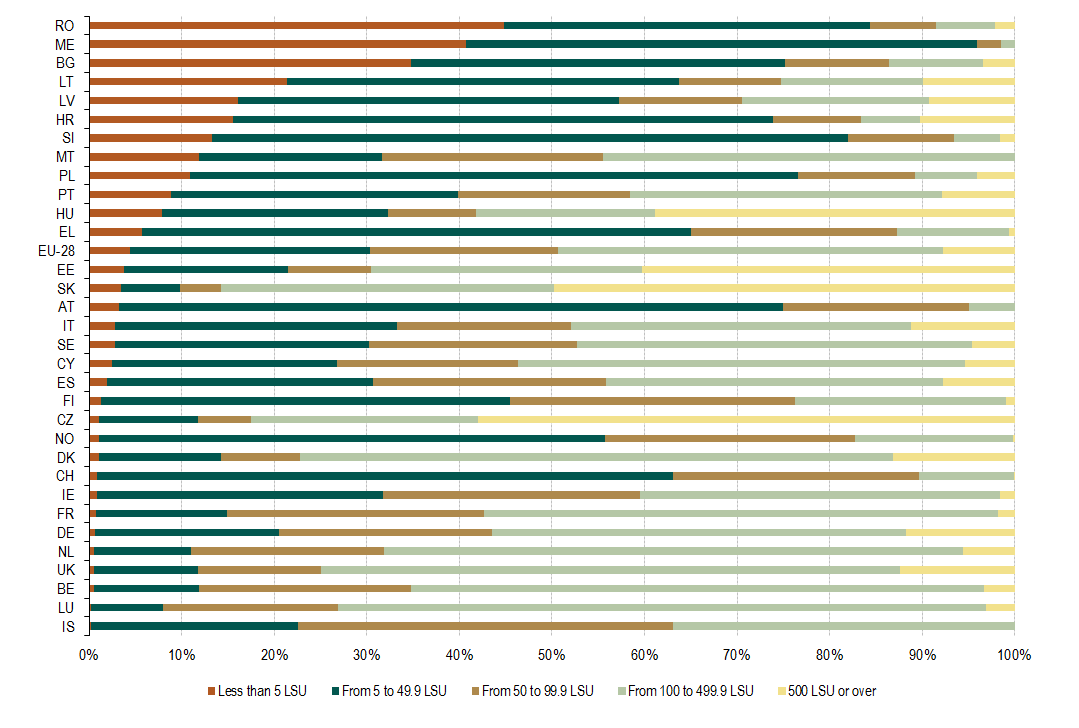
_by_size_of_the_holding_(in_LSU),_EU-28,_NO,_IS,_CH,_ME,_NUTS0,_2010.png)
_by_size_of_the_holding_(in_LSU),_EU-28,_NO,_IS,_CH,_ME,_NUTS0,_2010.png)
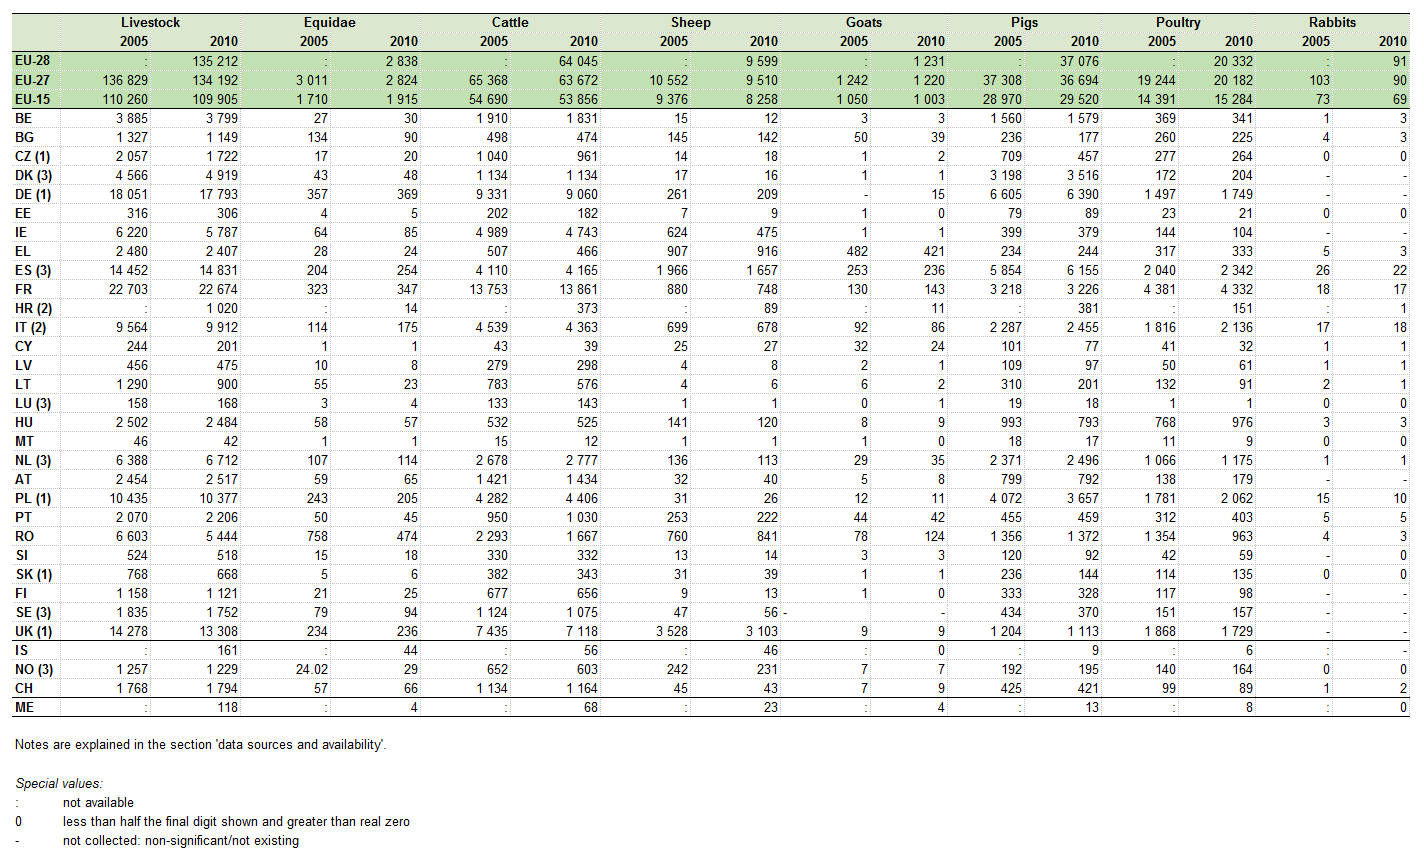
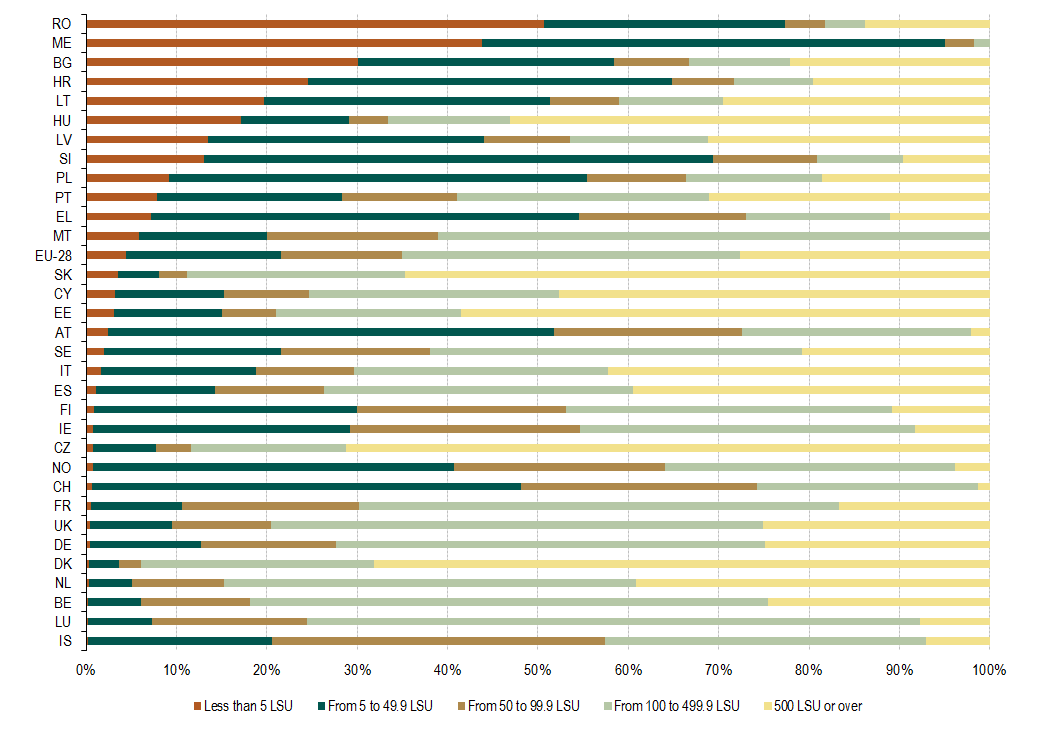
,_EU-28,_NO,_IS,_CH,_ME,_NUTS0,_2010.png)
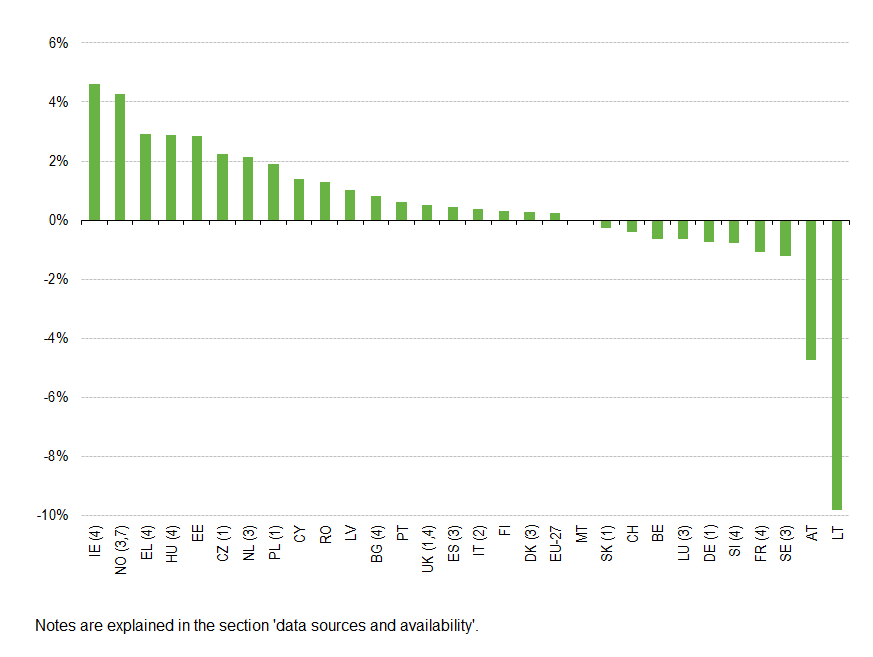
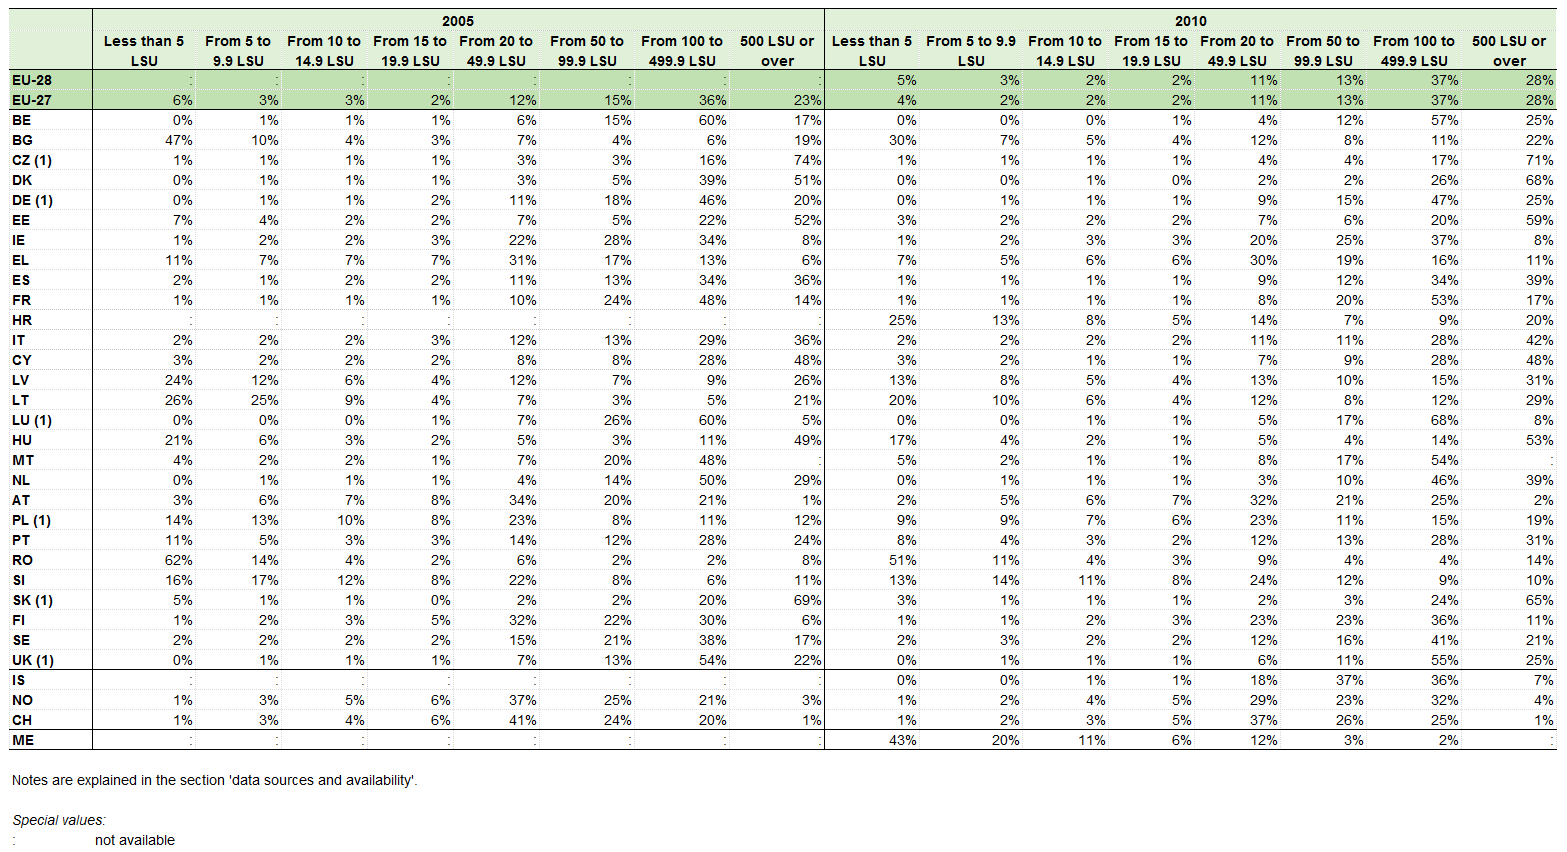
,_EU-28,_NO,_IS,_CH,_ME,_NUTS0,_2005-2010.png)
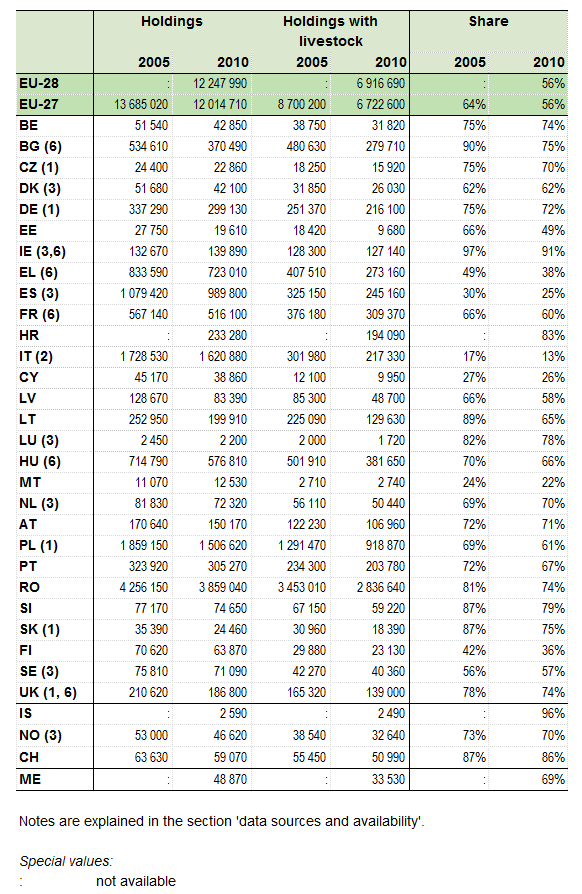
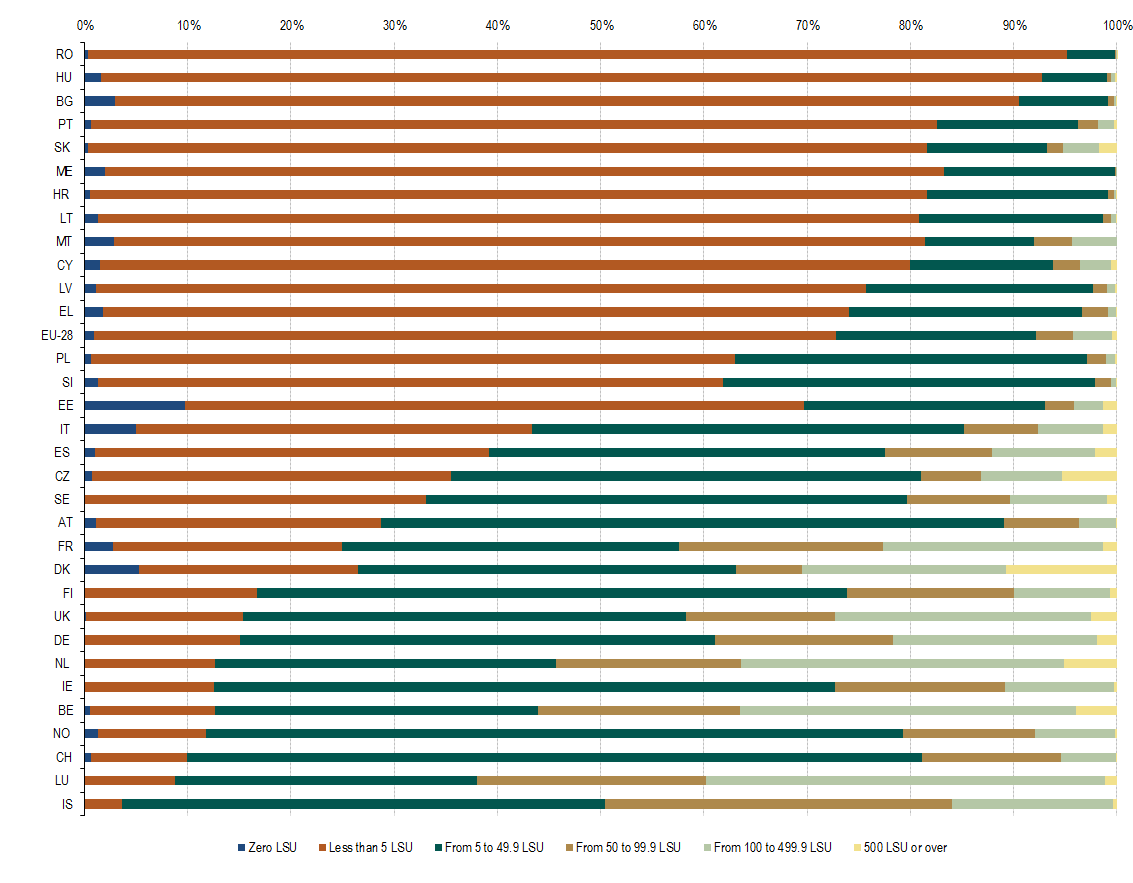
,_EU-27,_NO,_IS,_CH,_ME_and_HR,_NUTS0,_2010.png)


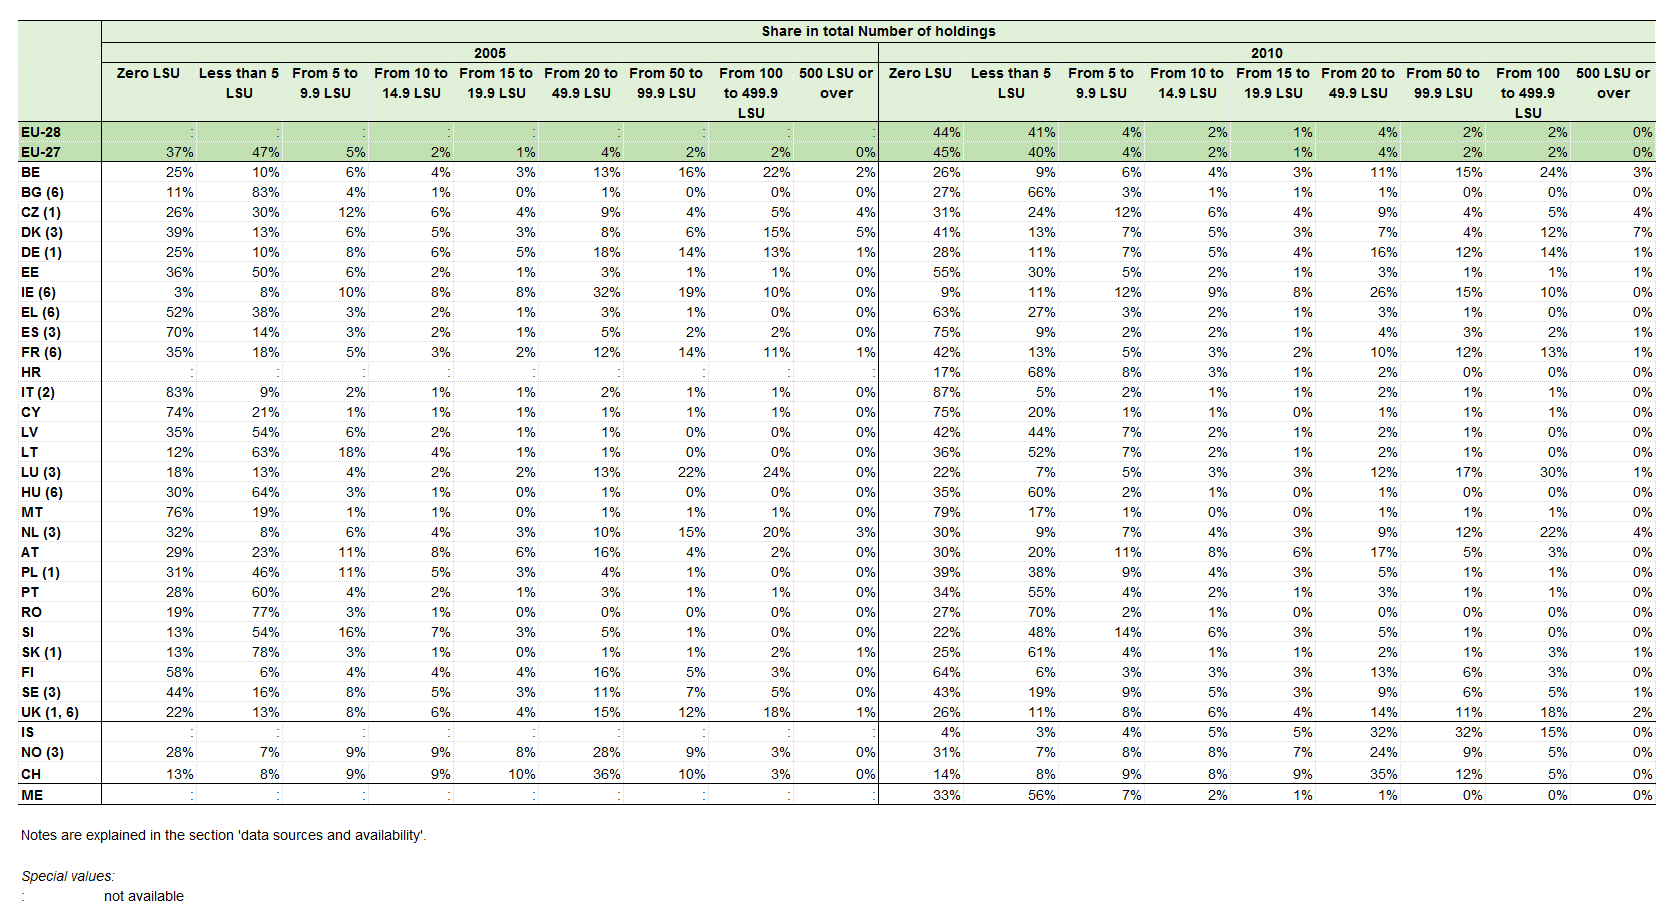
.png)
,_EU-28,_IS,_NO,_CH,_ME,_2010.png)


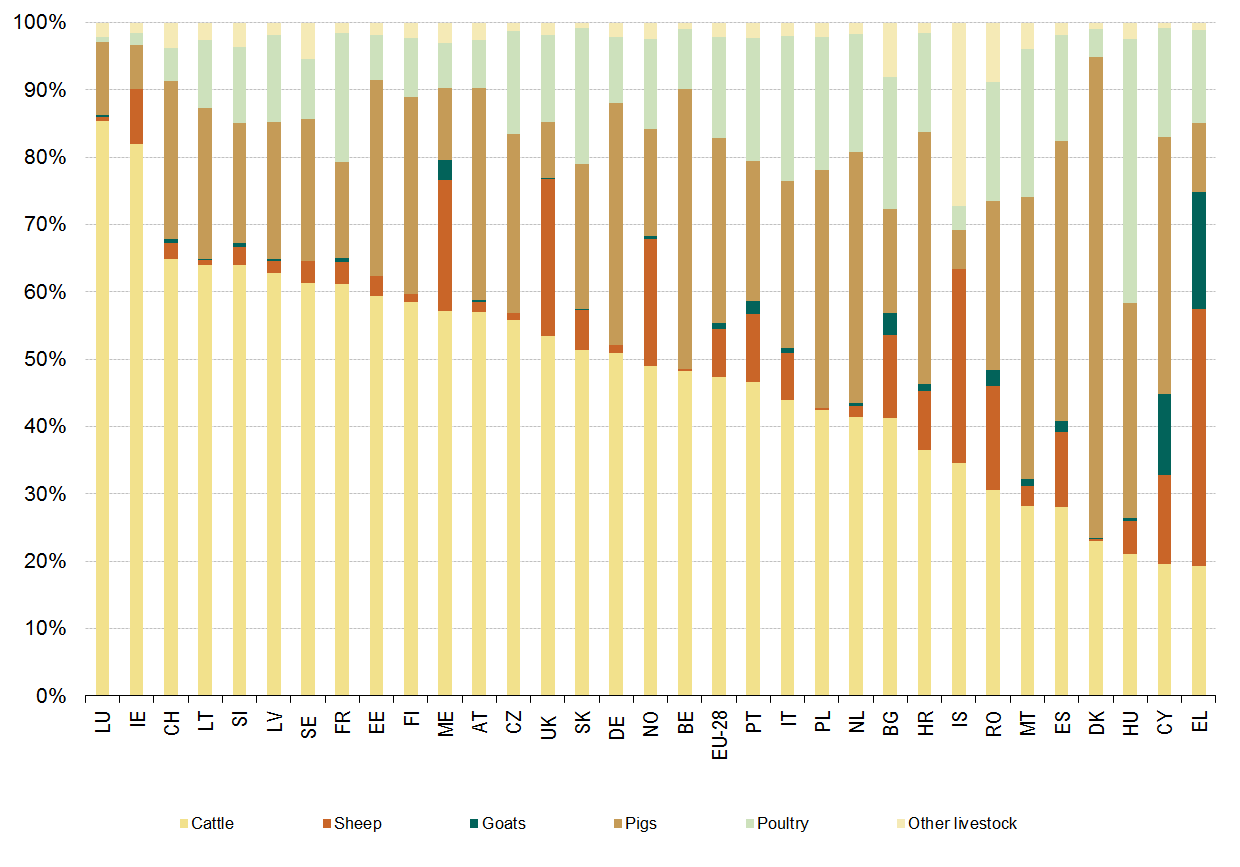
.png)