Data from November 2024.
Planned article update: November 2025.
Highlights
In 2022, the total expenditure on social protection benefits in the EU amounted to €4 319 billion, or 26.9% of GDP.
In 2022, some 46% of total expenditure on social protection benefits in the EU was for the old age and survivors function, followed by the sickness/health care function with 30%.
During the period 2012-2022, expenditure on social protection benefits recorded the most expansion in the housing and social exclusion function, followed by the family/children function.
Expenditure on social protection benefits, 2022
This article presents statistics relating to expenditure on social protection benefits in the European Union (EU), the EFTA countries, as well as the enlargement countries. These statistics are collected through the European system of integrated social protection statistics (ESSPROS).
Expenditure on social protection benefits by function
In 2022, the total expenditure on social protection benefits in the EU amounted to €4 319 billion, which was equivalent to 26.9% of gross domestic product (GDP). An analysis by function reveals that the highest level of expenditure in the EU was recorded for the old age and survivors function (largely composed of pensions), which accounted for close to half (46.3%) of the total expenditure on social protection benefits in 2022. The next highest share, accounting for slightly under a third (30.2%) of the EU's expenditure on social protection benefits, was for the sickness/health care function, while each of the remaining functions (shown in Figure 1) accounted for single-digit shares. Among these, the highest proportion was recorded for the family/children function (8.6% of total expenditure on social protection benefits), followed by disability (7.0%), unemployment(4.1%) and housing and social exclusion (3.9%).
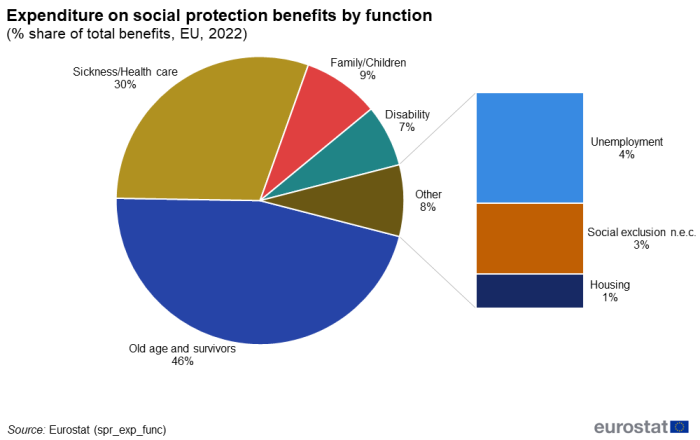
(%, share on total benefits)
Source: Eurostat (spr_exp_func)
In France, the level of expenditure on social protection benefits was about one-third of GDP
There were considerable variations between EU Member States with respect to their levels of expenditure on social protection benefits relative to GDP. In 2022, this ratio peaked at 32.0% in France, followed by Finland (29.6%), Austria (29.5%), Italy (28.9%) and Germany (28.8%). At the other end of the range, the ratio of expenditure on social protection benefits relative to GDP was 11.0% in Ireland, 14.1% in Malta, 15.4% in Estonia and 16.1% in Romania; relatively low ratios (below 20%) were also recorded in Lithuania, Hungary, Latvia, Slovakia, Bulgaria and Czechia (see Figure 2). It is important to take into consideration these overall ratios of expenditure in the different EU Member States when analysing the relative shares of different functions in total expenditure. On average, from 2012 to 2022 the share on GDP of expenditure in social benefits decreased in the EU from 27.2% to 26.9%; however, there are large differences among countries: most EU countries showed an increase in this share (with a maximum of 3.4 pp in Latvia), while 12 countries recorded a reduction in this share, the highest being measured for Ireland (-12.0 pp).
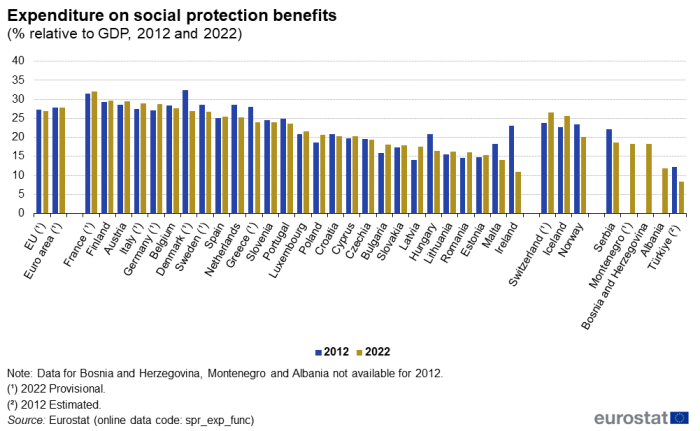
(% relative to GDP)
Source: Eurostat (spr_exp_func)
Old age and survivors plus sickness/health care are predominant functions in all countries
As noted above, benefits for old age and survivors accounted for the highest share of EU expenditure on social protection benefits in 2022, at 46.3%. This pattern of the old age and survivors' function recording the highest share of total expenditure was repeated in each of the EU Member States except for Ireland where the sickness/health care function was the largest (44.4%).
In 2022, the second highest level of EU expenditure on social protection benefits was for sickness/health care, which accounted for slightly under a third (30.2%) of total expenditure. This pattern was repeated in all EU countries except Ireland, where the level of expenditure on sickness/health care was higher than that for old age and survivors. The share of sickness/health care in total expenditure on social protection benefits ranged from highs of 44.4% in Ireland and 37.0% in Slovenia down to lows of 22.9% in Denmark, Greece and Italy.
Benefits for family/children averaged 8.6% of total EU expenditure on social protection benefits in 2022. This share ranged from a high of 15.6% in Poland down to a low of 4.6% in Cyprus. In a majority (20) of the EU Member States, family/children accounted for the third highest level of expenditure among the 6 different functions that are shown in Table 1 (behind old age and survivors and sickness/health care).
The average share of disability benefits within the total expenditure on social protection benefits was 7.0% across the whole of the EU, while in 5 of the EU Member States the disability function accounted for the third highest level of expenditure among the 6 different functions that are shown in Table 1.
The share of EU expenditure on unemployment benefits on total social protection benefits equated to 4.1% in 2022. This share ranged from 6.5% in Spain to 0.9% in Poland, with a low of 0.4% recorded in Romania. Only in Spain expenditure on unemployment accounted for the third highest level of total expenditure on social protection benefits among the 6 different functions shown in Table 1 (behind old age and survivors and sickness/health care).
In addition, 3.9% of the EU's expenditure on social protection benefits in 2022 was accounted for by housing and social exclusion. The relative weight of housing and social exclusion in total expenditure on social protection benefits was considerably higher in the Netherlands (6.7%), Denmark (6.6%) and Finland (6.2%). By contrast, in Portugal, Bulgaria, Slovakia and Estonia less than 1.5% of total expenditure on social protection benefits was used for housing and social exclusion.
Developments for social protection benefits in constant prices
The development of EU expenditure on social protection benefits in constant prices over the period covering 2012-2022 reveals that total expenditure on all functions rose, on average, by 1.6% per year. See Table 2, which presents data using constant 2015 prices. In other words, changes in expenditure are presented in real terms.
Only in 1 EU Member State, namely Greece, did total expenditure on social protection benefits fall during the period under consideration, on average by 0.6% per year, while in the Netherlands there was the smallest increase (0.6% per year). By contrast, the highest growth rate between 2012 and 2022 was registered in Romania, where expenditure on social protection benefits rose by an average of 5.1% per year in real terms; the next highest rates of change were recorded in Poland (5.0% per year), Malta, Bulgaria and Latvia (all 4.9% per year).
Between 2012 and 2022, EU expenditure on housing and social exclusion rose by an average of 3.7% per year
The various developments observed over time in relation to expenditure on the different social protection functions reflect a range of issues, including: the overall health of each economy, changes in the level of demand for specific benefits, demographic developments, and the focus/aim of political reforms with respect to social protection legislation.
Across the whole of the EU, the highest growth rate for expenditure on social protection benefits during the period 2012-2022 was recorded for housing and social exclusion, where expenditure rose, on average, by 3.7% per year. The next highest rates of change were recorded for the family/children function (2.3% per year) and for the sickness/health care function (2.2% per year). By contrast, the unemployment function showed a negative average growth rate (-2.2% per year). The largest increase in expenditure for housing and social exclusion was registered by Italy (25.8% per year), while Poland recorded the highest growth for the family/children function (13.3% per year) and Cyprus for the sickness/health care function (10.5% per year). Belgium showed the largest decrease for the unemployment function (-9.7% per year), followed by Ireland (-8.5% per year).
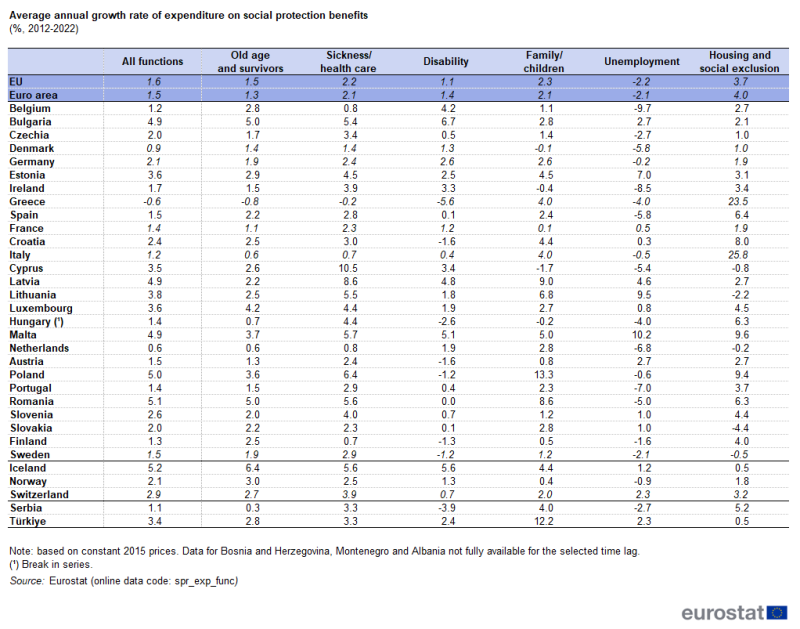
(%)
Source: Eurostat (spr_exp_func)
Social protection benefits in cash and in kind
Expenditure on social protection benefits can take a variety of different forms in terms of its delivery. Payments may be made in cash, paid out either at regular intervals or as lump sums, or alternatively may take the form of benefits in kind. In a similar vein, some governments choose to target certain benefits by making them means-tested (dependent upon different income levels), whereas other payments might be made to the whole of a (sub)population, for example, a winter fuel allowance (for heating) paid to all elderly persons.
Figure 3 shows that in 2022 almost two-thirds (64.5%) of the total expenditure on social protection benefits in the EU were made in the form of cash payments. The share of cash benefits in total expenditure on social protection benefits peaked at 76.4% in Greece and at 76.2% in Italy, while cash benefits also accounted for more than 70% of total expenditure in Poland (72.9%) and Romania (70.8%). At the other end of the range, cash benefits accounted for less than 60% of the total expenditure on social protection benefits in Finland (58.5%), Malta (58.4%), Denmark (55.9%), Sweden (53.5%) and Ireland (52.9%).
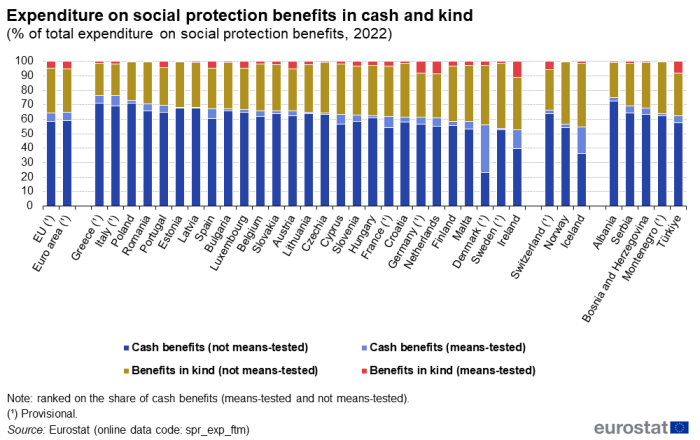
(% of total expenditure on social protection benefits)
Source: Eurostat (spr_exp_ftm)
Across the whole of the EU, the ratio between means-tested and non means-tested cash benefits was heavily skewed in favour of the latter. In 2022, the value of cash benefits that were not means-tested was about 9 times as high as that for cash benefits that were means-tested. The general pattern of less means-tested benefits than not means-tested benefits was repeated in all of the EU Member States and was particularly notable among the Baltic Member States, as well as in Poland, Czechia, Bulgaria and Sweden.
In 2022, more than one-third (35.5%) of the total expenditure on social protection benefits in the EU was composed of benefits in kind. The vast majority of these were made up of not means-tested benefits in kind (30.9% of total expenditure), leaving 4.6% attributed to means-tested benefits in kind. The level of expenditure on not means-tested benefits in kind was systematically higher than the level of expenditure on means-tested benefits in kind in each of the EU Member States.
Means-tested benefits
Across the EU, means-tested benefits accounted for 10.8% of all expenditure on social protection benefits in 2022. A relatively high share of this expenditure was made in relation to the housing and social exclusion function (note that housing benefits are exclusively means-tested). Among the EU Member States, the share of means-tested benefits in total expenditure on social protection benefits reached a high of 35.6% in Denmark, while a relatively high share was also recorded in Ireland (24.0%); their shares were considerably higher than in the remaining Member States, as the third highest share was 14.8%, recorded in the Netherlands. At the other end of the range, means-tested benefits accounted for less than 3.0% of the total expenditure on social protection benefits in 6 Member States, with the lowest shares recorded in Latvia (1.2%) and Estonia (1.0%).
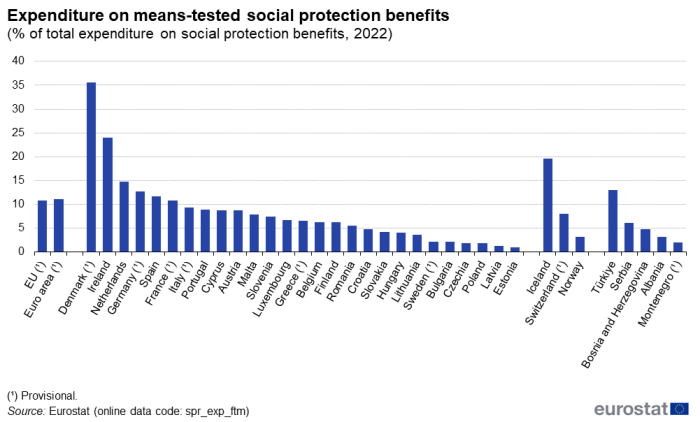
(% of total expenditure on social protection benefits)
Source: Eurostat (spr_exp_ftm)
Source data for tables and graphs
Data sources
The statistics presented in this article were collected from national statistical authorities and/or ministries of social affairs. Most of the data were compiled from administrative sources. For more detailed information, please refer to:
- consolidated quality reports on social protection statistics;
- qualitative information;
- national quality reports on the ESSPROS core system.
The European system of integrated social protection statistics (ESSPROS) was jointly developed in the late 1970s by Eurostat and representatives of the EU Member States in response to the need for a specific statistical instrument for the observation of social protection issues.
ESSPROS is a common framework which enables international comparisons of administrative data on national social protection systems. It provides a coherent comparison of social protection benefits for households and their financing across European countries.
ESSPROS is composed of a core system and a set of modules. The modules contain supplementary statistical information on particular aspects of social protection, essentially they relate to the number of beneficiaries of social protection pensions and to net social protection benefits. On the other hand, the core system contains data that have been collected by Eurostat since 1990, namely:
- quantitative data — social protection expenditure and receipts by scheme (a distinct body of rules, supported by one or more institutional units, governing the provision of social protection benefits and their financing);
- qualitative data — metadata for the different schemes and detailed social protection benefits.
The receipts for social protection schemes may be classified according to type and origin:
- the type gives the nature of, or the reason for, a payment — social contributions, general government contributions, transfers from other schemes, and other receipts;
- the origin specifies the institutional sector from which the payment is received — all resident institutional units (corporations, general government, households, non-profit institutions serving households) and the rest of the world.
The expenditure of social protection is classified by type, indicating the nature of, or the reason for, the expenditure:
- social protection benefits;
- administrative costs;
- transfers to other schemes; and,
- other expenditure.
Social protection benefits are transfers to households, in cash or in kind, that are designed/intended to relieve households of the financial burden of a number of different risks/needs that are classified as functions. The following list of functions is identified within ESSPROS:
- old age and survivors;
- sickness/health care;
- disability;
- family/children;
- unemployment;
- housing;
- social exclusion.
Tables in this article use the following notation:
| Value in italics | data value is forecasted, provisional or estimated and is therefore likely to change; |
| : | not available, confidential or unreliable value; |
Context
The organisation and financing of social protection systems is the responsibility of each of the EU Member States. The models used in the Member States are therefore somewhat different from each other. The EU institutions play a coordinating role to ensure that people who move across borders continue to receive adequate protection; they seek to promote actions among the Member States to combat poverty and social exclusion as well as to reform social protection systems on the basis of policy exchanges and mutual learning. The main policy framework in the field of EU social protection is the European pillar of social rights. The pillar contains 3 main categories for action, one of which concerns social protection and inclusion.
Explore further
Other articles
- Disability statistics — online publication
- Social protection statistics — early estimates
- Social protection statistics — overview
- Social protection statistics — background
- Social protection statistics — family and children benefits
- Social protection statistics — unemployment benefits
- Social protection statistics — pension expenditure and pension beneficiaries
Database
- Social protection (spr), see:
- Social protection expenditure (spr_exp)
- Social protection receipts (spr_rec)
- Pensions beneficiaries (spr_pens)
- Net social protection benefits (spr_net_ben)
Thematic section
Publications
- EU pensions amount to 12.9% of GDP in 2021 — Eurostat news — 11 June 2024
- EU family benefits in 2021 reached €777 per person — Eurostat news — 11 May 2024
- Sickness and healthcare expenditure down in 2022 — Eurostat news — 11 November 2023
- Social protection expenditure: 2021 early estimates — Eurostat news — 11 November 2022
- Looking at the lives of older people in the EU — Eurostat news — 1 October 2021
- How much is spent on disability benefits in the EU? — Eurostat news — 3 December 2020
- How much is spent on family benefits in the EU? — Eurostat news — 1 June 2020
Selected datasets
Methodology
- Social protection methodology
- Social protection (ESMS metadata file — spr_esms)
External links
- Mutual information system on social protection (MISSOC) — Directorate-General for Employment, Social Affairs and Inclusion
- Social protection and social inclusion — Directorate-General for Employment, Social Affairs and Inclusion
Legislation
- Regulation (EC) No 458/2007 of the European Parliament and of the Council of 25 April 2007 on the European system of integrated social protection statistics (Summary)
- Regulation (EC) No 1322/2007 on appropriate formats for transmission, results to be transmitted and criteria for measuring quality for the ESSPROS core system and the module on pension beneficiaries of 12 November 2007
- Regulation (EC) No 10/2008 of 8 January 2008 on definitions, detailed classifications and updating of the rules for dissemination for the ESSPROS core system and the module on pension beneficiaries

