Data extracted on 04 May 2025.
Planned article update: May 2026.
Highlights
Production of crude oil continued to decline in the EU reaching a new record low in 2023.
In 2023, imports of oil and petroleum products from Russia decreased by 83.75%. This decrease was compensated by increased imports from United States, Norway and Kazakhstan.
Production of petroleum products, EU, 1990-2023
This article provides an overview of oil statistics covering crude oil as well as petroleum products. Energy statistics are available for all 27 EU EU countries and several non-EU countries. Data cover the period 1990 to 2023.
For decades, crude oil and petroleum products have the largest share in gross inland energy consumption in the EU. Despite decreasing production and fluctuating consumption through the years, crude oil and its derived products still play a major role. In recent times, many EU policies are starting to affect this large domain of the energy market, a domain which in 2022 registered some normalisation after having been heavily shocked in 2020 by the sudden impact of the COVID-19 pandemic restrictions. In 2023 the domain was influenced again by external factors, the Russian invasion of Ukraine, but to a lesser extent than COVID-19 restrictions.
Production of crude oil
The production of crude oil in 2023 in the European Union (EU) continued decreasing and in 2023 reached its lowest point at 15.5 million tonnes (Mt). This is new record low in production after the drop in demand in 2020. The drop in production was not influenced by the significant increase in crude oil prices caused by the Russian aggression in Ukraine. Crude oil production peaked in 2004 at 41.7 Mt. The top oil producers in the EU in 2023 were Italy (4.2 Mt), Denmark (2.9 Mt), and Romania (2.9 Mt). These data are presented in Figure 1.
In Norway — one of the key European non-EU crude oil producers — production peaked in 2001 (157.6 Mt). In the following years, Norwegian production fluctuated and in 2019 it reached a record low (70.0 Mt) and then increased again reaching 89.8 Mt in 2023. The EU candidate countries Turkey, Serbia, and Albania have some production of crude oil, however on a rather small scale (totaling nearly 5.5 Mt in 2023).
Imports of crude oil
In 2023, total imports of crude oil to the EU amounted to 471.5 Mt. This represents a considerable decrease of 1.7 pp from the 2022 level, but 5.6 pp higher than in 2020, which was lowest value in the 31 years time series starting in 1990. Import of crude oil in 2023 was still lower than before COVID-19, in 2019 import was 507.2 Mt. Most imports came from the USA (67.2 Mt), Norway (65.6 Mt), Kazakhstan (44.6.6 Mt) and Iraq (35.8 Mt). The origins of crude oil imported to the EU have changed considerably due to the Russian invasion of Ukraine. In May 2022, the European Commission implemented the REPowerEU plan to reduce its dependency on Russian fossil fuels. In 2022, imports of oil and petroleum products from Russia decreased by 24.6 Mt and in 2023, they decreased by 74.1 Mt, which represents a decrease by 83.75 pp. Imports from Russia has been declining since their last peak in 2005 (184.7 Mt), but in 2023 that decline was particularly sharp. The decrease of crude oil import from Russia was compensated by increased imports from the United States (+18.9 Mt), Norway(+11.5 Mt) and Kazakhstan (+8.4 Mt). In recent years imports from Norway are gradually increasing. In 2023, they increased by 21.3 percentage points (pp) compared with the previous year. Imports of crude oil from the USA were historically almost irrelevant but have been increasing sharply in the last few years. They jumped 33.6 pp in 2020, another 28.5 pp in 2022 and again by 39.1 pp in 2023 reaching the record high and making this country the top provider to the EU. Import from Kazakhstan, which had been gaining ground in recent years, increased by 21.9 pp in 2023.

Source: Eurostat (nrg_ti_oil)
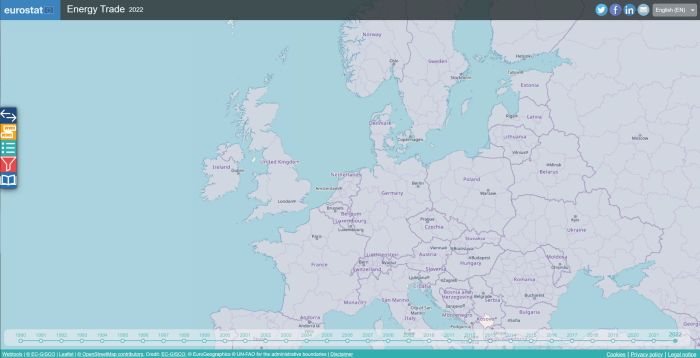
EU countries import their crude oil from different origins depending on several factors such as prices, contracts, OPEC decisions, international situations, transportation costs, and more. See the interactive map of imports of crude oil to EU countries by origin.

Tool 1: Energy trade visualisation
Imports of crude oil by country and origin, 1990-2023
(million tonnes) Source: Eurostat (nrg_ti_oil)
Production of petroleum products
In 2023, the EU refineries produced 537.4 million tonnes of oil equivalent (Mtoe) of petroleum products. This represented a drop of 1.3% from the previous year. In 2020, the lowest quantity ever produced (since the beginning of the time series in 1990) was recorded (504.5 Mtoe) as the production dropped largely due to the COVID-19 related restrictions to movements. Production had previously peaked in 1998 (645.39 Mtoe) and in 2006 (642.2 Mtoe).
In 2023, the biggest producer was Germany (89.5 Mtoe), followed by Italy (72.0 Mtoe), Spain (62.6 Mtoe) and Netherlands (62.4 Mtoe).
In 2023, the EU produced mostly gas/diesel oil (214.4 Mtoe), followed by motor gasoline (101.8 Mtoe), fuel oil (52.4 Mtoe) and naphtha (42.4 Mtoe). Figure 5 below gives further details.
Trade in petroleum products
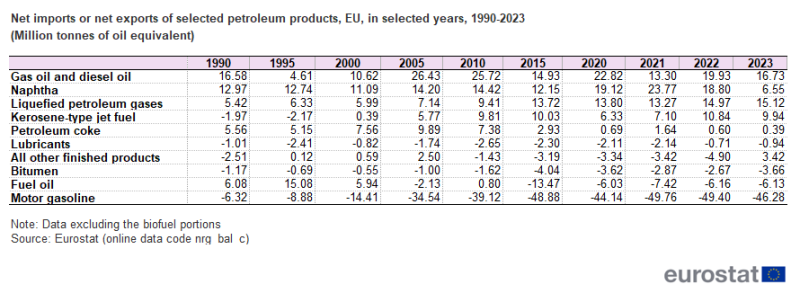
Imports of crude oil are by far the most important component of trade in oil statistics, yet the EU also trades manufactured petroleum products some of which are mostly imported while others are mostly exported. In 2022, the largest net imports from non-EU countries were for gas/diesel oil (16.7 Mtoe), liquefied petroleum gases (15.12 Mtoe) and Kerosene-type jet fuel(9.9 Mtoe). EU had net exports mostly of motor gasoline (46.3 Mtoe) and fuel oil (6.1 Mtoe). See Table 1 for more details on the trade of petroleum products.

Source: Eurostat (nrg_bal_c)
Oil imports dependency
Import dependency on oil is calculated as the ratio of net imports (imports minus exports) to gross available energy of crude oil and petroleum products. Positive values indicate an import dependency, while negative values indicate a net exporter country. If positive values are above 100%, it means that imports surpass the needs of a country and that consequently stocks are being built up. Import dependency can be calculated for an aggregate of products or for just one fuel. The import dependency for the entire family of crude oil and petroleum products reached a record high in 2020 when the EU relied on net imports for 96.8% of its energy availability but dropped to 91.7% in 2021 marking the lowest value in 22 years. In 2023, the EU’s import dependency was 94.8% which is 2.9% lower compared to 2022. The drop observed in 2021 was compensated. The dependency on foreign oil had been slowly growing from the lower rates observed in previous decades and from a minimum observed in 1999 (91.66%).
The import dependency rate for crude oil, an essential commodity for the petrochemical industry and the production of transport fuels, was the highest of all major energy products (fossil and non-fossil). In 2022 increased to 97.6%, reaching the highest value recorded. The change in dependency in the last year was the result of a increase in imports (+7.4 pp) by far the most important variable in this indicator, and a slightly smaller increase in gross available energy (+5.0 pp). Other variables such as primary production and exports decreased (-7.4 pp and -2.9 pp respectively) however, they have a very minor influence given their comparatively low levels. The increase in dependency was also slightly influenced by the replenishing of the stock drawn in 2021. The stock build up of of 4.4 Mtoe of crude oil, was equivalent to only 0.9% of the gross available energy.
Final consumption in the EU and in EU countries
In 2023, the final consumption of oil and petroleum products for energy and non-energy purposes in the EU countries decreased by 0.6% to 387.2 Mtoe. The lowest level ever recorded in the 31 years time series was in 2020. The consumption had already decreased from the peak of 2001 (492.9 Mtoe) to a low point in 2015 (406.4 Mtoe) yet, before the shock of the restrictions, it was increasing again. In 2021, the value started normalising overall but with changes in different directions in the various EU countries. In 2023, the highest increase was recorded in Croatia (+11.7 pp), Romania (+5.9 pp) and Sweden (+4.7 pp) while decreased more evidently in Germany (-10.1 pp), Slovenia (6.5 pp) and Austria (-5.1 pp). EU countries have different energy and non-energy consumption patterns of oil and petroleum products, which are influenced by the size and structure of their economies. In 2022, Germany held the lead with a 19.6% share of the total final EU consumption, followed by France (15.8%), Italy (10.9%) and Spain (10.6%).
Final consumption of petroleum products for energy use
In the EU, the final energy consumption of oil and petroleum products (excluding international shipping and aviation) was still recovering in 2023 from the slump registered in 2020 (309.7 Mtoe) when transport fossil fuels were clearly the hit by the limitations to people's movements, reaching 326.6 Mtoe. Compared to year 2020 the increase was at 5.4%. Gas/diesel oil had been growing since the lowest value of the beginning of the time series (193.0 Mtoe) in 1990, to its highest peak in 2006 (254.7 Mtoe). Recently, it was regaining ground from the drop to 227.8 Mtoe in 2014. In 2020, however it fell to 217.5 Mtoe, but increased to 226.1 Mtoe in 2022. In 2023, it fell by 3.6% to 218.8 Mtoe compared to 2022. Gasoline consumption had significantly decreased from the 1998 high (115.5 Mtoe) to its previously lowest value in 2017 (66.1 Mtoe) and was slowly increasing in recent years. In 2023 it increased to 70.3 Mtoe. Gas/diesel oil and gasoline are by far the two most important products throughout the whole 33 years period, yet only other kerosene showed relevant changes in 2023. The trend of the final energy consumption of individual petroleum products is shown in Figure 7.

Source: Eurostat (nrg_bal_c)
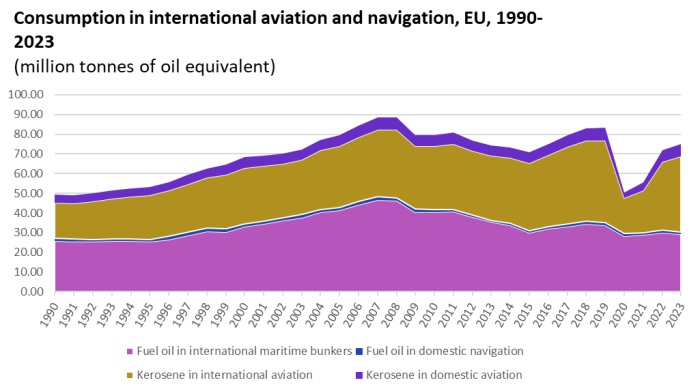
Kerosene-type jet fuel used in aviation which increased enormously (+57.2 pp) to 44.4 Mtoe. This fuel had been increasing since 1990 (22.2 Mtoe) and in 2019, it had reached an absolute high: 48.2 Mtoe however, the cancellation of most flights in 2020 had led to the decrease of -56.4 pp from the previous year to the lowest level ever recorded. In 2023 the use of kerosene-type jet fuel, although it increased enormously, is still -7.9 pp lower than the value recorded in 2019. In 2023, 86.2% of this fuel was used in international aviation while 13.8% was consumed for domestic fights, such split is rather stable through the years Fuel oil used in navigation is declining, since the maximum recorded in 2007 (46.6 Mtoe), due to regulatory and market changes. In 2023, the value decreased by 2.8% compared to 2022. The largest portion of this fuel was used for international voyages (96.3%), the rest for domestic shipping (3.7%).

Source: Eurostat (nrg_bal_c)
Consumption in sectors
In 2023, the vast majority of sectors showed little changes compared to the previous year. The air transport continued recovery from the contraction in consumption experienced in 2020 and doubled in 2023. On the other hand, households sectors recorded a decrease by -10.4 pp. The consumption in the industry sector also decreased for non-energy use (-7.9 pp) and (-0.5 pp) for energy use. Households sector marked an increase in consumption (+4.7 pp), but the energy usage is still considerably below levels recorded in 2019 and 2020. The share of consumption of petroleum products by sector is shown in Figure 9. Road transport was a key consumer with 47.6%, while air and water transport used 8.8% and 8.4% respectively. Industry was the second sector with a 16.4% share which includes non-energy consumption (11.6%) such as bitumen for road surfaces, the use of lubricants for reducing friction as well as the use of oil products in the petrochemical industry for their chemical properties rather than for their energy content. In these cases they are transformed in other products (such as plastics, detergents and tires for example) rather than combusted for energy. Households and the energy sector had shares of 4.7% and 5.3% respectively.
Fuels in road transport
In 2023, road transport was dominated by gas/diesel oil (63.7%) and motor gasoline (26.2%). LPG covered a small portion of the consumption in this sector with a 2.1% share and its usage varied greatly among countries. Other fuels are starting to cover some of the needs in the road transport sector thanks to important EU policies, technological development and changes in consumer choices. In 2023, the EU had a share of actual consumption of 6.7% for renewables and biofuels. Lastly, despite increase electricity still played a minor role in road transport (0.5%).
Source data for tables and graphs
Data sources
Data on energy are submitted on the basis of an internationally agreed methodology in joint annual energy questionnaires (Eurostat - OECD/IEA - UNECE). Data are available for all EU Member States and the methodology is harmonised for all reporting countries. Consequently, data comparability across countries is very high. Data may be ratified due to resubmission to increase quality, changes are normally minimal. To view the latest data please visit our website.
Context
Crude oil and petroleum products have the highest share of energy consumption in the EU, yet the situation is slowly evolving. There is a long-term decreasing trend in the demand in the EU which is due to several aspects including structural changes in the economy, more efficient use of oil products, and other technical changes such as the switch from gasoline to diesel. In recent years, several EU policies and initiatives are tackling the security of energy supplies as well as the environmental and climate aspects of oil production and consumption. These are incentivising energy efficiency, supporting the transition to biofuels and electricity transport, and helping the research and development of new fuels, such as hydrogen.
Explore further
Other articles
Database
- Energy statistics - quantities, annual data (nrg_quant)
Thematic section
Publications
Selected datasets
- Energy statistics - main indicators (t_nrg_indic)
- Energy statistics - quantities (t_nrg_quant)


