Data extracted in January 2025
Planned article update: January 2028
Highlights
In 2020, 10.1% of households in the EU were in the lowest quintiles of both income and consumption expenditure distributions. These households received 3.6% of the total disposable income, spent 4.0% of consumption expenditure and accumulated 4.1% of total net wealth in 2020.

Source: Eurostat (icw_res_01)
This article presents indicators compiled from a joint dataset that is constructed using statistical matching of microdata from household income, consumption expenditure and wealth surveys (see Statistics Explained article on methodological issues). The indicators are presented with reference years 'around 2010', 'around 2015' and 'around 2020'[1] because the source data from the countries spread over 3 years around these years. The joint datasets for Italy for all 3 reference years and for the Netherlands for 'around 2010' were not available due to partly missing consumption expenditure data. Moreover, no consumption expenditure data for Sweden were available for the 'around 2020' reference year. The indicators for those reference yeas were therefore not available for the analysis in this article. Due to the lack of national data, consumption expenditure for Cyprus, France and Malta for 'around 2020' were extrapolated from the 'around 2015' data with HICP based deflators.
Income, consumption and wealth inequalities
Saving disparities
In order to understand the dynamics of wealth inequality, it is essential to describe the process of asset accumulation and therefore saving behaviours. Saving flows may be defined as the residual between income and consumption, i.e. what is left from income at the end of the period after expenditures for consumption. If income is higher than consumption, this residual is invested in (financial or real) assets and will constitute a part of the wealth held by a household. If consumption expenditure is higher than income, the household will have to finance its consumption not only from income, but also by contracting debt or selling assets.
The fact that a household cannot finance its consumption entirely from its income may be a good indication of financial difficulties. As shown in Figure 1, the proportion of households whose yearly expenditures are higher than their income ('dissaving households') varies greatly across countries, although this indicator must be interpreted with caution, as it may be affected by significant measurement errors. Similarly, a saving rate close to zero suggests that the household is unable to save and is more likely to restrict its expenditures, thereby risking not being able to meet all its needs. Saving rates are computed by dividing savings (the difference between total disposable income and total consumption at the end of year X) by the total disposable income of the household during the same year.

Source: Eurostat (icw_pov_03).
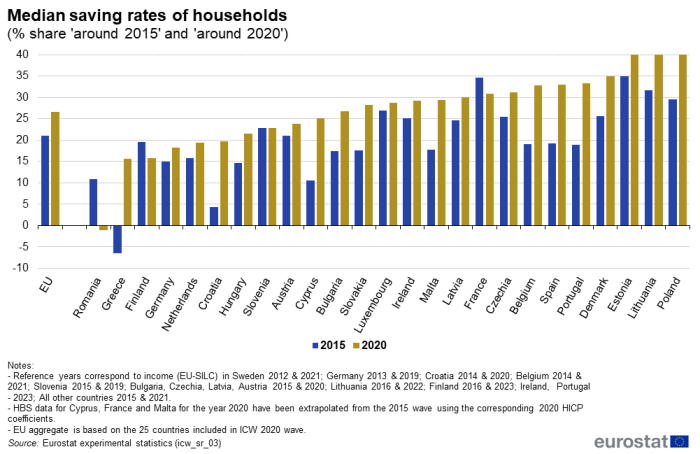
The median household saving rate (when households are ranked according to their saving rates, half are above this rate and half are below) can be looked at as another distributional indicator. In 'around 2020', for example, half of all households in the EU were able to save over 26% of their annual income (up from 21% in 'around 2015'). This trend is reflected in most countries, apart from a few exceptions, such as Finland and France where 'around 2020' saving rates dropped compared with 'around 2015' results, and Romania, where the situation of households was even more difficult, as over half of the households could not fully fund their expenditure with own income (Figure 2).

Source: Eurostat (icw_sr_03).
Inequality in households' income, consumption, savings and wealth
The gini coefficient is the most common indicator used to measure income inequality, wealth inequality or consumption inequality within a group, where 0 expresses perfect equality, meaning that everyone has the same economic resources, and 100 represents complete inequality, with all the resources belonging to only 1 person or household. Wealth is in general far more unevenly distributed than income or consumption. Figure 3 shows the Gini coefficients for households' income, consumption expenditures, savings and wealth for EU countries in 'around 2020'. The coefficients range between 27 and 41 for consumption expenditures and between 29 and 47 for income across available countries. For the other 2 variables, the distribution is less equal with the Gini coefficients varying across countries between 46 and 72 for wealth and between 49 and 78 for savings.

Source: Eurostat (icw_sr_05)
Interplay between indicators
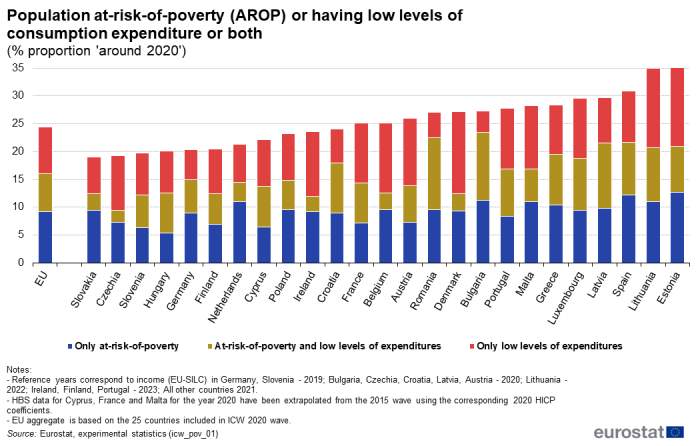
Apart from the accounting exercise of computing savings from income and consumption at household level, it is also interesting to focus on the interplay between the various indicators of vulnerability described above. In particular, individuals who are poor according to the usual income-based definition and at the same time vulnerable with respect to their consumption expenditure levels may be of interest, as they combine several dimensions of poverty. Figure 4 shows the intersection between the at-risk-of-poverty (AROP) indicator and the indicator based on consumption expenditures; the dark gold coloured segment shows the estimated proportion of the population affected by both types of vulnerability. In 'around 2020', share of income-poor population as measured by AROP for the EU was around 7%, exceeding 10% for 3 EU countries (Romania, Latvia and Bulgaria). Observing how the proportion of vulnerable people changes when taking account of consumption, about 24% of the EU population was either at risk of poverty due to low income or had low levels of consumption expenditure in 'around 2020'. At national level, in 12 countries, 1 person in 4 was either income or expenditure poor, while in Luxembourg, Latvia, Spain, Lithuania and Estonia this was almost 1 in 3.

Source: Eurostat (icw_pov_01).
The data showed that only a small proportion of households were 'dissaving' and had low levels of consumption expenditure at the same time (see Figure 5), i.e. their consumption expenditure was not below 60% of the median consumption expenditure the total households in their country although their income was lower than their consumption expenditure. In 'around 2020', the share of households in the EU facing a combination of the 2 types of vulnerability was 2.1%. The highest shares were observed for Romania (7.5%), Croatia (4.3%), Latvia (3.2%) and Spain (3.1%), while for all other EU countries they were 3% or below.

Source: Eurostat (icw_pov_04).
Consumption expenditures by income
The joint dataset of households' income and consumption may be used to show distributions of median consumption expenditure over different income groups (Figure 6). A steep increase in consumption expenditure with available income is observed, which is particularly pronounced at the top of the distribution in most countries.

Source: Eurostat (icw_sr_06).
The aggregate propensity to consume is defined as the percentage of income spent on average on goods and services. It is derived by using the national accounts approach for the household sector, in which all household income and consumption flows are aggregated at national level. The aggregate consumption expenditure is divided by the aggregate income. The complement of the aggregate propensity to consume is the aggregate saving rate, which reflects the saving behaviour of the population as a whole. Figure 7 demonstrates how lower income groups have to spend a considerably higher part of their income on goods and services than higher income groups, thereby preventing them from saving part of their income, or even dissaving as is the case for the first income quintile in almost all EU countries.

Source: Eurostat (icw_sr_10).
Saving behaviours
The role of life cycle
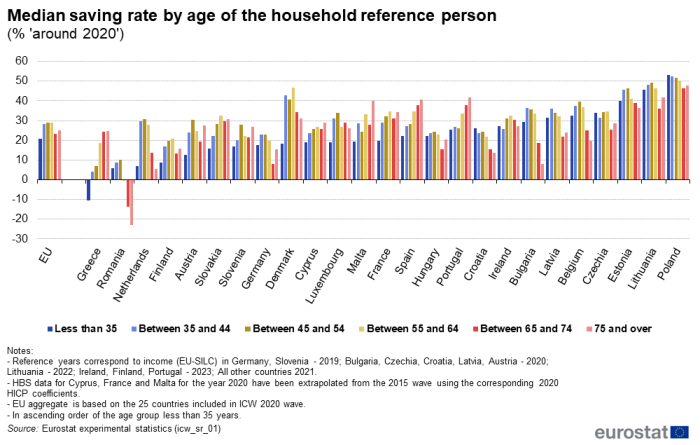
People's saving behaviour may vary over their lifetime, as they tend to adjust their consumption in order to smooth out income variations. In particular, younger and older people will tend to have lower saving rates, since they are generally earning less than they will earn on average over their lifetime. At EU level, the joint dataset reflects this behaviour well (Figure 8). Furthermore, households with a reference person below 35 years of age, more often save less than households whose main earner is older. Yet, there is considerable variation across countries, and for example, the decrease of saving rates after retirement (age groups 65+), does not occur in about one-third of the countries.

Source: Eurostat (icw_sr_01).
Household structure and vulnerability
Saving behaviour is also linked to household structure. The data show that, in most countries, a single parent with children is more likely to have a low saving rate. However, the situation varies considerably across the EU (see Figure 9).
Income and savings
Saving rates increase with income, i.e. the share of income not used for consumption increases with income (see Figure 10). The median saving rate for the first income quintile (the 20% of households with the lowest income) for the EU in 2020 was -3% reflecting well the overall situation in the EU countries, where only 10 countries showed positive saving rates: Poland, Cyprus, Estonia, France, Lithuania, Portugal, Czechia, Slovenia, Latvia, and Hungary. By contrast, Romania (-62.3%), the Netherlands (-28.8%), Greece (-15.7%) and Austria ( 15.2%), showed the most pronounced negative saving rates for households belonging to the bottom income quintile. For Romania, even the median household in the second and the third income quintiles recorded a negative saving rate. Highest median saving rates are attained for all countries in the last income quintile (the 20% of households with the highest income). The difference in saving rates of households in the lowest and the highest income quintile for the EU was about 49 percentage points (pp), exceeding 60 pp for Romania, the Netherlands, Denmark and Spain.

Source: Eurostat (icw_sr_03).
Feedback
To help Eurostat improve these experimental statistics, users and researchers are kindly invited to give us their feedback by email
Source data for tables and graphs
Data sources
The income data for the joint dataset used in this article comes from the EU statistics on income and living conditions (EU-SILC), governed by Regulation 1700/2019 (more information on the legal framework can be found in the legislation part of the thematic section on income and living conditions statistics at Eurostat's web page). The consumption expenditure data is from the Household Budget Survey (HBS). Information on assets and liabilities is from the Household Finance and Consumption Survey (HFCS). The HFCS is run by National Central Banks and coordinated by the European Central Bank. The EU-SILC, HBS and HFCS data are matched according to the year of reference for HBS to obtain a fused dataset containing household-level information on both income and consumption. For more details on the statistical matching and the methodology used in the data, please see Statistics Explained article Joint distribution of household income, consumption and wealth - methodological issues.
Footnotes
- Exact reference years of ICW data are reported here: https://ec.europa.eu/eurostat/statistics-explained/index.php?title=File:Table1_HBS-HFCS_reference_years.png ↑
Explore further
Other articles
Database
- Household economic resources (icw_res)
- Saving rates (icw_sr)
- Poverty (icw_pov)
Thematic section
Publications
Statistical books
Others
- Törmälehto V.-M., Kannas O., Säylä M., Integrated measurement of household-level income, wealth and non-monetary well-being in Finland, 32nd General Conference of the International Association for Research in Income and Wealth, 2012.
- Eurosystem Household Finance and Consumption Network, Eurosystem Household Finance and Consumption Survey-Results from the First Wave, 2012.
- Lequiller F., Blades D., Understanding National Accounts, OECD Publishing, 2014.
- Balestra C., Oehler F. Measuring the joint distribution of household income, consumption and wealth at the micro level - Methodological issues and experimental results, 2023.
External links
Legislation
- Regulation (EC) No 1177/2003 of 16 June 2003 concerning Community statistics on income and living conditions (EU-SILC)
- Summaries of EU Legislation: EU statistics on income and living conditions
- Regulation (EC) No 1553/2005 of 7 September 2005 amending Regulation 1177/2003 concerning Community statistics on income and living conditions (EU-SILC)
- Regulation (EC) No 1791/2006 of 20 November 2006 adapting certain Regulations and Decisions in the fields of ... statistics, ..., by reason of the accession of Bulgaria and Romania

