Archive:EU trade with the Common Market for Eastern and Southern Africa (COMESA)
This Statistics Explained article is outdated and has been archived - for recent articles on non-EU countries see here.
- Data extracted in April 2015. Most recent data: Further Eurostat information, Main tables and Database.
This article analyses recent statistics on trade in goods and services between the European Union (EU) and the Common Market for Eastern and Southern Africa (COMESA).
Within Africa, COMESA is an important trading partner of the EU-28, in particular for mineral fuels. In 2014, COMESA countries accounted for 18 % of EU-28 imports from Africa and 20 % of exports to Africa. Egypt is by far the largest market for EU-28 exports to COMESA, taking well over half of the total in 2014. Machinery and transport equipment remained the largest EU-28 export category to the COMESA countries, making up 35 % of the total in 2014. Despite the impact of recent events, Libya remained the largest source of EU-28 imports from COMESA, with 44 % of the total and Egypt was the second largest source with 30 %. Mineral fuel was COMESA’s largest export to the EU-28, accounting for 62 % of the total in 2014. In 2012, Egypt was by far the country with the largest trade in services with the EU-28 in the COMESA group. Its large and thriving tourist industry created a net deficit for the EU-28 of EUR 2.3 billion in 2012. Two other major tourist destinations, Mauritius and the Seychelles, also produced a deficit for the EU-28 in service sector trade.
Main statistical findings
The main partners: Egypt and Libya
In the decade since 2001, COMESA's population has grown dynamically with an annual average growth rate over 2 %, a very similar rate to Africa's as a whole. Throughout the period, COMESA accounted for a little over 43 % of total African population (Table 1).
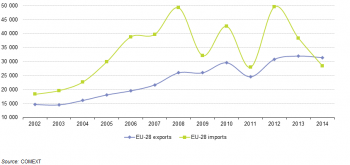
As can be seen in Figure 1, 2014 was the first year where the EU had a positive trade balance with COMESA (EUR 2.9 billion) since 2002.
Commercial exchanges between the EU-28 and COMESA varied significantly over the last decade. Although in 2011 the trade between these two blocks of countries slowed down (mostly due to the instability in Egypt and Libya, the main trading partners), in 2012 it picked up again to exceed the levels of 2010. The EU trade deficit reached EUR 18.7 billion in 2012. Over the following two years the reduction in EU imports has led to a trade surplus of EUR 2.9 billion for the EU in 2014 (for the first time since 2002) .
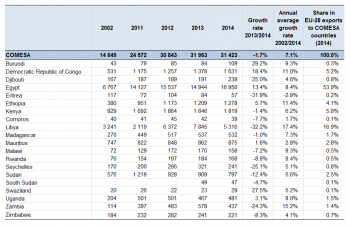
Until 2014, the average annual growth rate in EU-28 exports to the COMESA countries since 2002 was 7.1 %, while for Africa as a whole, it averaged 7.6 %. EU-28 exports to the COMESA countries between 2013 and 2014 fell by 1.7 %, a drop that reversed the tendency from the beginning of the century.
Table 2 shows that in 2014, Libya and Egypt were the largest trade partners among the COMESA countries, the two representing over 70 % of the EU exports to COMESA (54 % and 17 % respectively of total EU exports to COMESA). From 2002 to 2014 EU-28 exports to Egypt more than doubled, from EUR 6.7 billion to EUR 17.0 billion. EU-28 exports to Libya decreased in 2011 (to EUR 2.1 billion) compared with the 2002 figure, while in 2012 and 2013 there were substantial increases to EUR 6.4 billion and EUR 7.9 billion respectively. In 2014 there was a 32 % decrease in exports to Libya, to EUR 5.3 billion.
COMESA countries, with the exception of Eritrea, all showed a positive annual average growth rate for EU-28 exports from 2002 until 2014. The highest annual average growth rates were recorded in Libya (+17 %), followed by Zambia (+15 %), the Democratic Republic of Congo and Ethiopia (both 11 %).
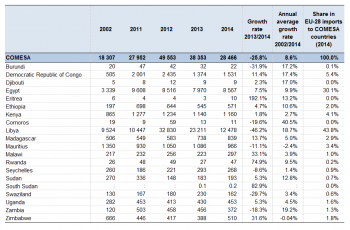
Political changes in Egypt and Libya had an even more marked impact on the import side of trade. As Table 3 shows, EU-28 imports from COMESA countries have been very erratic in recent years. In 2011, they were valued at EUR 28 billion, before rising to just under EUR 50 billion in 2012 and then dropping in the next two years to EUR 38 billion and EUR 28 billion.
Much of this variation is explained by changes in imports from Libya, the EU-28’s major COMESA import partner. EU imports from Libya almost halved (-46 %) from 2013 to 2014. In spite of these reductions, imports from COMESA countries have grown at an annual average rate of 8.6 % between 2002 and 2014. With the exception of Mauritius and Zimbabwe, all other COMESA countries showed a positive annual average growth rate.
EU-28 imports from COMESA increased by 55 % from 2002 to 2014. Libya and Egypt also stood out on the import side of EU trade with COMESA. In 2014, Libya was the leading trade partner with 44 % of EU imports, and Egypt recorded a share of 30 %.
Aside from Libya and Egypt, the Democratic Republic of Congo led a group of middle ranking import countries, which included Kenya, Mauritius, Madagascar, Ethiopia and Zimbabwe, all with more than EUR 0.5 billion of EU-28 imports in 2014. In contrast, EU-28 imports from Burundi, Djibouti, Eritrea, Comoros, Rwanda and South Sudan amounted to less than EUR 50 million in the same year.
Machinery and transport equipment — the largest category of EU exports to COMESA
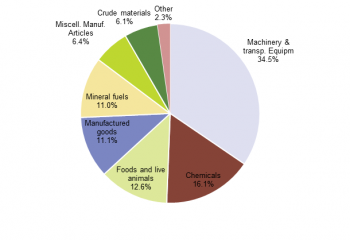
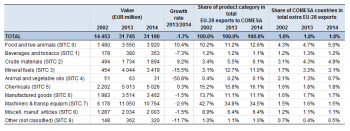
In their composition, EU-28 exports to the COMESA countries have remained relatively stable in recent years. Machinery and transport equipment accounted for 35 % of total EU-28 exports in 2014 (Figure 2). 8 % of EU exports to COMESA were industrial machinery and 7 % were road vehicles. Chemicals, including pharmaceuticals, at 16 %, constituted the next largest group, followed by food and live animals (13 %), manufactured goods (11 %) and mineral fuels (11 %). Mineral fuels’ share of extra-EU exports was 7 times higher in 2002 than in 2014 (Table 4) and the share of these exports in total EU-extra exports increased from 1.7 % to 3.1 %. Machinery and transport equipment, in contrast, has seen its share decline from 43 % in 2002 to 35 % in 2014.
Despite the 1.7 % fall in total exports from EU-28 to COMESA between 2013 and 2014, the composition in terms of products of these exports was similar. Table 4 shows increases in the share of food and live animals, crude materials and chemicals in the total exports from 2013 to 2014.
EU-28 exports to COMESA countries accounted for 1.6 % of total EU exports in 2002 and 1.8 % both in 2013 and 2014. At the detailed product level, in 2014, the COMESA countries accounted for 5 % of extra-EU exports of food, 4.9 % of crude material exports and 3.1 % of mineral fuel exports.
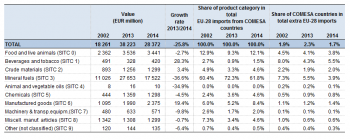
Total EU-28 imports from the COMESA countries fell sharply in 2014 compared with 2013, recording a 26 % decline from EUR 38 billion to EUR 28 billion (Table 5). The main factor influencing this change was the impact of the events in Libya which led to a fall in mineral fuel imports of 37 % (EUR 10 billion) between the same years. Beverages and tobacco and manufactured good showed an increase in EU imports from COMESA (28 % and 19 % respectively).
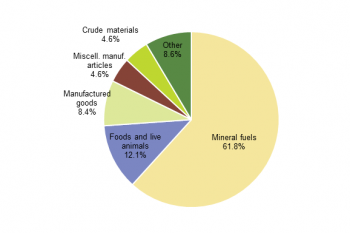
In terms of the composition of EU-28 imports from COMESA (Figure 3), mineral fuels remained by far the largest single component, accounting for 62 % of the total, however well down compared with 72 % in the previous year and similar to the level of 2002. In contrast, the share of food and live animals rose from 9 % in 2013 to 12 % in 2014. The product group ‘Manufactured goods’ saw its share rise in 2014, up to 8.4 %, compared with 5.2 % in 2013. Some of these evolutions can be explained by the changes in commodity prices, particularly oil and non-ferrous metals.
In 2014, COMESA countries accounted for 1.7 % of total EU-28 imports, down from 2.3 % recorded in 2013 and 1.9 % in 2002. This fall was largely a reflection of the sharp decline in mineral fuel imports from COMESA. After accounting for around 7.3 % of total EU mineral fuel imports in 2002 and 5.5 % in 2013, the figure declined to 3.9 % in 2014. COMESA also accounted for 3.8 % of EU-28 food imports and 5.5 % of beverage and tobacco imports.
EU-28 deficit on services with the COMESA countries decreases, and is almost in balance in 2012
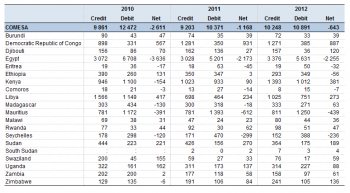
The EU-28’s trade in services with COMESA countries recorded a deficit of EUR 0.6 billion in 2012, with credits of EUR 10.2 billion outweighed by debits of EUR 10.9 billion (Table 6). This pattern has been in place since 2008, with a decrease in the trade deficit in 2011 and 2012. The reduction of the deficit is largely due to an increase in the credit with Egypt and Kenya from 2010 to 2012 and with a higher surplus with Democratic Republic of Congo. The reduction of the deficit from 2010 to 2011 in Egypt was mostly due to a reduction of the debit (from EUR 6.7 billion in 2010 to EUR 5.6 billion in 2012), in Kenya and Democratic Republic of Congo it was due to an increase of the credit in terms of services from the EU.
At a more detailed level, the deficit with Egypt reflects deficits in the travel and transportation accounts, partly offset by a surplus in other services. In 2012, these debits with Egypt amounted to EUR 5.6 billion. This reflects the importance of Egypt as a major tourist destination. While similar detail of the composition of the service sector account is not available for the other countries, deficits, although not on the same scale as for Egypt, were recorded for other important tourist destinations, such as Mauritius (EUR 439 million) and the Seychelles (EUR 236 million).
In contrast to these deficits, in 2012, the EU-28 recorded surpluses with the Democratic Republic of Congo (EUR 887 million), Kenya (EUR 381 million), Libya (EUR 273 million), and Sudan (EUR 189 million).
Data sources and availability
This publication focuses on the COMESA, the Common Market for Eastern and Southern Africa.
Its Mission is to “Endeavour to achieve sustainable economic and social progress in all Member States through increased co-operation and integration in all fields of development particularly in trade, customs and monetary affairs, transport, communication and information, technology, industry and energy, gender, agriculture, environment and natural resources”.
The 20 countries members of the COMESA are:
• Burundi
• Comoros
• Democratic Republic of Congo
• Djibouti
• Egypt
• Eritrea
• Ethiopia
• Kenya
• Libya
• Madagascar
• Malawi
• Mauritius
• Rwanda
• Seychelles
• Sudan
• South Sudan (since 2011)
• Swaziland
• Uganda
• Zambia
• Zimbabwe
Data sources:
The figures presented in this publication have been extracted from Eurostat’s free dissemination database and reflect the state of data availability in April 2015.
Data on the trade of goods are also available in Eurostat’s Comext database. In the methodology applied for the statistics on the trading of goods between Member States and non-member countries (extra-EU trade), statistics do not record exchanges involving goods in transit, placed in a customs warehouse or given temporary admission (for trade fairs, temporary exhibitions, tests, etc.). This is known as "special trade". So the partner will be the country of final destination of the goods.
Data on the trade of services are based on balance of payments statistics. The balance of payments records all economic transactions between a country (i.e. its residents) and foreign countries or international organisations (i.e. the non-residents of that country) during a given period. As part of the balance of payments, the current account records real resources and is subdivided into four basic components: goods, services, income and current transfers. The methodological framework used is that of the fifth edition of the Monetary Fund (IMF) Balance of Payments Manual (BPM5). The EU balance of payments is compiled by Eurostat in accordance with a methodology agreed with the European Central Bank (ECB).
SITC classification (Figures 2 and 3; Tables 3, 4 and 5) Information on commodities exported and imported is presented according to the Standard international trade classification (SITC) at a general level. A full description is available through Eurostat’s classification server RAMON.
COMEXT data (trade of goods) Please note that the sums of the individual SITC product categories are less than the totals due to confidentiality reasons.
In this publication:
- • 1 billion = 1000 million ; 1 million = 1 000 000
- ':' not available
Context
Within Africa, COMESA, the Common Market for Eastern and Southern Africa, is an important trading partner of the EU-28, in particular for mineral fuels. This article presents international trade between the European Union and COMESA countries.
The relations between the EU and COMESA are conducted within the framework of the Cotonou Agreement, the global agreement between the countries of the African, Caribbean and Pacific Group and the EU.
See also
Further Eurostat information
Main tables
- Balance of payments, see:
- Balance of payments - International transactions (t_bop)
- International trade in services, geographical breakdown (t_bop_its)
- External trade, see:
- External trade data (t_ext)
Database
- Balance of payments, see:
- Balance of payments - International transactions (bop)
- International trade in services, geographical breakdown (bop_its)
- External trade, see:
- External trade data (ext)
- External trade detailed data (detail)
Dedicated section
Methodology / Metadata
- Eurostat - RAMON (classification server)
- Balance of Payments Manual - Fifth edition
- OECD Benchmark Definition of Foreign Direct Investment - Third edition