|
 |
| For any question on data and metadata, please contact: Eurostat user support |
|
|||
| 1.1. Contact organisation | Belgian Science Policy Office (Belspo) |
||
| 1.2. Contact organisation unit | Monitoring and evaluation of research and innovation (MERI) |
||
| 1.5. Contact mail address | Boulevard Simon Bolivar 30, 1000 Brussels, Belgium |
||
|
|||
| 2.1. Metadata last certified | 31 October 2023 | ||
| 2.2. Metadata last posted | 31 October 2023 | ||
| 2.3. Metadata last update | 31 October 2023 | ||
|
||||||||||||||||||
| 3.1. Data description | ||||||||||||||||||
Statistics on Business enterprise R&D (BERD) measure research and experimental development (R&D) performed in the business enterprise sector, i.e. R&D expenditure and R&D personnel. In line with this objective the target population for the national R&D survey of the business enterprise sector consist of all R&D performing enterprises (including all R&D performers – occasional and continuous, known and unknown - in all branches and size classes) belonging to this sector. The “enterprise” is defined in Council Regulation (EEC) No 1993/696 of 15 March 1993. The results are related to the population of all R&D performing enterprises classified in Sections A to U of the common statistical classification of economic activities as established by Regulation (EC) No 1893/2006 of the European Parliament and of the Council (NACE Rev.2). The main concepts and definitions used for the production of R&D statistics are given by OECD (2015), Frascati Manual 2015: Guidelines for Collecting and Reporting Data on Research and Experimental Development, The Measurement of Scientific, Technological and Innovation Activities, which is the internationally recognised standard methodology for collecting R&D statistics and by Eurostat’s European Business Statistics Methodological Manual on R&D Statistics. (EBS Methodological Manual on R&D Statistics. Since the beginning of 2021, the collection of R&D statistics is based on Commission Implementing Regulation (EU) No 2020/1197 of 30 July 2020. The Regulation sets the framework for the collection of R&D statistics and specifies the main variables of interest and their breakdowns at predefined level of detail. Statistics on science, technology and innovation were collected until the end of 2020 based on Commission Implementing Regulation (EU) No 2012/995 concerning the production and development of Community statistics on science and technology. |
||||||||||||||||||
| 3.2. Classification system | ||||||||||||||||||
|
||||||||||||||||||
| 3.2.1. Additional classifications | ||||||||||||||||||
|
||||||||||||||||||
| 3.3. Coverage - sector | ||||||||||||||||||
See below. |
||||||||||||||||||
| 3.3.1. General coverage | ||||||||||||||||||
|
||||||||||||||||||
| 3.3.2. Sector institutional coverage | ||||||||||||||||||
|
||||||||||||||||||
| 3.3.3. R&D variable coverage | ||||||||||||||||||
|
||||||||||||||||||
| 3.3.4. International R&D transactions | ||||||||||||||||||
|
||||||||||||||||||
| 3.3.5. Extramural R&D expenditures | ||||||||||||||||||
According to the Frascati Manual, expenditure on extramural R&D (i.e. R&D performed outside the statistical unit enterprise) is not included in intramural R&D performance totals (FM, §4.12).
|
||||||||||||||||||
| 3.4. Statistical concepts and definitions | ||||||||||||||||||
See below. |
||||||||||||||||||
| 3.4.1. R&D expenditure | ||||||||||||||||||
|
||||||||||||||||||
| 3.4.2. R&D personnel | ||||||||||||||||||
See below. |
||||||||||||||||||
| 3.4.2.1. R&D personnel – Head Counts (HC) | ||||||||||||||||||
|
||||||||||||||||||
| 3.4.2.2. R&D personnel – Full Time Equivalent (FTE) | ||||||||||||||||||
|
||||||||||||||||||
| 3.4.2.3. FTE calculation | ||||||||||||||||||
FTEs are collected directly in the questionnaire. |
||||||||||||||||||
| 3.4.2.4. R&D personnel - Cross-classification by function and qualification | ||||||||||||||||||
|
||||||||||||||||||
| 3.5. Statistical unit | ||||||||||||||||||
The statistical unit for BERD is the enterprise as defined by Council Regulation (EEC) No 1993/696 of 15 March 1993, – if there are deviations please explain. No deviation, reporting is done at enterprise level. Sampling, data collection and data processing were however done at legal unit level. |
||||||||||||||||||
| 3.6. Statistical population | ||||||||||||||||||
See below. |
||||||||||||||||||
| 3.6.1. National target population | ||||||||||||||||||
The objective of the European R&D statistics is to cover all intramural R&D activities. In line with this objective the target population for the national R&D survey of the Business Enterprise Sector should consist of all R&D performing enterprises (including all R&D performers – occasional and continuous, known and unknown - in all branches and size classes) belonging to this sector. In practice however, countries in their R&D surveys might exclude some enterprises for which R&D activities are deemed to be non-existent or negligible, in order to limit the response burden or due to budgetary constraints.
|
||||||||||||||||||
| 3.6.2. Frame population – Description | ||||||||||||||||||
The target population is the population for which inferences are made. The frame (or frames, as sometimes several frames are used) is a device that permits access to population units. The frame population is the set of population units which can be accessed through the frame and the survey data really refer to this population.
|
||||||||||||||||||
| 3.7. Reference area | ||||||||||||||||||
Not requested. R&D statistics cover national and regional data. |
||||||||||||||||||
| 3.8. Coverage - Time | ||||||||||||||||||
Not requested. See point 3.4. |
||||||||||||||||||
| 3.9. Base period | ||||||||||||||||||
Not requested. |
||||||||||||||||||
|
|||
Thousand euros, %, FTEs, physical persons. |
|||
|
|||
2021. |
|||
|
||||||||||||||
| 6.1. Institutional Mandate - legal acts and other agreements | ||||||||||||||
See below. |
||||||||||||||
| 6.1.1. European legislation | ||||||||||||||
|
||||||||||||||
| 6.1.2. National legislation | ||||||||||||||
|
||||||||||||||
| 6.1.3. Standards and manuals | ||||||||||||||
|
||||||||||||||
| 6.2. Institutional Mandate - data sharing | ||||||||||||||
Not requested. |
||||||||||||||
|
|||
| 7.1. Confidentiality - policy | |||
Confidentiality, being one of the process quality components, concerns the privacy of data providers (households, enterprises, administrations and other respondents), the confidentiality of the information they provide and the extent of its use for statistical purposes. A property of data indicating the extent to which their unauthorised disclosure could be prejudicial or harmful to the interest of the source or other relevant parties.
The Belgian Interfederal Institute of Statistics (IIS) coordinates the statistics production at the regional and national level in Belgium. It abides by the European Statistics Code of Practice, including its principle 5, on statistical confidentiality and data protection. Please find information at this website.
All staff members of the regional and national offices are subjected to national statistical law. Data protection officers supervise the correct application of all relevant legal obligations. |
|||
| 7.2. Confidentiality - data treatment | |||
Data cells compiled with data of less than 5 units are flagged confidential. In case the value of a cell corresponds for 80% or more with an observed response, these cells are also flagged as confidential. |
|||
|
|||
| 8.1. Release calendar | |||
Flanders:
At the national level: data are not released at a fixed date. We try to publish them in July or August after the official transmission to Eurostat. |
|||
| 8.2. Release calendar access | |||
In Flanders the release calendar for the 3% note and the more detailed report is publicly available. Please find information at these websites. At the national level: data are published at the BELSPO website. |
|||
| 8.3. Release policy - user access | |||
In Flanders there are strict guidelines for advance access to the core results published on June 30. Advance access is limited in time (max. 24 hours in advance), and is made publicly known. During the allotted advance access users are not allowed to publicly announce results. Once results in Flanders are published on their dedicated websites, they are available to the general public. Although the national level is not subjected to this policy, we explicitly ask all data producing organisations to respect the official transmission to Eurostat, which is on the same day (June 30). After this transmission all concerned parties are free to disclose aggregated data on their websites. |
|||
|
|||
Results based on the R&D survey are published biennially, in uneven years. In even years Flanders publishes a 3% note with core R&D numbers (R&D expenditure, R&D personnel) on June 30 based on responses obtained in the innovation survey (CIS). |
|||
|
||||||||||||||||
| 10.1. Dissemination format - News release | ||||||||||||||||
See below. |
||||||||||||||||
| 10.1.1. Availability of the releases | ||||||||||||||||
1) Y - Yes, N – No |
||||||||||||||||
| 10.2. Dissemination format - Publications | ||||||||||||||||
See below. |
||||||||||||||||
| 10.2.1. Availability of means of dissemination | ||||||||||||||||
1) Y – Yes, N - No |
||||||||||||||||
| 10.3. Dissemination format - online database | ||||||||||||||||
Not available. |
||||||||||||||||
| 10.3.1. Data tables - consultations | ||||||||||||||||
Not requested. |
||||||||||||||||
| 10.4. Dissemination format - microdata access | ||||||||||||||||
See below. |
||||||||||||||||
| 10.4.1. Provisions affecting the access | ||||||||||||||||
|
||||||||||||||||
| 10.5. Dissemination format - other | ||||||||||||||||
See below. |
||||||||||||||||
| 10.5.1. Metadata - consultations | ||||||||||||||||
Not requested. |
||||||||||||||||
| 10.5.2. Availability of other dissemination means | ||||||||||||||||
1) Y – Yes, N - No |
||||||||||||||||
| 10.6. Documentation on methodology | ||||||||||||||||
We do not provide methodological documentation but we provide ad-hoc answers to users' requests. |
||||||||||||||||
| 10.6.1. Metadata completeness - rate | ||||||||||||||||
Not requested. |
||||||||||||||||
| 10.7. Quality management - documentation | ||||||||||||||||
See below. |
||||||||||||||||
| 10.7.1. Information and clarity | ||||||||||||||||
|
||||||||||||||||
|
|||
| 11.1. Quality assurance | |||
We abide by the principles enumerated in the Qulaity Assurance Framework of the European STatistical System (ESS-QAF-V2.0-final.pdf (europa.eu)). |
|||
| 11.2. Quality management - assessment | |||
See our comments in the Section on accuracy. In the Flanders region university students are recruited and trained to follow up non-responding firms by phone, to motivate them to respond. In the data editing stage special attention is paid to the top R&D performers, given the skewed distribution of R&D expenditure and the impact these top performers have on the overall numbers. Even these top performers oftentimes need to be re-contacted to clarify inconsistencies in their responses. A similar methodology is applied in the Brussels Capitol Region and the Walloon Region but to a smaller extent because of a more limited availability of human resources (no students). The R&D survey is voluntary in Belgium, which implies that respondents may not be too motivated to provide accurate, thoughtful responses, especially when it comes to consistency over time. We have been trying to make the survey mandatory, but, as this requires legal work and approval of employers' associations, this proves to be a difficult task. Since 2005 Belgium has a tax incentive that reduces the wages for R&D employees when certain criteria are met. The introduction of this tax incentive had an impact on the willingness of some firms to respond, for example to define their work as R&D. A drawback, however, was that some respondents tend now to limit their numbers for R&D personnel to those employees for whom they obtained the fiscal incentive. As in most surveys, the treatment of non-responses as well as the check of the quality of the information given by the enterprises answering the questionnaire are major issues in our data processing. In many enterprises, R&D figures are not directly available, and even when available they might not be in conformity with the prescriptions of the Frascati Manual. So, despite guidelines, definitions and precisions given in the R&D questionnaire, and despite an extensive set of editing controls (to check the coherence and quality of the data, e.g. during the online coding of the data), we are well aware quality issues are an ongoing concern. |
|||
|
||||||||||||||||||||||||||||||||||||||||||||||||||||||||||||||||||||||||||||||||||||
| 12.1. Relevance - User Needs | ||||||||||||||||||||||||||||||||||||||||||||||||||||||||||||||||||||||||||||||||||||
See below. |
||||||||||||||||||||||||||||||||||||||||||||||||||||||||||||||||||||||||||||||||||||
| 12.1.1. Needs at national level | ||||||||||||||||||||||||||||||||||||||||||||||||||||||||||||||||||||||||||||||||||||
Users' class codification 1- Institutions:
2- Social actors: Employers’ associations, trade unions, lobbies, among others, at the European, national or regional level. 3- Media: International or regional media – specialized or for the general public – interested both in figures and analyses or comments. The media are the main channels of statistics to the general public. 4- Researchers and students (Researchers and students need statistics, analyses, ad hoc services, access to specific data.). 5- Enterprises or businesses (Either for their own market analysis, their marketing strategy (large enterprises) or because they offer consultancy services). 6- Other (User class defined for national purposes, different from the previous classes. ). |
||||||||||||||||||||||||||||||||||||||||||||||||||||||||||||||||||||||||||||||||||||
| 12.2. Relevance - User Satisfaction | ||||||||||||||||||||||||||||||||||||||||||||||||||||||||||||||||||||||||||||||||||||
To evaluate if users' needs have been satisfied, the best way is to use user satisfaction surveys. |
||||||||||||||||||||||||||||||||||||||||||||||||||||||||||||||||||||||||||||||||||||
| 12.2.1. National Surveys and feedback | ||||||||||||||||||||||||||||||||||||||||||||||||||||||||||||||||||||||||||||||||||||
|
||||||||||||||||||||||||||||||||||||||||||||||||||||||||||||||||||||||||||||||||||||
| 12.3. Completeness | ||||||||||||||||||||||||||||||||||||||||||||||||||||||||||||||||||||||||||||||||||||
See below. |
||||||||||||||||||||||||||||||||||||||||||||||||||||||||||||||||||||||||||||||||||||
| 12.3.1. Data completeness - rate | ||||||||||||||||||||||||||||||||||||||||||||||||||||||||||||||||||||||||||||||||||||
Not available. |
||||||||||||||||||||||||||||||||||||||||||||||||||||||||||||||||||||||||||||||||||||
| 12.3.2. Completeness - overview | ||||||||||||||||||||||||||||||||||||||||||||||||||||||||||||||||||||||||||||||||||||
Completeness is assessed via comparison of the data delivered against the requirements of Commission Implementing Regulation (EU) No 2020/1197.
Criteria: A) Obligatory data. Only 'Very Good' = 100%, Poor' >95%; 'Very Poor' <100% apply. B) Optional data. 'Very Good' = 100%; 'Good' = >75%; 'Satisfactory' 50 to 75%%; 'Poor' 25 to 50%; 'Very Poor' 0 to 25%. |
||||||||||||||||||||||||||||||||||||||||||||||||||||||||||||||||||||||||||||||||||||
| 12.3.3. Data availability | ||||||||||||||||||||||||||||||||||||||||||||||||||||||||||||||||||||||||||||||||||||
See below. |
||||||||||||||||||||||||||||||||||||||||||||||||||||||||||||||||||||||||||||||||||||
| 12.3.3.1. Data availability - R&D Expenditure | ||||||||||||||||||||||||||||||||||||||||||||||||||||||||||||||||||||||||||||||||||||
1) Y-start year, N – data not available |
||||||||||||||||||||||||||||||||||||||||||||||||||||||||||||||||||||||||||||||||||||
| 12.3.3.2. Data availability - R&D Personnel (HC) | ||||||||||||||||||||||||||||||||||||||||||||||||||||||||||||||||||||||||||||||||||||
1) Y-start year, N – data not available |
||||||||||||||||||||||||||||||||||||||||||||||||||||||||||||||||||||||||||||||||||||
| 12.3.3.3. Data availability - R&D Personnel (FTE) | ||||||||||||||||||||||||||||||||||||||||||||||||||||||||||||||||||||||||||||||||||||
1) Y-start year, N – data not available |
||||||||||||||||||||||||||||||||||||||||||||||||||||||||||||||||||||||||||||||||||||
| 12.3.3.4. Data availability - other | ||||||||||||||||||||||||||||||||||||||||||||||||||||||||||||||||||||||||||||||||||||
|
||||||||||||||||||||||||||||||||||||||||||||||||||||||||||||||||||||||||||||||||||||
|
||||||||||||||||||||||||||||||||||||||||||||||||||||||||||||
| 13.1. Accuracy - overall | ||||||||||||||||||||||||||||||||||||||||||||||||||||||||||||
Accuracy in the statistical sense denotes the closeness of computations or estimates to the exact or true values. Statistics are not equal with the true values because of variability (the statistics change from implementation to implementation of the survey due to random effects) and bias (the average of the possible values of the statistics from implementation to implementation is not equal to the true value due to systematic effects). Several types of statistical errors occur during the survey process. The following typology of errors has been adopted:
Model assumption errors should be treated under the heading of the respective error they are trying to reduce. |
||||||||||||||||||||||||||||||||||||||||||||||||||||||||||||
| 13.1.1. Accuracy - Overall by 'Types of Error' | ||||||||||||||||||||||||||||||||||||||||||||||||||||||||||||
|
||||||||||||||||||||||||||||||||||||||||||||||||||||||||||||
| 13.1.2. Assessment of the accuracy with regard to the main indicators | ||||||||||||||||||||||||||||||||||||||||||||||||||||||||||||
|
||||||||||||||||||||||||||||||||||||||||||||||||||||||||||||
| 13.2. Sampling error | ||||||||||||||||||||||||||||||||||||||||||||||||||||||||||||
That part of the difference between a population value and an estimate thereof, derived from a random sample, which is due to the fact that only a subset of the population is enumerated. |
||||||||||||||||||||||||||||||||||||||||||||||||||||||||||||
| 13.2.1. Sampling error - indicators | ||||||||||||||||||||||||||||||||||||||||||||||||||||||||||||
The main indicator used to measure sampling errors is the coefficient of variation (CV). |
||||||||||||||||||||||||||||||||||||||||||||||||||||||||||||
| 13.2.1.1. Variance Estimation Method | ||||||||||||||||||||||||||||||||||||||||||||||||||||||||||||
None - we did not attempt to estimate variances and coefficients of variations (as 97.5% of R&D expenditure and 95%of R&D personnel in FTE come from the census share of our surveyed set of enterprises). |
||||||||||||||||||||||||||||||||||||||||||||||||||||||||||||
| 13.2.1.2. Coefficient of variation for key variables by NACE | ||||||||||||||||||||||||||||||||||||||||||||||||||||||||||||
|
||||||||||||||||||||||||||||||||||||||||||||||||||||||||||||
| 13.2.1.3. Coefficient of variation for key variables by Size Class | ||||||||||||||||||||||||||||||||||||||||||||||||||||||||||||
|
||||||||||||||||||||||||||||||||||||||||||||||||||||||||||||
| 13.3. Non-sampling error | ||||||||||||||||||||||||||||||||||||||||||||||||||||||||||||
Non-sampling errors occur in all phases of a survey. They add to the sampling errors (if present) and contribute to decreasing overall accuracy. It is important to assess their relative weight in the total error and devote appropriate resources for their control and assessment. |
||||||||||||||||||||||||||||||||||||||||||||||||||||||||||||
| 13.3.1. Coverage error | ||||||||||||||||||||||||||||||||||||||||||||||||||||||||||||
Coverage errors (or frame errors) are due to divergences between the target population and the frame population. The frame population is the set of target population members that has a chance to be selected into the survey sample. It is a listing of all items in the population from which the sample is drawn that contains contact details as well as sufficient information to perform stratification and sampling.
Only 2.2% of the initial gross sample selected turned out to be non-eligible enterprises that had to be dropped from the net, post survey sample.
We use multiple sources of information to update the register of known or assumed R&D performers. As they are the major contributors to the final R&D numbers, we feel confident in our coverage of the target population. Moreover, we evaluate our sources for detecting newcomers in each survey wave. Newly detected enterprises generally only cover a limited share of R&D expenditure/personnel, implying our methods for updating our register of known or assumed R&D performers work well. |
||||||||||||||||||||||||||||||||||||||||||||||||||||||||||||
| 13.3.1.1. Over-coverage - rate | ||||||||||||||||||||||||||||||||||||||||||||||||||||||||||||
Magnitude of error (%) = (Observed Value-True Value)/ True Value (%). |
||||||||||||||||||||||||||||||||||||||||||||||||||||||||||||
| 13.3.1.1.1. Over-coverage rate - groups | ||||||||||||||||||||||||||||||||||||||||||||||||||||||||||||
|
||||||||||||||||||||||||||||||||||||||||||||||||||||||||||||
| 13.3.1.2. Common units - proportion | ||||||||||||||||||||||||||||||||||||||||||||||||||||||||||||
Not requested. |
||||||||||||||||||||||||||||||||||||||||||||||||||||||||||||
| 13.3.1.3. Frame misclassification rate | ||||||||||||||||||||||||||||||||||||||||||||||||||||||||||||
Misclassification rate measures the percentage of enterprises that changed stratum between the time the frame was last updated and the time the survey was carried out. It is defined as the number of enterprises that changed stratum divided by the number of enterprises which belong to the stratum, according to the frame. The rate can be estimated based on the characteristics of the surveyed enterprises.
|
||||||||||||||||||||||||||||||||||||||||||||||||||||||||||||
| 13.3.2. Measurement error | ||||||||||||||||||||||||||||||||||||||||||||||||||||||||||||
Measurement errors occur during data collection and generate bias by recording values different than the true ones (e.g. difficulty to distinguish intramural from extramural R&D Expenditure). The survey questionnaire used for data collection may have led to the recording of wrong values, or there may be respondent or interviewer bias.
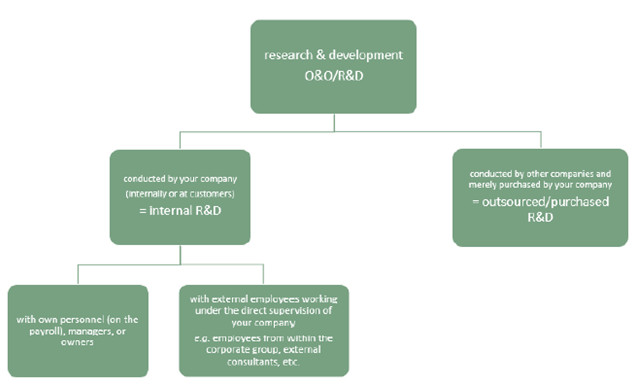
We still are asked by firms whether the work they have been doing could be considered to be R&D or not. As there are many more firms that do not contact us, we can assume that many of them are still unsure as to what should be considered to be R&D or not. Unity measure errors (e.g., cases where time spent on R&D is given in hours rather than FTE, or where expenditure is reported in millions rather than in euros) occur occasionally. Group level responses are given occasionally, when unusually high numbers are given for R&D, given a firm’s basic economic data (turnover, number of persons employed). Some respondents limit their numbers for R&D personnel to those for whom they obtained the tax incentive for R&D, yielding un underestimate of overall R&D personnel. Some firms had to return the tax incentives they initially had obtained for R&D personnel, definitely making them unwilling to respond to our R&D survey, even though their activities would still count towards R&D under Frascati Manual guidelines. Several top R&D performers were unable to give head counts or FTE for consultants embedded in their own internal R&D projects, as they paid a flat fee for the work to be done (under their supervision). Several of these firms included consultants abroad. As those consultants they hired worked remotely, they were definitely not able to give more specifics such as gender and occupation of those consultants. Because of the difficulty in obtaining information on embedded consultants (“external R&D personnel” in the terminology of the 2015 Frascati Manual), we included in the statistics we reported for qualification of R&D personnel, only own, in-house R&D personnel, in line with what we have done in the past.
We keep track of frequently made comments throughout the field phase, and try to take those comments into account when preparing the survey form for the next wave. Whenever we revise or add new questions, we perform cognitive interviews to test them. We provide a diagram to try to help respondents in distinguishing between in-house and external R&D, and to decide on how consultants embedded in own R&D projects fit into the reporting. A definition of what is R&D and what should be excluded is included in the survey form. We provide help to respondents by phone, and they do often contact this helpdesk. The online version of the questionnaire form contains logical consistency checks, that produce error messages/warnings in case of inconsistencies. The error messages are not binding. We have an extensive data editing routine for detecting and correcting inconsistencies in survey responses. Especially for major R&D performers we try to re-contact respondents in order to clarify and correct their responses. We set up meetings with major R&D performers to make sure their responses are in line with Frascati Manual guidelines. |
||||||||||||||||||||||||||||||||||||||||||||||||||||||||||||
| 13.3.3. Non response error | ||||||||||||||||||||||||||||||||||||||||||||||||||||||||||||
Non-response occurs when a survey failed to collect data on all survey variables from all the population units designated for data collection in a sample or complete enumeration. There are two elements of non-response:
The extent of response (and accordingly of non response) is also measured with response rates. |
||||||||||||||||||||||||||||||||||||||||||||||||||||||||||||
| 13.3.3.1. Unit non-response - rate | ||||||||||||||||||||||||||||||||||||||||||||||||||||||||||||
The main interest is to judge if the response from the target population was satisfying by computing the weighted and un-weighted response rate. |
||||||||||||||||||||||||||||||||||||||||||||||||||||||||||||
| 13.3.3.1.1. Unit non-response rates by Size Class | ||||||||||||||||||||||||||||||||||||||||||||||||||||||||||||
|
||||||||||||||||||||||||||||||||||||||||||||||||||||||||||||
| 13.3.3.1.2. Unit non-response rates by NACE | ||||||||||||||||||||||||||||||||||||||||||||||||||||||||||||
|
||||||||||||||||||||||||||||||||||||||||||||||||||||||||||||
| 13.3.3.1.3. Recalls/Reminders description | ||||||||||||||||||||||||||||||||||||||||||||||||||||||||||||
See section 18.3, “incentives used for increasing response” for a description of reminders sent. |
||||||||||||||||||||||||||||||||||||||||||||||||||||||||||||
| 13.3.3.1.4. Unit non-response survey | ||||||||||||||||||||||||||||||||||||||||||||||||||||||||||||
|
||||||||||||||||||||||||||||||||||||||||||||||||||||||||||||
| 13.3.3.2. Item non-response - rate | ||||||||||||||||||||||||||||||||||||||||||||||||||||||||||||
Definition: Un-weighted Item non-Response Rate (%) = 1-(Number of units with a response for the item) / (Total number of eligible , for the item, units in the sample) * 100. |
||||||||||||||||||||||||||||||||||||||||||||||||||||||||||||
| 13.3.3.2.1. Un-weighted item non-response rate | ||||||||||||||||||||||||||||||||||||||||||||||||||||||||||||
|
||||||||||||||||||||||||||||||||||||||||||||||||||||||||||||
| 13.3.3.3. Magnitude of errors due to non-response | ||||||||||||||||||||||||||||||||||||||||||||||||||||||||||||
|
||||||||||||||||||||||||||||||||||||||||||||||||||||||||||||
| 13.3.4. Processing error | ||||||||||||||||||||||||||||||||||||||||||||||||||||||||||||
Between data collection and the beginning of statistical analysis, data must undergo a certain processing: coding, data entry, data editing, imputation, etc. Errors introduced at these stages are called processing errors. Data editing identifies inconsistencies or errors in the data. |
||||||||||||||||||||||||||||||||||||||||||||||||||||||||||||
| 13.3.4.1. Identification of the main processing errors | ||||||||||||||||||||||||||||||||||||||||||||||||||||||||||||
|
||||||||||||||||||||||||||||||||||||||||||||||||||||||||||||
| 13.3.5. Model assumption error | ||||||||||||||||||||||||||||||||||||||||||||||||||||||||||||
Not requested. |
||||||||||||||||||||||||||||||||||||||||||||||||||||||||||||
|
|||||||||||||||
| 14.1. Timeliness | |||||||||||||||
Timeliness and punctuality refer to time and dates, but in a different manner: the timeliness of statistics reflects the length of time between their availability and the event or phenomenon they describe. Punctuality refers to the time lag between the release date of the data and the target date on which they should have been delivered, with reference to dates announced in the official release calendar. |
|||||||||||||||
| 14.1.1. Time lag - first result | |||||||||||||||
Time lag between the end of reference period and the release date of the results:
|
|||||||||||||||
| 14.1.2. Time lag - final result | |||||||||||||||
|
|||||||||||||||
| 14.2. Punctuality | |||||||||||||||
Punctuality refers to the time lag between the release date of data and the target date on which they were scheduled for release as announced officially. |
|||||||||||||||
| 14.2.1. Punctuality - delivery and publication | |||||||||||||||
Punctuality of time schedule of data release = (Actual date of the data release) - (Scheduled date of the data release). |
|||||||||||||||
| 14.2.1.1. Deadline and date of data transmission | |||||||||||||||
|
|||||||||||||||
|
||||||||||||||||||||||||||||||||||||||||||||||||||||||||||||||||
| 15.1. Comparability - geographical | ||||||||||||||||||||||||||||||||||||||||||||||||||||||||||||||||
See below. |
||||||||||||||||||||||||||||||||||||||||||||||||||||||||||||||||
| 15.1.1. Asymmetry for mirror flow statistics - coefficient | ||||||||||||||||||||||||||||||||||||||||||||||||||||||||||||||||
Not requested. |
||||||||||||||||||||||||||||||||||||||||||||||||||||||||||||||||
| 15.1.2. General issues of comparability | ||||||||||||||||||||||||||||||||||||||||||||||||||||||||||||||||
Not applicable. |
||||||||||||||||||||||||||||||||||||||||||||||||||||||||||||||||
| 15.1.3. Survey Concepts Issues | ||||||||||||||||||||||||||||||||||||||||||||||||||||||||||||||||
The following table lists a number of key survey concepts and conceptual issues; it gives reference to the Commission Implementing Regulation (EU) No 2020/1197 or Frascati manual and EBS Methodological Manual on R&D Statistics paragraphs with recommendations about these concepts / issues.
|
||||||||||||||||||||||||||||||||||||||||||||||||||||||||||||||||
| 15.1.4. Deviations from recommendations | ||||||||||||||||||||||||||||||||||||||||||||||||||||||||||||||||
The following table lists a number of key methodological issues, which may affect the international comparability of national R&D statistics. The table gives the references in the Frascati manual, where related recommendations are made. Countries are asked to report on the existence of any deviations from existing recommendations and comment upon.
|
||||||||||||||||||||||||||||||||||||||||||||||||||||||||||||||||
| 15.2. Comparability - over time | ||||||||||||||||||||||||||||||||||||||||||||||||||||||||||||||||
See below. |
||||||||||||||||||||||||||||||||||||||||||||||||||||||||||||||||
| 15.2.1. Length of comparable time series | ||||||||||||||||||||||||||||||||||||||||||||||||||||||||||||||||
See below. |
||||||||||||||||||||||||||||||||||||||||||||||||||||||||||||||||
| 15.2.2. Breaks in time series | ||||||||||||||||||||||||||||||||||||||||||||||||||||||||||||||||
|
||||||||||||||||||||||||||||||||||||||||||||||||||||||||||||||||
| 15.2.3. Collection of data in the even years | ||||||||||||||||||||||||||||||||||||||||||||||||||||||||||||||||
Collection of data for even reference years (when the R&D survey is off; see also section 18.5.2): in one of the 3 NUTS 1 regions, numbers for intramural R&D expenditure and R&D personnel as FTE are obtained from the innovation survey (CIS) that surveys that reference year. CIS includes detailed questions asking for these two aspects. For the other two regions these two numbers are obtained from regressions (containing linear, quadratic and cubic terms) on numbers obtained from previous surveys at the region level. For researchers as FTE the percentage of researchers obtained in the last survey is applied to the current number of total R&D personnel as FTE. It should be noted, however, that these two regions that apply regressions, survey two years in their regular R&D survey (t and t-1), so the estimates obtained from regressions provided for the even years are updated using numbers obtained from an actual survey at t + 30. Hence, at t + 30, numbers obtained from actual surveys are available for all 3 regions. |
||||||||||||||||||||||||||||||||||||||||||||||||||||||||||||||||
| 15.3. Coherence - cross domain | ||||||||||||||||||||||||||||||||||||||||||||||||||||||||||||||||
This part deals with any national coherence assessments which may have been undertaken. It reports results for variables which are the same or relevant to R&D statistics, from other national surveys and / or administrative sources and explains and comments on their degree of agreement with R&D statistics. Intramural R & D expenditure (code 230101 in the Commission Implementing Regulation (EU) 2020/1197) and R & D personnel (code 230201) are surveyed also in foreign-controlled EU enterprises statistics (inward FATS). The Community innovation survey 2020 (CIS2020) (inn_cis12) (europa.eu) also collects the R&D expenditure of enterprises that form the coverage of the CIS2020 survey. |
||||||||||||||||||||||||||||||||||||||||||||||||||||||||||||||||
| 15.3.1. Coherence - sub annual and annual statistics | ||||||||||||||||||||||||||||||||||||||||||||||||||||||||||||||||
Not requested. |
||||||||||||||||||||||||||||||||||||||||||||||||||||||||||||||||
| 15.3.2. Coherence - National Accounts | ||||||||||||||||||||||||||||||||||||||||||||||||||||||||||||||||
Not available. |
||||||||||||||||||||||||||||||||||||||||||||||||||||||||||||||||
| 15.3.3. National Coherence Assessments | ||||||||||||||||||||||||||||||||||||||||||||||||||||||||||||||||
|
||||||||||||||||||||||||||||||||||||||||||||||||||||||||||||||||
| 15.3.4. Coherence – Foreign-controlled EU enterprises – inward FATS | ||||||||||||||||||||||||||||||||||||||||||||||||||||||||||||||||
To determine foreign-controlled, multinational or domestic status of enterprises we use multiple sources at our disposal: information from a commercial firm-level database (Bel-first), firms’ balance sheets, firm websites, information from the Euro Groups Register (EGR), information from colleagues of the Belgian National Bank who provide FATS. Our impression is that FATS, EGR Global Decision Center (GDC) and EGR Global Group Head (GGH) data still contain information on intermediate group members rather than the Ultimate Controlling Institutionnal Unit (UCI). |
||||||||||||||||||||||||||||||||||||||||||||||||||||||||||||||||
| 15.4. Coherence - internal | ||||||||||||||||||||||||||||||||||||||||||||||||||||||||||||||||
See below. |
||||||||||||||||||||||||||||||||||||||||||||||||||||||||||||||||
| 15.4.1. Comparison between preliminary and final data | ||||||||||||||||||||||||||||||||||||||||||||||||||||||||||||||||
This part compares key R&D variables as preliminary and final data.
|
||||||||||||||||||||||||||||||||||||||||||||||||||||||||||||||||
| 15.4.2. Consistency between R&D personnel and expenditure | ||||||||||||||||||||||||||||||||||||||||||||||||||||||||||||||||
|
||||||||||||||||||||||||||||||||||||||||||||||||||||||||||||||||
|
|||||||||||||||||||||
The assessment of costs associated with a statistical product is a rather complicated task since there must exist a mechanism for appointing portions of shared costs (for instance shared IT resources and dissemination channels) and overheads (office space, utility bills etc). The assessment must become detailed and clear enough so that international comparisons among agencies of different structures are feasible. |
|||||||||||||||||||||
| 16.1. Costs summary | |||||||||||||||||||||
|
|||||||||||||||||||||
| 16.2. Components of burden and description of how these estimates were reached | |||||||||||||||||||||
|
|||||||||||||||||||||
|
|||
| 17.1. Data revision - policy | |||
Not requested. |
|||
| 17.2. Data revision - practice | |||
Not requested. |
|||
| 17.2.1. Data revision - average size | |||
Not requested. |
|||
|
||||||||||||||||||||||||||||||||||||||||||||
| 18.1. Source data | ||||||||||||||||||||||||||||||||||||||||||||
Several separate activities are used for the collection of raw data or pre-compiled administrative data and statistics related to R&D. For simplicity, we call them surveys irrespective of whether they are sample surveys, censuses, collections of administrative data/pre-compiled statistics. This section presents the names of the surveys by sector of performance as well as methodological information for each survey. Depending on the type of survey and sector of performance, only the sections corresponding to that survey and sector are filled in. |
||||||||||||||||||||||||||||||||||||||||||||
| 18.1.1. Data source – general information | ||||||||||||||||||||||||||||||||||||||||||||
|
||||||||||||||||||||||||||||||||||||||||||||
| 18.1.2. Sample/census survey information | ||||||||||||||||||||||||||||||||||||||||||||
|
||||||||||||||||||||||||||||||||||||||||||||
| 18.1.3. Information on collection of administrative data or of pre-compiled statistics | ||||||||||||||||||||||||||||||||||||||||||||
|
||||||||||||||||||||||||||||||||||||||||||||
| 18.2. Frequency of data collection | ||||||||||||||||||||||||||||||||||||||||||||
We run surveys for RD in the BES sector every two years (see 12.3.3. for more details). |
||||||||||||||||||||||||||||||||||||||||||||
| 18.3. Data collection | ||||||||||||||||||||||||||||||||||||||||||||
See below. |
||||||||||||||||||||||||||||||||||||||||||||
| 18.3.1. Data collection overview | ||||||||||||||||||||||||||||||||||||||||||||
|
||||||||||||||||||||||||||||||||||||||||||||
| 18.3.2. Questionnaire and other documents | ||||||||||||||||||||||||||||||||||||||||||||
Annexes: Short questionnaire EN Brussels and Wallonia Long questionnaire EN Brussels and Wallonia Long questionnaire Flanders (NL) Short questionnaire for Brussels and the Walloon Region (FR) Short questionnaire for Brussels and the Walloon Region (NL) Long questionnaire for Brussels and the Walloon Region (FR) Long questionnaire for Brussels and the Walloon Region (NL) Short questionnaire for the Walloon Region (DE) Long questionnaire for the Walloon Region (DE) |
||||||||||||||||||||||||||||||||||||||||||||
| 18.4. Data validation | ||||||||||||||||||||||||||||||||||||||||||||
See section 13.3.2: The online version of the questionnaire form contains logical consistency checks, that produce error messages/warnings in case of inconsistencies. The error messages are not binding. We have an extensive data editing routine for detecting and correcting inconsistencies in survey responses. R&D numbers given by respondents are also compared to numbers for turnover, personnel and to responses given to previous R&D or innovation surveys, to detect outliers or major changes. Especially for major R&D performers we try to re-contact respondents in order to clarify and correct their responses in cases of inconsistencies or major changes. We set up meetings with major R&D performers to make sure their responses are in line with Frascati Manual guidelines. |
||||||||||||||||||||||||||||||||||||||||||||
| 18.5. Data compilation | ||||||||||||||||||||||||||||||||||||||||||||
See below. |
||||||||||||||||||||||||||||||||||||||||||||
| 18.5.1. Imputation - rate | ||||||||||||||||||||||||||||||||||||||||||||
Imputation is the method of creating plausible (but artificial) substitute values for all those missing. |
||||||||||||||||||||||||||||||||||||||||||||
| 18.5.1.1. Imputation rate (un-weighted) (%) by Size class | ||||||||||||||||||||||||||||||||||||||||||||
|
||||||||||||||||||||||||||||||||||||||||||||
| 18.5.1.2. Imputation rate (un-weighted) (%) by NACE | ||||||||||||||||||||||||||||||||||||||||||||
|
||||||||||||||||||||||||||||||||||||||||||||
| 18.5.2. Data compilation methods | ||||||||||||||||||||||||||||||||||||||||||||
|
||||||||||||||||||||||||||||||||||||||||||||
| 18.5.3. Measurement issues | ||||||||||||||||||||||||||||||||||||||||||||
|
||||||||||||||||||||||||||||||||||||||||||||
| 18.5.4. Weighting and estimation methods | ||||||||||||||||||||||||||||||||||||||||||||
|
||||||||||||||||||||||||||||||||||||||||||||
| 18.6. Adjustment | ||||||||||||||||||||||||||||||||||||||||||||
Not requested. |
||||||||||||||||||||||||||||||||||||||||||||
| 18.6.1. Seasonal adjustment | ||||||||||||||||||||||||||||||||||||||||||||
Not requested. |
||||||||||||||||||||||||||||||||||||||||||||
|
|||
The documents in Annex shows how se compute the various response rates presented in this document. Annexes: Formulas for the quality report |
|||
|
|||
|
|||