|
 |
| For any question on data and metadata, please contact: Eurostat user support |
|
|||
| 1.1. Contact organisation | Statistical Office of the Republic of Slovenia (SURS) |
||
| 1.2. Contact organisation unit | Department for Transport, Tourism and Information Society Statistics |
||
| 1.5. Contact mail address | Litostrojska cesta 54, 1000 Ljubljana, Slovenija |
||
|
|||
| 2.1. Metadata last certified | 13/03/2024 | ||
| 2.2. Metadata last posted | 13/03/2024 | ||
| 2.3. Metadata last update | 13/03/2024 | ||
|
|||
| 3.1. Data description | |||
Data on the Information and Communication Technologies (ICT) usage and e-commerce in enterprises are survey data. They are collected by the National Statistical Institutes or Ministries and are in principle based on Eurostat's annual model questionnaires on ICT usage and e-commerce in enterprises. Large part of the data collected is used to measure the progress in the implementation of one of the main political priorities of the European Commission for 2019 to 2024 – A Europe fit for the digital age. Part of this is the "European strategy for data", envisioning a single market for data to ensure the EU's global competitiveness and data sovereignty, in which context a comprehensive set of new rules for all digital services was proposed: the Digital Services Act and the Digital Markets Act, which are centrepieces of the EU digital strategy. Furthermore, the Commission and the High Representative of the Union for Foreign Affairs and Security Policy presented a new “EU cybersecurity strategy”, which is intended to bolster the EU's collective resilience against cyber threats, safeguard a global and open internet and protect EU values and the fundamental rights of its people. Furthermore, data will allow monitoring the progress towards A Europe fit for the digital age, one of the six priorities for the period 2019-2024 of the von der Leyen European Commission. The aim of the European survey on ICT usage and e-commerce in enterprises is to collect and disseminate harmonised and comparable information at European level.
|
|||
| 3.2. Classification system | |||
| 3.3. Coverage - sector | |||
All economic activities in the scope of Annex I of the Commission Regulation are intended to be included in the general survey, covering enterprises with 10 or more employees and self-employed persons. These activities are: NACE Rev. 2 sections C, D, E, F, G, H, I, J, L, M and N, division 95.1. For micro-enterprises see the sub-concepts below. |
|||
| 3.3.1. Coverage-sector economic activity for micro-enterprises - All NACE Rev. 2 categories are covered | |||
| 3.3.2. Coverage sector economic activity for micro-enterprises - If not all activities were covered, which ones were covered? | |||
Micro-enterprises are not included in the survey. |
|||
| 3.4. Statistical concepts and definitions | |||
The model questionnaire on ICT usage and e-commerce in enterprises provides a large variety of variables covering among others the following areas: - Access to and use of the Internet - E-commerce and e-business - Use of cloud computing services - Artificial Intelligence - Other topics: Data utilisation, sharing, analytics and trading, Invoicing. The annual model questionnaires and the European businesses statistics compliers’ manual for ICT usage and e-commerce in enterprises comprise definitions and explanations regarding the topics of the survey. |
|||
| 3.5. Statistical unit | |||
Statistical unit used is enterprise. In majority of cases, enterprise equals legal unit. 15 enterprises were comprised of more than one legal unit. |
|||
| 3.6. Statistical population | |||
Target Population As required by Annex of the Commission Implementing Regulation, enterprises with 10 or more employees and self-employed persons shall be covered by the survey. For micro-enterprises see the sub-concepts below. |
|||
| 3.6.1. Coverage of micro-enterprises | |||
| No | |||
| 3.6.2. Breakdown between size classes [0 to 1] and [2 to 9] | |||
| No | |||
| 3.6.3. If for micro-enterprises different size delimitation was used, please indicate it. | |||
Not applicable. |
|||
| 3.7. Reference area | |||
The whole territory of the country was included. Data for a specific set of variables were delivered on NUTS 2 regional level. |
|||
| 3.8. Coverage - Time | |||
Years 2022 and 2023. |
|||
| 3.9. Base period | |||
Not applicable |
|||
|
|||
Percentages of enterprises, Percentages of turnover, Percentages of employees and self-employed persons, Million euro. |
|||
|
|||
The reference period was current usage in 2023 and the whole year 2022. |
|||
|
|||
| 6.1. Institutional Mandate - legal acts and other agreements | |||
Complementary national legislation constituting the legal basis for the survey on the use of ICT in enterprises:
|
|||
| 6.2. Institutional Mandate - data sharing | |||
SURS is transmitting and sharing aggregated data of the survey with Eurostat in accordance with the EU Regulation (Regulation (EU) 2019/2152 of the European Parliament and of the Council of 27 November 2019 on European business statistics, repealing 10 legal acts in the field of business statistics). |
|||
|
|||
| 7.1. Confidentiality - policy | |||
Regulation (EC) No 223/2009 on European statistics (recital 24 and Article 20(4)) of 11 March 2009 (OJ L 87, p. 164), stipulates the need to establish common principles and guidelines ensuring the confidentiality of data used for the production of European statistics and the access to those confidential data with due account for technical developments and the requirements of users in a democratic society. At national level : The National Statistics Act (hereinafter the ZDSta) stipulates within fundamental principles of national statistics in Article 2 that “national statistics shall be implemented on the principles of … confidentiality …”. The principle is concretised in further provisions of the ZDSta, while for explanation one can turn to some international documents. The United Nations Resolution on Fundamental Principles of Official Statistics (adopted by the UN Statistical Commission in 1994 and confirmed by the UN General Assembly on 29 January 2014) determines in Principle 6 that “individual data collected by statistical agencies for statistical compilation, whether they refer to natural or legal persons, are to be strictly confidential and used exclusively for statistical purposes”. |
|||
| 7.2. Confidentiality - data treatment | |||
Data are transmitted via eDamis (encrypted) and delivered to a secure environment where they are treated. Flags are added for confidentiality in case results must not be disclosed. At national level : Data are transmitted via eDamis (encrypted) and delivered to a secure environment where they are treated. National Statistical Institutes are requested to add flags for confidentiality in case results must not be disclosed. All SURS employees are obliged to protect the content of personal and individual data and data on reporting units which they learn during their work as official secrecy. All employees sign a statement of data protection and thus confirm that they are informed about the issue. The obligation to protect the official secrecy continues after the termination of employment. In line with the National Statistics Act (ZDSta) the statistical purpose is providing and disseminating aggregate data on mass phenomena. The ZDSta also stipulates that the data can be used exclusively for statistical purposes, i.e. for disseminating aggregate data, unless otherwise provided by law. On the basis of an application written by a user, individual data can be transmitted, but only in the form and way which does not enable the identification of the unit to which the data refer. The data that enable the identification of the unit to which they refer can only be transmitted to those units to which the data refer or if these units sent the data. SURS can publish the data only in aggregate form, so that it is not possible to identify the unit to which the data refer. The data must be available in the same way (at the same time and under the same conditions) to all users. Only exceptionally can SURS publish individual data: upon written consent of the reporting unit to which the data refer that they agree with the publication of data in such a way or if the data are collected from public (generally accessible) data collections (records, registers, databases, etc.). Click for more info on our website here and here. |
|||
|
|||
| 8.1. Release calendar | |||
A release calendar for the statistical outputs ia avaialble and publicly accessible. |
|||
| 8.2. Release calendar access | |||
The release calendar is available here.
|
|||
| 8.3. Release policy - user access | |||
SURS provides access to official statistical data to all users. The latest statistical data are published in press releases every workday at 10:30 on the date announced in advance in the Release Calendar. The calendar also includes releases of authorised producers of national statistics, i.e. the National Institute of Public Health and the Bank of Slovenia. The dates of first releases are announced a year in advance, usually in November for the coming year. During the year, SURS prepares and publishes – depending on current events – special and experimental releases, which are also announced in the Release Calendar. Users can subscribe to receiving a weekly calendar on their e-mails every Monday at 9:00. Press releases are published in Slovenian and English language. SURS makes sure that results of statistical surveys are presented in an unbiased, objective, clear and understandable way. It is important that the published data are of high quality, timely, and internationally comparable. ICT statistics follows the described practices. Regular press releases are published in the Release Calendar one year in advance (3 press releases). SURS also publishes special releases on the topic of ICT – on World Telecommunication and Information Society Day and Safer Internet Day. |
|||
|
|||
Annual |
|||
|
|||
| 10.1. Dissemination format - News release | |||
|
|||
| 10.2. Dissemination format - Publications | |||
Non-applicable. Data are published in online database. |
|||
| 10.3. Dissemination format - online database | |||
See detailed section 10.3.1. |
|||
| 10.3.1. Data tables - consultations | |||
Results for selected variables collected in the framework of this survey are available for all participating countries on Digital economy and society of Eurostat website. At national level : Results for selected variables collected in the framework of this survey are available at national level in Sistat database. |
|||
| 10.4. Dissemination format - microdata access | |||
Access to the micro data can be provided according to the established rules and procedures to researches. https://www.stat.si/StatWeb/en/StaticPages/Index/for-researchers |
|||
| 10.5. Dissemination format - other | |||
Not requested |
|||
| 10.5.1. Metadata - consultations | |||
Not requested |
|||
| 10.6. Documentation on methodology | |||
SURS prepares and publishes on the website the following documentation on methodology: |
|||
| 10.6.1. Metadata completeness - rate | |||
Not requested |
|||
| 10.7. Quality management - documentation | |||
Quality report is published on the website - Theme: Development and Technology; Sub-theme: Digital Society. |
|||
|
|||
| 11.1. Quality assurance | |||
The European businesses statistics compliers’ manual for ICT usage and e-commerce in enterprises provides guidelines and standards for the implementation of the surveys. It is updated every year according to the changed contents of the model questionnaires. At national level : The Statistical Office of the Republic of Slovenia operates on the basis of the National Statistics Act and Regulation (EC) No. 223/2009 on European statistics; in performing its tasks it follows the general principles of quality management, the European Statistics Code of Practice and the Fundamental Principles of Official Statistics. In line with the stated, SURS declares that it takes into account the following principles: professional independence, process orientation, quality of products and services, planning of improvements, stimulating working environment for employees, data providers-friendly official statistics, user-oriented official statistics. The principles are more in detail presented in the Quality Statement of the Statistical Office of the Republic of Slovenia. Work at SURS is process-oriented. This means that different departments (which have appropriate skills and experiences) take care of different parts of the process and every process has a special monitoring system. The project manager additionally oversees all the phases of conducting the survey. • Preparation of the survey (translation and preparation of the model questionnaire, etc.) • Sampling design • Fieldwork • Data review, data entry, data processing, editing and grossing-up • Aggregation/tabulation of data • Publication of the data and preparation of the data for detailed data publication • Preparation of reports |
|||
| 11.2. Quality management - assessment | |||
European level : At European level, the recommended use of the annual Eurostat model questionnaire aims at improving comparability of the results among the countries that conduct the survey on ICT usage and e-commerce in enterprises. Moreover, the Methodological Manual provides guidelines and clarifications for the implementation of the surveys. National level : The quality of statistical data used to be dealt with mostly in connection with data accuracy in the narrow sense (as coherence between statistical data and exact values). Quality is dealt with in terms of quality dimensions: relevance, accuracy of estimates, timeliness and punctuality of publication, accessibility and clarity of information, comparability of statistics and coherence of results. SURS regularly publishes reports on the quality of statistical surveys, which contain detailed descriptions of individual statistical surveys regarding all quality dimensions. Quality reports also contain the values of quality indicators, i.e. numerical values of achieved quality levels for individual quality components. The survey has a satisfactory quality. The biggest challenge is the formulation of questions. Due to technological advances and the content of the survey, these are often technical and difficult to understand by respondents – employees and self employed who have different digital skills. Due to this reason, we cognitively test the new questions. |
|||
|
|||
| 12.1. Relevance - User Needs | |||
European level : At European level, European Commission users (e.g. DG CNECT, DG GROW, DG JUST, DG REGIO, DG JRC) are the principal users of the data on ICT usage and e-commerce in enterprises and contribute in identifying/defining the topics to be covered. Hence, main users are consulted regularly (at hearings, task forces, ad hoc meetings) for their needs and are involved in the process of the development of the model questionnaires at a very early stage. User needs are considered throughout the whole discussion process of the model questionnaires aiming at providing relevant statistical data for monitoring and benchmarking of European policies. National level : User needs are considered throughout the whole discussion process of the model questionnaires aiming at providing relevant statistical data for monitoring and benchmarking of European policies. National users were consulted before the 2023 questionnaire was finalised. They expressed needs for more data on the level of the digitalisation in enterprises. |
|||
| 12.2. Relevance - User Satisfaction | |||
European level : At European level, contacts within the Commission, the OECD and other stakeholders give a clear picture about the key users' satisfaction as to the following data quality aspects: accuracy and reliability of results, timeliness, satisfactory accessibility, clarity and comparability over time and between countries, completeness and relevance. Overall users have evaluated positively (good, very good) the data quality on the ICT usage and e-commerce in enterprises. National level : Direct communication with users takes place at the meetings of the Working Group on Information Society Statistics at Eurostat and the OECD and at the meetings of the statistical advisory committees group - the Statistical advisory committee for Digital Society Statistics. The members are representatives of key data users: from the public sector (Ministry of public administration), scientific sphere (University of Maribor) and they meet every 18 months. The last meeting of the panel was on 14 April 2022. More information on the content of committee is available at: http://www.stat.si/statweb/NationalStatistics/AdvCommitteesDescription/91. |
|||
| 12.3. Completeness | |||
Detailed information is available in “ Annex I _ Completeness “ excel file - related to questionnaire, coverage, additional questions. |
|||
| 12.3.1. Data completeness - rate | |||
Not requested. |
|||
|
||||||||||||||||||||||||||||||||||||||||||||||||||
| 13.1. Accuracy - overall | ||||||||||||||||||||||||||||||||||||||||||||||||||
Comments on reliability and representativeness of results and completeness of dataset These comments reflect overall standard errors reported for the indicators and breakdowns in section 13.2.1 (Sampling error - indicators) and the rest of the breakdowns for national and European aggregates, as well as other accuracy measurements. The estimated standard error should not exceed 2pp for the overall proportions and should not exceed 5pp for the proportions related to the different subgroups of the population (for those NACE aggregates for the calculation and dissemination of national aggregates). If problems were found, these could have implications for future surveys (e.g. need to improve sampling design, to increase sample sizes, to increase the response rates). More detailed information is available in “ Annex II. _ Accuracy “ excel file - related to European aggregates, comments on reliability and use of flag. |
||||||||||||||||||||||||||||||||||||||||||||||||||
| 13.2. Sampling error | ||||||||||||||||||||||||||||||||||||||||||||||||||
For calculation of the standard error see 13.2.1.1. |
||||||||||||||||||||||||||||||||||||||||||||||||||
| 13.2.1. Sampling error - indicators | ||||||||||||||||||||||||||||||||||||||||||||||||||
Standard error (for selected indicators and breakdowns) Precision measures related to variability due to sampling, unit non-response (the size of the subset of respondents is smaller than the size of the original sample) and other (imputation for item non-response, calibration etc.) are not (yet) required from the Member states for all indicators. Eurostat will make basic assumptions to compute these measures for all indicators produced (e.g. stratified random sampling assuming as strata the crossing of the variables “Number of employees and self-employed persons” and “Economic Activity” as it was defined in the 3 tables of section 18.1). More detailed information is available in“ Sample and standard error tables 2023 “ excel file – worksheets starting with “Standard error". |
||||||||||||||||||||||||||||||||||||||||||||||||||
| 13.2.1.1. Sampling error indicator calculation | ||||||||||||||||||||||||||||||||||||||||||||||||||
Calculation of the standard error Various methods can be used for the calculation of the standard error for an estimated proportion. The aim is to incorporate into the standard error the sampling variability but also variability due to unit non-response, item non-response (imputation), calibration etc. In case of census / take-all strata, the aim is to calculate the standard errors comprising the variability due to unit non-response and item non-response.
|
||||||||||||||||||||||||||||||||||||||||||||||||||
| 13.3. Non-sampling error | ||||||||||||||||||||||||||||||||||||||||||||||||||
See detailed sections below. |
||||||||||||||||||||||||||||||||||||||||||||||||||
| 13.3.1. Coverage error | ||||||||||||||||||||||||||||||||||||||||||||||||||
See concept 18.1.1. A) Description of frame population. |
||||||||||||||||||||||||||||||||||||||||||||||||||
| 13.3.1.1. Over-coverage - rate | ||||||||||||||||||||||||||||||||||||||||||||||||||
Over-coverage was 0.05%. |
||||||||||||||||||||||||||||||||||||||||||||||||||
| 13.3.1.2. Common units - proportion | ||||||||||||||||||||||||||||||||||||||||||||||||||
Not requested |
||||||||||||||||||||||||||||||||||||||||||||||||||
| 13.3.2. Measurement error | ||||||||||||||||||||||||||||||||||||||||||||||||||
No measurement errors. |
||||||||||||||||||||||||||||||||||||||||||||||||||
| 13.3.3. Non response error | ||||||||||||||||||||||||||||||||||||||||||||||||||
See detailed sections below. |
||||||||||||||||||||||||||||||||||||||||||||||||||
| 13.3.3.1. Unit non-response - rate | ||||||||||||||||||||||||||||||||||||||||||||||||||
See detailed sub-concepts below. |
||||||||||||||||||||||||||||||||||||||||||||||||||
| 13.3.3.1.1. Unit response | ||||||||||||||||||||||||||||||||||||||||||||||||||
The following table contains the number of units (i.e. enterprises), by type of response to the survey and by the percentage of these values in relation to the gross sample size.
|
||||||||||||||||||||||||||||||||||||||||||||||||||
| 13.3.3.1.2. Methods used for minimizing unit non-response | ||||||||||||||||||||||||||||||||||||||||||||||||||
Enterprises were requested to fill out a web version of the questionnaire via eSTAT application. The web questionnaire included some basic controls which alerted respondents in case of inconsistent or illogical answers. The intention of the controls was to increase the quality of provided data. The selected sample included: enterprises that were already registered in the eSTAT application, which is a condition for filling out the web questionnaire and enterprises that had to register prior to completing the questionnaire. Enterprises already registered - received information/invitation via post that they were selected into the survey and that the web questionnaire is prepared and can be filled out. An e-mail was also sent to the person who was designated by the enterprise as contact person for e-reporting providing. Enterprises not yet registered received via conventional post two separate deliveries: user name with information that they were selected into the survey and instructions how to register in eSTAT and in separate delivery the password for registration. After the deadline we sent a reminder (via e-mail or regular post, if no e-mail address was available) to enterpises. To comply with the enterprise’s needs questionnaires in pdf format was prepared and published on our website. We called enterprises that did not fill out the web questionnaire and requested them to fill out the web questionnaire. |
||||||||||||||||||||||||||||||||||||||||||||||||||
| 13.3.3.1.3. Methods used for unit non-response treatment | ||||||||||||||||||||||||||||||||||||||||||||||||||
|
||||||||||||||||||||||||||||||||||||||||||||||||||
| 13.3.3.1.4. Assessment of unit non-response bias | ||||||||||||||||||||||||||||||||||||||||||||||||||
Not applicable. |
||||||||||||||||||||||||||||||||||||||||||||||||||
| 13.3.3.2. Item non-response - rate | ||||||||||||||||||||||||||||||||||||||||||||||||||
Not applicable. |
||||||||||||||||||||||||||||||||||||||||||||||||||
| 13.3.3.2.1. Methods used for item non-response treatment | ||||||||||||||||||||||||||||||||||||||||||||||||||
|
||||||||||||||||||||||||||||||||||||||||||||||||||
| 13.3.3.2.2. Questions or items with item response rates below 90% and other comments | ||||||||||||||||||||||||||||||||||||||||||||||||||
Other comments relating to the item non-response
|
||||||||||||||||||||||||||||||||||||||||||||||||||
| 13.3.4. Processing error | ||||||||||||||||||||||||||||||||||||||||||||||||||
There were no processing errors. |
||||||||||||||||||||||||||||||||||||||||||||||||||
| 13.3.5. Model assumption error | ||||||||||||||||||||||||||||||||||||||||||||||||||
Not requested |
||||||||||||||||||||||||||||||||||||||||||||||||||
|
|||
| 14.1. Timeliness | |||
See detailed section below. |
|||
| 14.1.1. Time lag - first result | |||
Not applicable |
|||
| 14.1.2. Time lag - final result | |||
European level : Data are to be delivered to Eurostat in the fourth quarter of the reference year (due date for the finalised dataset is 5th October). European results are released before the end of the survey year or in the beginning of the year following the survey year (T=reference year, T+0 for indicators referring to the current year, T+12 months for other indicators referring to the previous year e.g. e-commerce). At national level : Data were released on the 5th October 2023. |
|||
| 14.2. Punctuality | |||
See detailed section below. |
|||
| 14.2.1. Punctuality - delivery and publication | |||
Aggregated data for 2023 were delivered on the day of the deadline. |
|||
|
|||
| 15.1. Comparability - geographical | |||
The model questionnaire is generally used by the countries that conduct the survey on ICT usage and e-commerce in enterprises. Due to (small) differences in translation, in the used survey vehicle, in non-response treatment or different routing through the questionnaire, some results for some countries may be of reduced comparability. In these cases, notes are added in the data. Detailed information on differences in the wording of the questions in the national questionnaires is available in “ Annex I _ Completeness “ excel file - related to questionnaire, coverage, additional questions.
Data for specific set of variables were delivered on NUTS 2 regional level. There is no problem of comparability across the country’s regions.
|
|||
| 15.1.1. Asymmetry for mirror flow statistics - coefficient | |||
Not applicable |
|||
| 15.2. Comparability - over time | |||
See section below. |
|||
| 15.2.1. Length of comparable time series | |||
The length of comparable time series depends on the module and the variable considered within each survey module. Additional information is available in annexes attached to the European metadata. Data from 2023 are comperable with data from 2021 (if variables were collected). |
|||
| 15.3. Coherence - cross domain | |||
Not applicable |
|||
| 15.3.1. Coherence - sub annual and annual statistics | |||
Not applicable |
|||
| 15.3.2. Coherence - National Accounts | |||
Not applicable |
|||
| 15.4. Coherence - internal | |||
Not applicable |
|||
|
|||
| Restricted from publication | |||
|
|||
| 17.1. Data revision - policy | |||
Users are informed about data revisions. Annually, usually in January, SURS prepares the list of statistical surveys subject to planned revision of statistical data (Slovene only). Users are also informed when the data are released. Each data release contains information about the status of published data: they can be final or provisional data or experimental statistics. The exception is national and regional accounts data. In publishing these data, the status is marked as “no status”. After publishing provisional data, final data are always published. As regards the SiStat Database, the status of data is stated in table titles if the data are provisional or if this is experimental statistics. If the status in not stated, the data are final. In the SiStat Database, the latest version of revised data always replaces the older. https://www.stat.si/dokument/5299/RevisionOfStatisticalDataMEgeneral.pdf |
|||
| 17.2. Data revision - practice | |||
No data were revised in 2023. |
|||
| 17.2.1. Data revision - average size | |||
Not requested |
|||
|
||||||||||
| 18.1. Source data | ||||||||||
A) Frame population description and distribution For more information see concept 18.1.1.
B) Sampling design - Sampling method Description of the sampling method used (e.g. stratified random sample, quota sampling, cluster sampling; one-stage or two-stage sampling) and information which variables were used to stratify, the categories of those variables, in particular for the NACE Rev. 2 categories related to the "possible calculation of European aggregates", and the final number of strata: The sampling unit was the statistical unit enterprise. Sampling design was stratified sampling (SRS within each stratum). Coordinated sampling was used. Activity group and size class was used as stratification variables. All large enterprises and a quarter of enterprises with the highest turnover in the strata were defined as Key Units (a third of sample) and were included in the survey. Specific enterprises that were identified as key enterprises in a specific activity (e.g. enterprises with specific business model or with dominant role in e-commerce) were also included in the survey. These enterprises will have a weight of 1 and will represent only themselves in the grossed-up population.
C) Gross sample distribution More detailed information is available in “ Sample and standard error tables 2023 “ excel file (Worksheet: GROSS SAMPLE)
D) Net sample distribution More detailed information is available in “ Sample and standard error tables 2023 “ excel file (Worksheet: NET SAMPLE) |
||||||||||
| 18.1.1. Population frame | ||||||||||
A) Description of frame population
B) Frame population distribution More detailed information is available in “ Sample and standard error tables 2023 “ excel file (Worksheet: FRAME POPULATION) |
||||||||||
| 18.2. Frequency of data collection | ||||||||||
Annual |
||||||||||
| 18.3. Data collection | ||||||||||
See detailed sections below. |
||||||||||
| 18.3.1. Survey period | ||||||||||
|
||||||||||
| 18.3.2. Survey vehicle – general survey | ||||||||||
| General survey - Stand-alone survey | ||||||||||
| 18.3.3. Survey vehicle – micro-enterprises | ||||||||||
| The collection of micro-enterprises was integrated with the general survey | ||||||||||
| 18.3.4. Survey type | ||||||||||
The survey was a web survey. Enterprises were asked to fill out electronic version of the questionnaire in the eSTAT application. |
||||||||||
| 18.3.5. Survey participation | ||||||||||
| Mandatory | ||||||||||
| 18.4. Data validation | ||||||||||
Data are validated during the transmission process according to Eurostat's standards. Data were edited with individual corrections – enterprises were contacted and requested to confirm the validity of provided data or to provide corrected or missing data. |
||||||||||
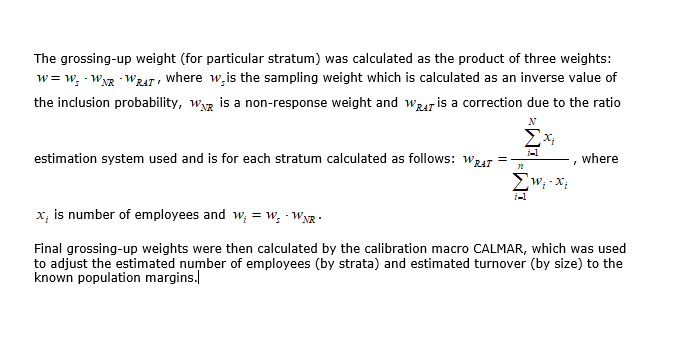
| 18.5. Data compilation | ||||||||||
Grossing-up procedures
|
||||||||||
| 18.5.1. Imputation - rate | ||||||||||
|
||||||||||
| 18.6. Adjustment | ||||||||||
Not applicable |
||||||||||
| 18.6.1. Seasonal adjustment | ||||||||||
Not applicable |
||||||||||
|
||||||||||
Problems encountered and lessons to be learnt: |
||||||||||
| 19.1. Documents | ||||||||||
|
||||||||||
|
|||
|
|||
| Annex II_Accuracy_SI Estimation_approach_SI Grossing-up_SI Methodology_2023_SI National_rules_flags_SI Questionnaire_2023_SI Completeness Sample and standard error tables 2023 |
|||