Reference metadata describe statistical concepts and methodologies used for the collection and generation of data. They provide information on data quality and, since they are strongly content-oriented, assist users in interpreting the data. Reference metadata, unlike structural metadata, can be decoupled from the data.
Regional Statistical Office in Szczecin, Centre for Science Technology Innovation and Information Society Statistics
ul. Jana Matejki 22
70-530 Szczecin
1.3. Contact name
Confidential because of GDPR
1.4. Contact person function
Confidential because of GDPR
1.5. Contact mail address
ul. Jana Matejki 22, 70-530 Szczecin
1.6. Contact email address
Confidential because of GDPR
1.7. Contact phone number
Confidential because of GDPR
1.8. Contact fax number
Confidential because of GDPR
2.1. Metadata last certified
17 March 2026
2.2. Metadata last posted
17 March 2026
2.3. Metadata last update
17 March 2026
3.1. Data description
Data on the Information and Communication Technologies (ICT) usage and e-commerce in enterprises are survey data. They are collected by the National Statistical Institutes or Ministries and are in principle based on Eurostat's annual model questionnaires on ICT usage and e-commerce in enterprises.
The legal basis for ICT enterprise statistics for survey year 2025 is Commission Implementing Regulation (EU) 2024/1883 of 9 July 2024 laying down the technical specifications of data requirements for the topic 'ICT usage and e-commerce' for the reference year 2025. Large part of the data collected is used to support measuring the implementation and monitoring of the EU’s digital targets for 2030, set by the Digital Decade Policy Programme.
Four of the key performance indicators (KPIs) of the current programme stem from the statistics for which the implementing and delegated acts are enclosed for adoption: Artificial Intelligence, cloud, data analytics and the digital intensity index (DII) - a composite indicator reflecting the digital transformation of business
The aim of the European survey on ICT usage and e-commerce in enterprises is to collect and disseminate harmonised and comparable information at European level.
All economic activities in the scope of Annex of the Commission Regulation are intended to be included in the general survey, covering enterprises with 10 or more employees and self-employed persons. These activities are:
Section C - “Manufacturing”
Section D, E - “Electricity, gas, steam and air conditioning supply”, “Water supply, sewerage, waste management and remediation activities”
Section F - “Construction”
Section G - “Wholesale and retail trade; repair of motor vehicles and motorcycles”
Section H - “Transportation and storage”
Section I - “Accommodation and food service activities”
Section J - “Information and communication”
Section L - “Real estate activities”
Section M - “Professional, scientific and technical activities”
Section N - "Administrative and support service activities"
Group 95.1 - “Repair of computers and communication equipment”.
For micro-enterprises see the sub-concepts in the full metadata view.
3.3.1. Coverage-sector economic activity for micro-enterprises - All NACE Rev. 2 categories are covered
Micro-enterprises are not included in the survey
3.3.2. Coverage sector economic activity for micro-enterprises - If not all activities were covered, which ones were covered?
Not applicable.
3.4. Statistical concepts and definitions
The model questionnaire on ICT usage and e-commerce in enterprises provides a large variety of variables covering among others the following topics:
Access and use of the Internet
E-commerce sales
Data utilisation and analytics
Use of cloud computing services
Artificial intelligence
ICT and the environment.
The annual model questionnaires and the European businesses statistics compliers’ manual for ICT usage and e-commerce in enterprises comprise definitions and explanations regarding the topics of the survey.
As required by Annex of the Commission Implementing Regulation, enterprises with 10 or more employees and self-employed persons are covered by the survey.
For micro-enterprises see the sub-concepts below.
3.6.1. Coverage of micro-enterprises
No
3.6.2. Breakdown between size classes [0 to 1] and [2 to 9]
No
3.6.3. If for micro-enterprises different size delimitation was used, please indicate it.
Not applicable.
3.7. Reference area
Detailed information on the provision of data on NUTS 2 regional level is available in “Annex I. Completeness“.
All territory of country is covered. Currently data on NUTS 2 are no transmitted to Eurostat.
3.8. Coverage - Time
Years 2024 and 2025.
3.9. Base period
Not applicable
Percentages of enterprises, Percentages of turnover, Percentages of employees and self-employed persons, Million euro (for selected indicators in some countries).
Where not specified the reference period is current situation (survey period in 2025). Year 2024 for the value or % of sales data and where specified.
6.1. Institutional Mandate - legal acts and other agreements
Complementary national legislation constituting the legal basis for the survey on the use of ICT in enterprises:
Act of 29 June 1995 on Official Statistics and the annual regulations of the Council of Ministers concerning the programme of statistical surveys of official statistics.
Regulation (EC) No 223/2009 on European statistics (recital 24 and Article 20(4)) of 11 March 2009 (OJ L 87, p. 164), stipulates the need to establish common principles and guidelines ensuring the confidentiality of data used for the production of European statistics and the access to those confidential data with due account for technical developments and the requirements of users in a democratic society.
At national level:
Act of 29 June 1995 on Official Statistics includes general rules for confidentiality policy.
Data are transmitted via eDamis (encrypted) and delivered to a secure environment where they are treated. Flags are added for confidentiality in case results must not be disclosed.
At national level:
In case of variables which unit_measure is ' Million National Currency', breakdown is marked as confidential where share of value of one enterprise in breakdown is at least 75% of total. If the risk of identification of enterprise exist e.g because of addition, subtraction of values, additional breakdowns are hidden.
In case variables concerning e-sales, e-purchases if total number of enterprises in breakdown is 1 or 2 then it is marked as confidential.
Confidentiality of data is ensured. Indicators are not published if there is a risk of breach of confidentiality.
8.1. Release calendar
Editorial Title-Plan of the Statistics Poland is created for every year. It is publicly accessible.
First, a press release containing the most important indicators is published. Then the main publication is published and the databases are updated. Access to all publications is free.
Results for selected variables collected in the framework of this survey are available for all participating countries on Digital economy and society of Eurostat website.
Microdata are not publicly available. Access to anonymized data may be granted upon request.
10.5. Dissemination format - other
Not requested
10.5.1. Metadata - consultations
Not requested
10.6. Documentation on methodology
The European businesses statistics compilers’ manual for ICT usage and e-commerce in enterprises provides guidelines and clarifications for the implementation of the surveys.
All procedures applied for quality management are consistent with The European businesses statistics compilers’ manual for ICT usage and e-commerce in enterprises.
11.1. Quality assurance
The European businesses statistics compliers’ manual for ICT usage and e-commerce in enterprises provides guidelines and standards for the implementation of the surveys. It is updated every year according to the changed contents of the model questionnaires.
The European businesses statistics compliers’ manual for ICT usage and e-commerce in enterprises provides guidelines and standards for the implementation of the surveys in the Member States. It is updated every year according to the changed contents of the model questionnaires. Survey is based on European businesses statistics compliers’ manual for ICT usage and e-commerce in enterprises.
11.2. Quality management - assessment
At European level, the recommended use of the annual Eurostat model questionnaire aims at improving comparability of the results among the countries that conduct the survey on ICT usage and e-commerce in enterprises. Moreover, the European businesses statistics compilers’ manual for ICT usage and e-commerce in enterprises provides guidelines and clarifications for the implementation of the surveys.
At national level:
European methodology for quality assessment is applied. Any national methodology is not applied.
12.1. Relevance - User Needs
At national level the survey is included in annual regulation of the Council of Ministers concerning the programme of statistical surveys of official statistics. A draft regulation is consulted with main groups of users (local and central entities of public administration i.e. Ministry of Digitalization, Ministry of Economic Development and Technology, Ministry of Development Funds and Regional Policy). Users are allowed to make proposals of topics which should be covered in survey. All proposals are discussed with Regoional Statistical Office in Szczecin. Accepted proposals (after examination of respondent's burden and substantive recognition of the proposal) are included in questionnaire as national level questions. Every year there are some requests for more detailed regional statistics which are not fulfilled due to costs (sample adjustment). Big interest for ICT survey idicators is showed by institutions of private sector, educational institutions (e.g universities) and individuals (e.g. students). Big interest is also noted for ICT sector data (e.g. for NUTS 2: employment,R&D expunditures).
12.2. Relevance - User Satisfaction
At national level data users can express satisfaction during the consultation of annual regulation of the Council of Ministers concerning the programme of statistical surveys of official statistics. Any dedicated satisfaction surveys are not conducted.
12.3. Completeness
Detailed information is available in “ Annex I. Completeness “ - related to questionnaire, coverage, additional questions, regional data.
12.3.1. Data completeness - rate
Not requested
13.1. Accuracy - overall
Comments on reliability and representativeness of results and completeness of dataset
These comments reflect overall standard errors reported for the indicators and breakdowns in section 13.2.1 (Sampling error - indicators) and the rest of the breakdowns for national and European aggregates, as well as other accuracy measurements. The estimated standard error should not exceed 2pp for the overall proportions and should not exceed 5pp for the proportions related to the different subgroups of the population (for those NACE aggregates for the calculation and dissemination of national aggregates). If problems were found, these could have implications for future surveys (e.g. need to improve sampling design, to increase sample sizes, to increase the response rates).
Detailed information is available in “ Annex II. Accuracy “ - related to European aggregates, comments on reliability and use of flag.
13.2. Sampling error
For calculation of the standard error see concept 13.2.1.1.
13.2.1. Sampling error - indicators
Standard error (for selected indicators and breakdowns)
Precision measures related to variability due to sampling, unit non-response (the size of the subset of respondents is smaller than the size of the original sample) and other (imputation for item non-response, calibration etc.) are not (yet) required from the Member States for all indicators.
Detailed information is available in“ Annex III. Sample and standard error tables 2025 “ – worksheets starting with “Standard error".
13.2.1.1. Sampling error indicator calculation
Calculation of the standard error
Various methods can be used for the calculation of the standard error for an estimated proportion. The aim is to incorporate into the standard error the sampling variability but also variability due to unit non-response, item non-response (imputation), calibration etc. In case of census / take-all strata, the aim is to calculate the standard errors comprising the variability due to unit non-response and item non-response.
Name and brief description of the applied estimation approach:
Linearization method one-step diagram was used to calculate precision of data.
B) Basic formula:
Variance estimator
Standard error
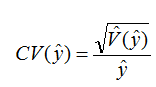
Coefficient Variation
Main reference in the literature:
Särndal C.-E., Swensson B., Wretman J., Model Assisted Survey Sampling, Springer-Verlag, New York 1992
Cochran W.G, Sampling Techniques, John Wiley & Sons Inc., New York 1977
How has the stratification been taken into account?
The variables used for stratification are: the economy activity (NACE rev2, 25 categories, RD variable) and size of enterprise (as number of persons employed, 3 categories, WLK variable). All large enterprises (with more than 249 employees) and all entities from WLK * RD stratas, whose N is less than 200, are included in the sample. The rest of the sample is allocated in WON * NTS1 * WLK * RD stratas (WON and NTS1 are territory codes to ensure that enterprises from all country will be chosen) by solving the following formula : nh = 0.6 * (allocation proportional to the size of the strata) + 0.4 * (allocation to square root of the number of elements in given strata). The use of such a method of sample allocation gives a slight over-representation of the smallest stratas at the expense of the larger ones - it has been used to improve precision - especially in small breakdowns.
Legend:
RD - NACE rev.2 class code
WLK - size class code
NTS1- territory level-1 class code
WON - territory level-2 class code
Which strata have been considered? Please see section above.
13.3. Non-sampling error
See detailed sections below.
13.3.1. Coverage error
See concept 18.1.1. A) Description of frame population.
13.3.1.1. Over-coverage - rate
0.74%
13.3.1.2. Common units - proportion
Not requested
13.3.2. Measurement error
No measurement errors were detected.
13.3.3. Non response error
See detailed sections below.
13.3.3.1. Unit non-response - rate
See detailed sections below.
13.3.3.1.1. Unit response
The following table contains the number of units (i.e. enterprises), by type of response to the survey and by the percentage of these values in relation to the gross sample size.
Type of response
Enterprises
0-9 (or 2-9) employees and self-employed persons
10 or more employees and self-employed persons
Number
%
Number
%
Gross sample size (as in section 3.1 C)
-
100%
26887
100%
1. Response (questionnaires returned by the enterprise)
-
-
18801
69.9
1.1 Used for tabulation and grossing up (Net sample or Final Sample; as in section 3.1 D)
-
-
18406
68.4
1.2 Not used for tabulation
-
-
395
1.5
1.2.1 Out of scope (deaths, misclassified originally in the target population, etc.)
-
-
197
0.74
1.2.2 Other reasons (e.g. unusable questionnaire)
-
-
198
0.76
2. Non-response (e.g. non returned mail, returned mail by post office)
-
-
8086
30.1
Comments on unit response, if unit response is below 60%
Not applicable.
13.3.3.1.2. Methods used for minimizing unit non-response
In order to reduce unit non-response rate following activities are made:
Invitation letters informing about obligation to fill in the questionnaire are sent to each selected enterprise (majority via e-mail, small amount in paper form). Content of the letter: deadline, information about legal basis and statistical confidentiality, link to pdf questionnaire in order for respondents to acquaint with the survey before statistical portal is open, contact information, information about how data will be used.
During electronical platform is open five reminders are sent automatically followed by additional e-mails or phone calls if necessary.
Enterprises which only opened electronical questionnaire and filled in only basic information (usually only contact information) are monitored and contacted in order to give help with questionnaire.
Request to fulfill questionnaire can be sent as paper notification to the selected groups of enterprises if necessary
13.3.3.1.3. Methods used for unit non-response treatment
1. No treatment for unit non-response
2.1 Treatment by re-weighting: Re-weighting by the sampling design strata considering that non-response is ignorable inside each stratum (the naïve model)
2.2 Treatment by re-weighting: Re-weighting by identified response homogeneity groups (created using sample-level information)
x
2.3 Treatment by re-weighting: Re-weighting through calibration/post-stratification (performed using population information) by the groups used for calibration/post-stratification
3. Treatment by imputation (done distinctly for each variable/item)
4. Method(s) and the model(s) corresponding to the above or other method(s) used for the treatment of unit non-response. (e.g. Re-weighting using Horvitz-Thompson estimator, ratio estimator or regression estimator, auxiliary variables)
13.3.3.1.4. Assessment of unit non-response bias
Response rate was higher then 60%.
13.3.3.2. Item non-response - rate
For X3 variable item non-response- rate was 0.5%
13.3.3.2.1. Methods used for item non-response treatment
1. No treatment for item non-response
2. Deductive imputation An exact value can be derived as a known function of other characteristics.
3. Deterministic imputation (e.g. mean/median, mean/median by class, ratio-based, regression-based, single donor nearest-neighbour) Deterministic imputation leads to estimators with no random component, that is, if the imputation were to be re-conducted, the outcome would be the same.
x
4. Random imputation (e.g. hot-deck, cold-deck) Random imputation leads to estimators with a random component, that is, if the imputation were re-conducted, it would have led to a different result.
5. Re-weighting
6. Multiple imputation In multiple imputation each missing value is replaced (instead of a single value) with a set of plausible values that represent the uncertainty of the right value to impute. Multiple imputation methods offer the possibility of deriving variance estimators by taking imputation into account. The incorporation of imputation into the variance can be easily derived based on variability of estimates among the multiply imputed data sets.
7. Method(s) and the model(s) corresponding to the above or other method(s) used for the treatment of item non-response.
13.3.3.2.2. Questions or items with item response rates below 90% and other comments
Other comments relating to the item non-response
A) Additional issues concerning "item non-response" calculation (e.g. method used in national publications):
Not applicable.
B) Questions and items with low response rates (cut-off value is 90%) and item non-response rate:
Not applicable.
13.3.4. Processing error
No processing errors were detected
13.3.5. Model assumption error
Not requested
14.1. Timeliness
See detailed sections below.
14.1.1. Time lag - first result
Not applicable
14.1.2. Time lag - final result
Data are to be delivered to Eurostat in the fourth quarter of the reference year (due date for the finalised dataset is 5th October). European results are released before the end of the survey year or in the beginning of the year following the survey year (T=reference year, T+0 for indicators referring to the current year, T+12 months for other indicators referring to the previous year e.g. e-commerce).
At national level:
Results were released at national level in December 2025 with time lag T+0 for indicators referring to the current year, T+12 months for other indicators referring to the previous year.
14.2. Punctuality
See detailed section in the full metadata view.
14.2.1. Punctuality - delivery and publication
Data were delivered to Eurostat on 2nd October 2025;0 days before (after) the deadline.
15.1. Comparability - geographical
The model questionnaire is generally used by the countries that conduct the survey on ICT usage and e-commerce in enterprises. Due to (small) differences in translation, in the used survey vehicle, in non-response treatment or different routing through the questionnaire, some results for some countries may be of reduced comparability. In these cases, notes are added in the data.
Detailed information on differences in the wording of the questions in the national questionnaires is available in “ Annex I. Completeness “ - worksheets related to questionnaire, coverage, additional questions.
Comparability between regions:
Data for specific set of variables were delivered on NUTS 2 regional level. There is no problem of comparability across the country's regions.
Detailed information on the provision of data on NUTS 2 regional level is available in “Annex I. Completeness“ – worksheets related to regional data.
15.1.1. Asymmetry for mirror flow statistics - coefficient
Not applicable
15.2. Comparability - over time
See detailed section in the full metadata view.
15.2.1. Length of comparable time series
The length of comparable time series depends on the module and the variable considered within each survey module. Additional information is available in annexes attached to the European metadata.
There are not any issues that may have an impact on the comparability over time of the results delivered to Eurostat.
15.3. Coherence - cross domain
Not applicable
15.3.1. Coherence - sub annual and annual statistics
Not applicable
15.3.2. Coherence - National Accounts
Not applicable
15.4. Coherence - internal
Not applicable
Restricted from publication
17.1. Data revision - policy
Data revision policy is applied in some other domains than ICT statistics.
17.2. Data revision - practice
Data revision is not applied for ICT statistics.
17.2.1. Data revision - average size
Data revision is not applied for ICT statistics.
18.1. Source data
Frame population description and distribution For more information see concept 18.1.1.
Sampling design - Sampling method
Description of the sampling method used (e.g. stratified random sample, quota sampling, cluster sampling; one-stage or two-stage sampling) and information which variables were used to stratify, the categories of those variables, in particular for the NACE Rev. 2 categories related to the "possible calculation of European aggregates", and the final number of strata:
In the first step, a stratified sample is drawn. The sample size fluctuates around 18.4% of the population of N legal units, which, based on the results from previous years, ensured adequate precision of the results in the assumed breakdowns. The variables used for stratification are: the economy activity (NACE rev2, 25 categories, RD variable) and size of legal unit (as number of persons employed, 3 categories, WLK variable). All large legal units (with more than 249 employees) and all legal units from WLK * RD stratas, whose N is less than 200, are included in the sample. The rest of the sample is allocated in WON * NTS1 * WLK * RD stratas (WON and NTS1 are territory codes to ensure that legal units from all country will be chosen) by solving the following formula : nh = 0.6 * (allocation proportional to the size of the strata) + 0.4 * (allocation to square root of the number of elements in given strata). The use of such a method of sample allocation gives a slight over-representation of the smallest stratas at the expense of the larger ones - it has been used to improve precision - especially in small breakdowns.
In the second step if any legal unit from the sample is part of an statistical unit enterprise, then all legal units that are part of that enterprise are selected to the sample.
Gross sample distribution Detailed information is available in “ Annex III. Sample and standard error tables 2025 “ (Worksheet: GROSS SAMPLE)
Net sample distribution Detailed information is available in “ Annex III. Sample and standard error tables 2025 “ (Worksheet: NET SAMPLE)
18.1.1. Sampling design & Procedure frame
A) Description of frame population
a) When was the sample for the ICT usage and e-commerce in enterprise survey drawn?
March 2025
b) Last update of the Business register that was used for drawing the sample of enterprises for the survey:
December 2024
c) Indication if the frame population is the same as, or is in some way coordinated with, the one used for the Structural Business Statistics (different snapshots):
Frame population is in some exent coordinated with SBS Annual Survey (SP Survey). Some of enterprises participate in both surveys.
d) Description if different frames are used during different stages of the statistical process (e.g. frame used for sampling vs. frame used for grossing up):
Only one frame is used.
e) Indication the shortcomings in terms of timeliness (e.g. time lag between last update of the sampling frame and the moment of the actual sampling), geographical coverage, coverage of different subpopulations, data available etc., and any measures taken to correct it, for this survey.
Any relevant shortcomings are not observed.
B) Frame population distribution
Detailed information is available in “ Annex III. Sample and standard error tables 2025 “ (Worksheet: FRAME POPULATION)
18.2. Frequency of data collection
Annual
18.3. Data collection
See detailed sections below.
18.3.1. Survey period
Survey / Collection
Date of sending out questionnaires
Date of reception of the last questionnaire treated
General survey
14 April 2025
25 July 2025
Micro-enterprises
-
-
18.3.2. Survey vehicle – general survey
General survey - Stand-alone survey
18.3.3. Survey vehicle – micro-enterprises
Not applicable
18.3.4. Survey type
It is a the self-report method - web survey accessible via the Statistical Report Portal. Enterprises which don't have online access get possibility to submit paper form. Respondents who have difficulties to answer questions, can make a telephone interview with enumerator.
18.3.5. Survey participation
Mandatory
18.4. Data validation
Before transmitting the dataset, its final validation will be made using the tool prepared by Eurostat. Moreover electronic form and Survey IT System (where paper form are registered) is equipped with a many of restrictive validation rules aimed at reducing the number of errors and data quality checks. There will be two types of validation rules:
hard, which the respondent must meet to submit the form,
light, having the character of reminders, suggestions, the fulfillment of which is not required to submit the form
After closing the Statistical Reporting Portal, the submitted forms will be transferred to Survey IT System too. Access to the full dataset, so it will allow the survey coordinators to analyze the response rate and errors. (generating reports, filtering, searching, etc.). These functionalities will improve work of enumerators, particularly activities related to locating “suspected” enterprises which have:
inconsistent responses comparing to the previous year (any enterprise that submitted a form in the previous edition of the survey will be checked),
inconsistent responses comparing to other surveys (SBS survey) – turnover data will be predefined on an electronic form with the possibility of correction by respondents.
inconsistent responses comparing current market trends e.g. enterprises which do not have Internet access
18.5. Data compilation
Grossing-up procedures
Grossing-up is used to all variables in the survey. There are used standard formulas, for estimators of the parameters, in stratified random sampling. The base weight(primary) of a sampled unit is the reciprocal of its probability of selection into the sample. However, due to unit non-response, primary weights of units which are present in the dataset must be corrected. The correction takes into account the phenomenon of non-response and information about the reasons for not obtaining data from some sampled units. Taking into account the information for the entire sample included in the RA symbols (symbols for participation in the survey), on the level of stratas according to the variables of WLK (3 size classes) and RD (types of activity according to PKD) correction factor is calculated.
Legend:
RD - NACE rev.2 class code
WLK - size class code
NTS1- territory level-1 class code
WON - territory level-2 class code
Correction factor is calculated according to the following formula
The correction factor estimates the proportion of units which should be surveyed in relation to the responded units.
Adjusted weights equal design weights multiplied by the corresponding correction factors.
18.5.1. Imputation - rate
Imputation rate for X3 variable is 0,5%
18.6. Adjustment
Not applicable
18.6.1. Seasonal adjustment
Not applicable
Problems encountered and lessons to be learnt:
There is some inconsistency between the numbers reported in Table 13.3.3.1.1 and the numbers reported in Annex 3 in the gross sample and net sample sheets. This is due to legal units that are formally not in the scope of the survey, but belong to the statistical unit enterprise and submitted the questionnaire. Such legal units were not included in Annex 3 but are included in Table 13.3.3.1.1, row 1.1.
19.1. Documents
Questionnaire in national language
x
Questionnaire in English (if available)
National reports on methodology (if available)
Analysis of key results, backed up by tables and graphs in English (if available)
Data on the Information and Communication Technologies (ICT) usage and e-commerce in enterprises are survey data. They are collected by the National Statistical Institutes or Ministries and are in principle based on Eurostat's annual model questionnaires on ICT usage and e-commerce in enterprises.
The legal basis for ICT enterprise statistics for survey year 2025 is Commission Implementing Regulation (EU) 2024/1883 of 9 July 2024 laying down the technical specifications of data requirements for the topic 'ICT usage and e-commerce' for the reference year 2025. Large part of the data collected is used to support measuring the implementation and monitoring of the EU’s digital targets for 2030, set by the Digital Decade Policy Programme.
Four of the key performance indicators (KPIs) of the current programme stem from the statistics for which the implementing and delegated acts are enclosed for adoption: Artificial Intelligence, cloud, data analytics and the digital intensity index (DII) - a composite indicator reflecting the digital transformation of business
The aim of the European survey on ICT usage and e-commerce in enterprises is to collect and disseminate harmonised and comparable information at European level.
Name of data collection
ICT usage and e-commerce in enterprises
17 March 2026
The model questionnaire on ICT usage and e-commerce in enterprises provides a large variety of variables covering among others the following topics:
Access and use of the Internet
E-commerce sales
Data utilisation and analytics
Use of cloud computing services
Artificial intelligence
ICT and the environment.
The annual model questionnaires and the European businesses statistics compliers’ manual for ICT usage and e-commerce in enterprises comprise definitions and explanations regarding the topics of the survey.
As required by Annex of the Commission Implementing Regulation, enterprises with 10 or more employees and self-employed persons are covered by the survey.
For micro-enterprises see the sub-concepts below.
Detailed information on the provision of data on NUTS 2 regional level is available in “Annex I. Completeness“.
All territory of country is covered. Currently data on NUTS 2 are no transmitted to Eurostat.
Where not specified the reference period is current situation (survey period in 2025). Year 2024 for the value or % of sales data and where specified.
Comments on reliability and representativeness of results and completeness of dataset
These comments reflect overall standard errors reported for the indicators and breakdowns in section 13.2.1 (Sampling error - indicators) and the rest of the breakdowns for national and European aggregates, as well as other accuracy measurements. The estimated standard error should not exceed 2pp for the overall proportions and should not exceed 5pp for the proportions related to the different subgroups of the population (for those NACE aggregates for the calculation and dissemination of national aggregates). If problems were found, these could have implications for future surveys (e.g. need to improve sampling design, to increase sample sizes, to increase the response rates).
Detailed information is available in “ Annex II. Accuracy “ - related to European aggregates, comments on reliability and use of flag.
Percentages of enterprises, Percentages of turnover, Percentages of employees and self-employed persons, Million euro (for selected indicators in some countries).
Grossing-up procedures
Grossing-up is used to all variables in the survey. There are used standard formulas, for estimators of the parameters, in stratified random sampling. The base weight(primary) of a sampled unit is the reciprocal of its probability of selection into the sample. However, due to unit non-response, primary weights of units which are present in the dataset must be corrected. The correction takes into account the phenomenon of non-response and information about the reasons for not obtaining data from some sampled units. Taking into account the information for the entire sample included in the RA symbols (symbols for participation in the survey), on the level of stratas according to the variables of WLK (3 size classes) and RD (types of activity according to PKD) correction factor is calculated.
Legend:
RD - NACE rev.2 class code
WLK - size class code
NTS1- territory level-1 class code
WON - territory level-2 class code
Correction factor is calculated according to the following formula
The correction factor estimates the proportion of units which should be surveyed in relation to the responded units.
Adjusted weights equal design weights multiplied by the corresponding correction factors.
Frame population description and distribution For more information see concept 18.1.1.
Sampling design - Sampling method
Description of the sampling method used (e.g. stratified random sample, quota sampling, cluster sampling; one-stage or two-stage sampling) and information which variables were used to stratify, the categories of those variables, in particular for the NACE Rev. 2 categories related to the "possible calculation of European aggregates", and the final number of strata:
In the first step, a stratified sample is drawn. The sample size fluctuates around 18.4% of the population of N legal units, which, based on the results from previous years, ensured adequate precision of the results in the assumed breakdowns. The variables used for stratification are: the economy activity (NACE rev2, 25 categories, RD variable) and size of legal unit (as number of persons employed, 3 categories, WLK variable). All large legal units (with more than 249 employees) and all legal units from WLK * RD stratas, whose N is less than 200, are included in the sample. The rest of the sample is allocated in WON * NTS1 * WLK * RD stratas (WON and NTS1 are territory codes to ensure that legal units from all country will be chosen) by solving the following formula : nh = 0.6 * (allocation proportional to the size of the strata) + 0.4 * (allocation to square root of the number of elements in given strata). The use of such a method of sample allocation gives a slight over-representation of the smallest stratas at the expense of the larger ones - it has been used to improve precision - especially in small breakdowns.
In the second step if any legal unit from the sample is part of an statistical unit enterprise, then all legal units that are part of that enterprise are selected to the sample.
Gross sample distribution Detailed information is available in “ Annex III. Sample and standard error tables 2025 “ (Worksheet: GROSS SAMPLE)
Net sample distribution Detailed information is available in “ Annex III. Sample and standard error tables 2025 “ (Worksheet: NET SAMPLE)
Annual
See detailed sections below.
The model questionnaire is generally used by the countries that conduct the survey on ICT usage and e-commerce in enterprises. Due to (small) differences in translation, in the used survey vehicle, in non-response treatment or different routing through the questionnaire, some results for some countries may be of reduced comparability. In these cases, notes are added in the data.
Detailed information on differences in the wording of the questions in the national questionnaires is available in “ Annex I. Completeness “ - worksheets related to questionnaire, coverage, additional questions.
Comparability between regions:
Data for specific set of variables were delivered on NUTS 2 regional level. There is no problem of comparability across the country's regions.
Detailed information on the provision of data on NUTS 2 regional level is available in “Annex I. Completeness“ – worksheets related to regional data.