Get started
Start exploring EU Grassland Watch
About
The EU Grasslands Watch webtool will provide access to a mapping service and time series graphs of key indicators for selected grass-dominated Natura 2000 (often referred to as N2000 or N2K) sites in a clear and dynamic way. It will allow the wealth of information derived from satellite Earth Observation to be accessible and understandable to the end user.
The key goal is to inform stakeholders and citizens about the context, evolution and conservation status of specific natural habitat types and species, and the ecological trends of N2K network sites across Europe. It will also be transparent and traceable, thus encouraging public participation in raising awareness of damaging activities and engage with them in the protection of the sites.
Powered by:

Hotspots map
Is a map oriented to specific features or regions to guide the general public to a specific issue. For each map an overview of the most representative indicators can be seen to easy locate specific pressures on grasslands and also highlight positive management performances.
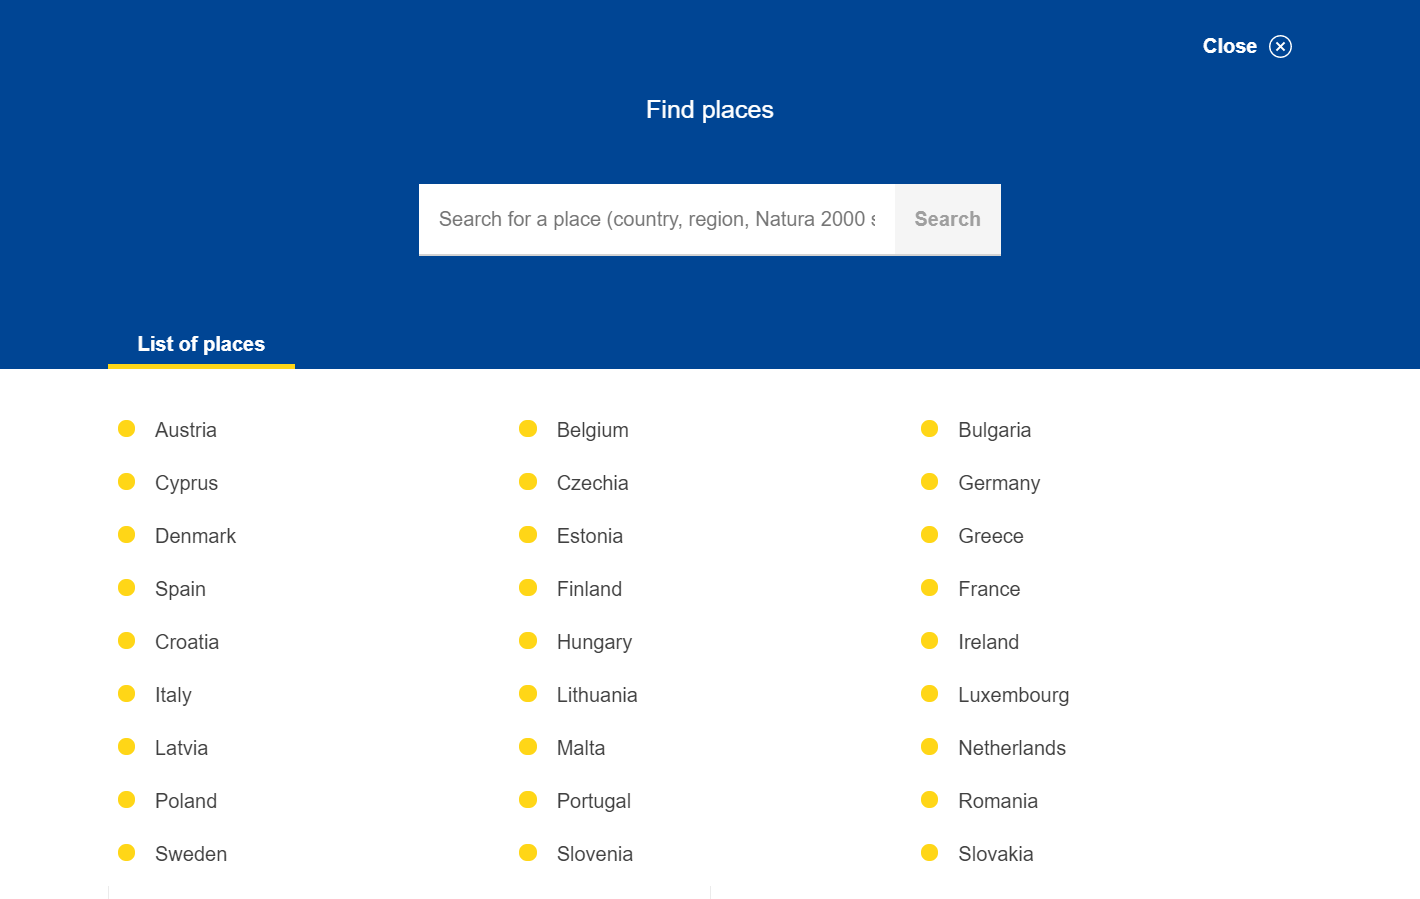
Search
There are two search options to locate specific regions or sites within the webtool.
The user can enter text in the search bar, such as country (only in English), a region, a site by name or a site by its site code.
The webtool all offers a hierarchical list of countries and sites which can be accessed by first selecting a country, then a region and finally a site. Access to the map view is possible from any of the three levels: country, region or site.
Map viewer
The images acquired by Earth Observation satellites are transformed into actionable information which can then be interpreted for particular needs and applications such as management actions or policy development. These information layers can be visualised as tabular data, time series graphs and maps.
Zoom buttons
Zoom in to the map to view a specific area in greater detail.
Zoom out from the map to see a larger area but with less detail.
Geolocation
Zooms the map view to your location.
Basemap gallery
Change between two different basemaps, conventional cartography and satellite layer.
Measure tool
Get coordinates for a single point, the distance between two points and the area of a region of interest or feature.
Products
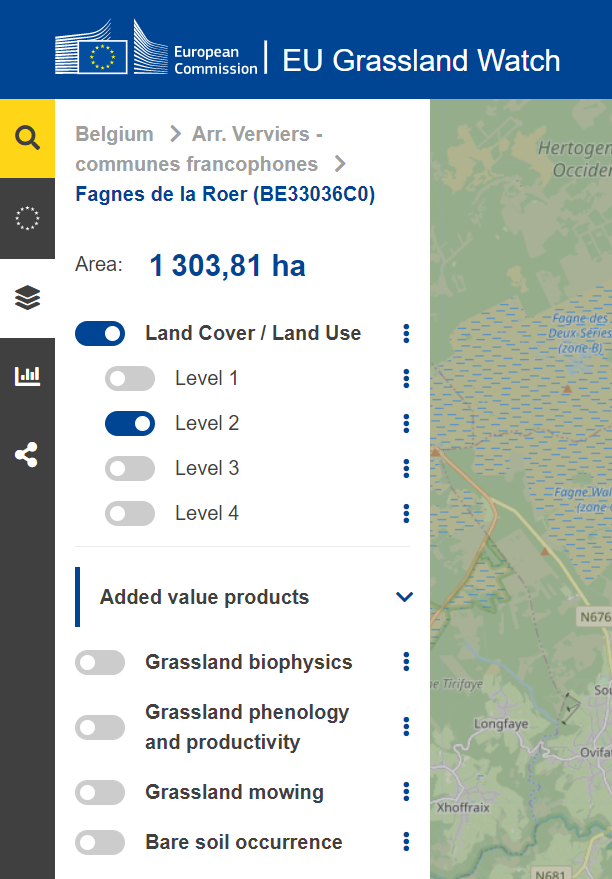
Five spatial products are available: LC/LU data (viewable at four levels of thematic detail); grassland biophysics, grassland phenology and productivity; grassland mowing and grassland ploughing.
The layers can be switched on and off, a legend will be displayed for each layer and the three dots show more descriptive detail for each layer.
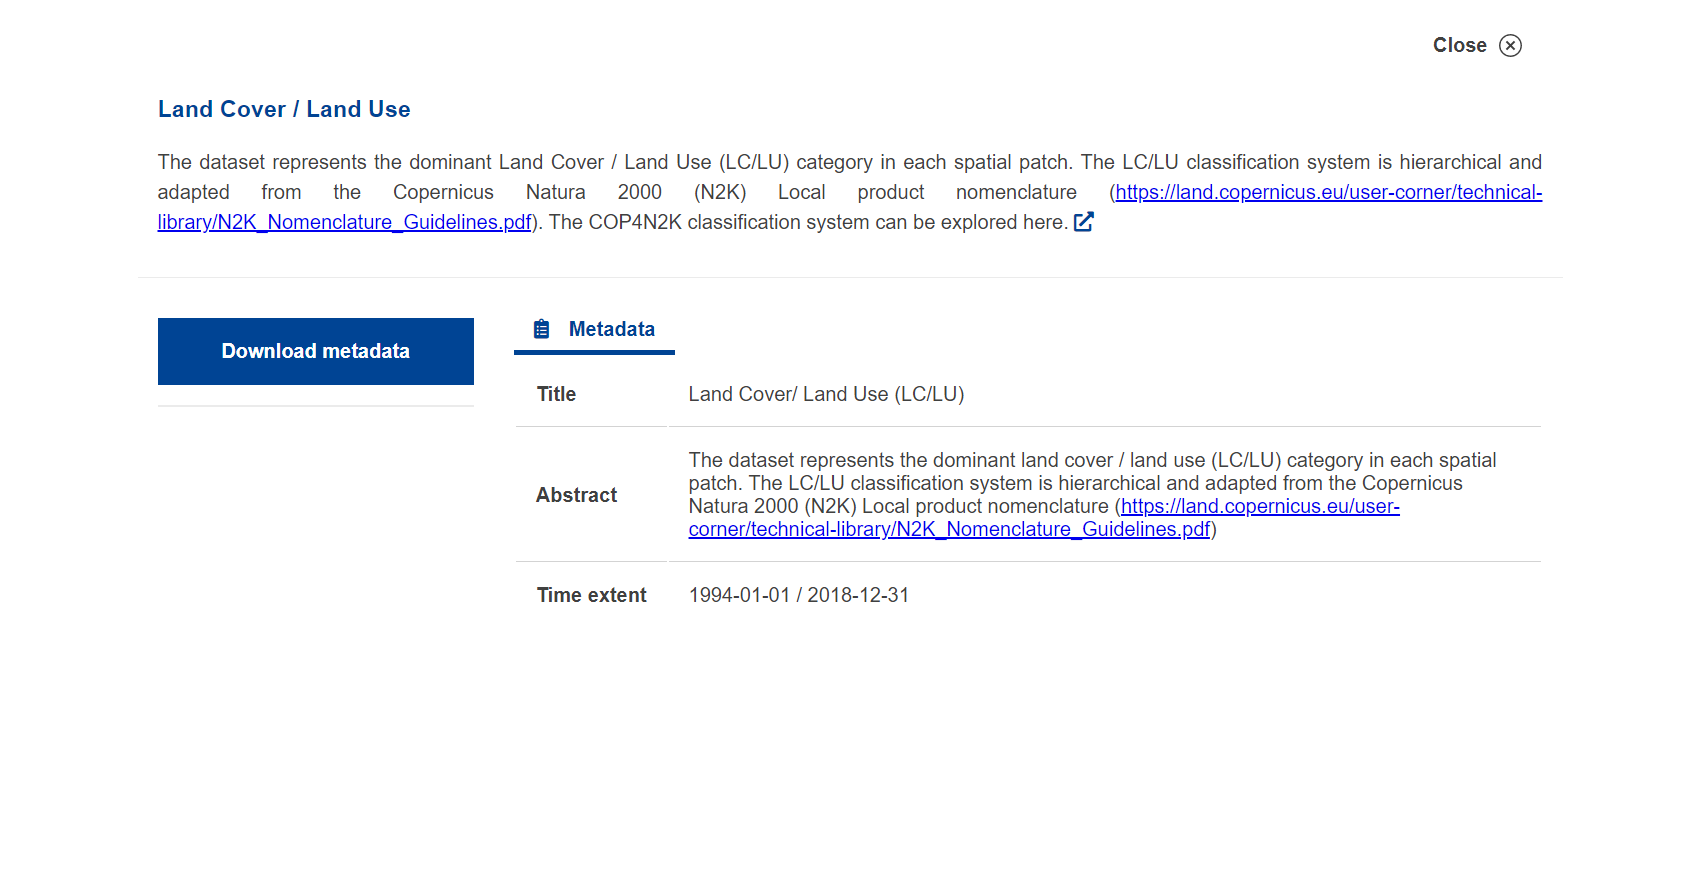
In the detail window there is a description of the product along with its metadata. The metadata can be downloaded and the product can be accessed as a service in different formats.
Legend
Show or hide the legend of the selected layer.
Time slider
The time slider shows how the the selected grassland spatial product is changing over time, so the status and the changes over time are easily detected. Click on the button to show/hide this option.
View all map series one after another or go directly to a specific year.

Print tool
Get user customised layout of the selected product in the map viewer.
Change the title, show/hide the legend, show/hide the border, select the export format, and move and zoom in/zoom out the map, with a preview before printing.

Indicators
An indicator is a variable that represents one or more properties of a habitat parcel or region and is usually derived from one or more LC/LU derived products. Indicators are usually linked to one or more policy areas and thus, designed to respond to policy questions.
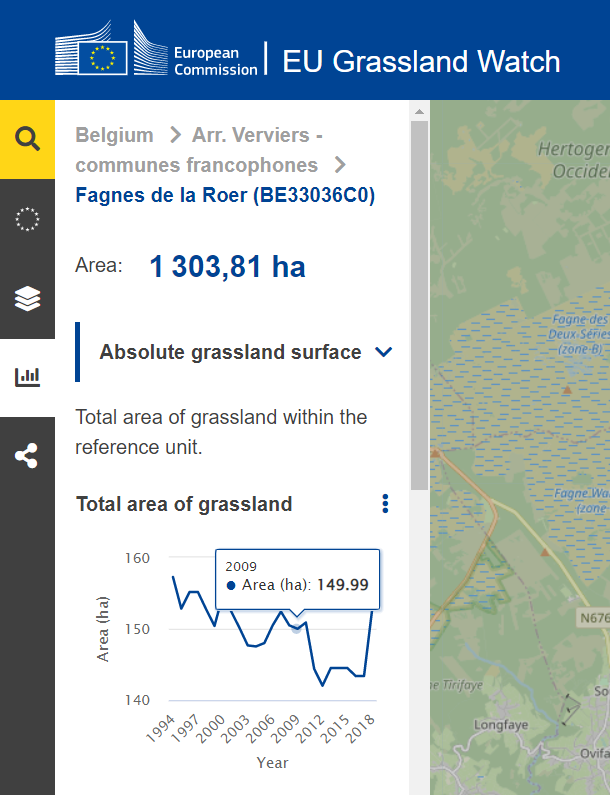
The indicators are divided into 4 groups, with specific sub-indicators.
-
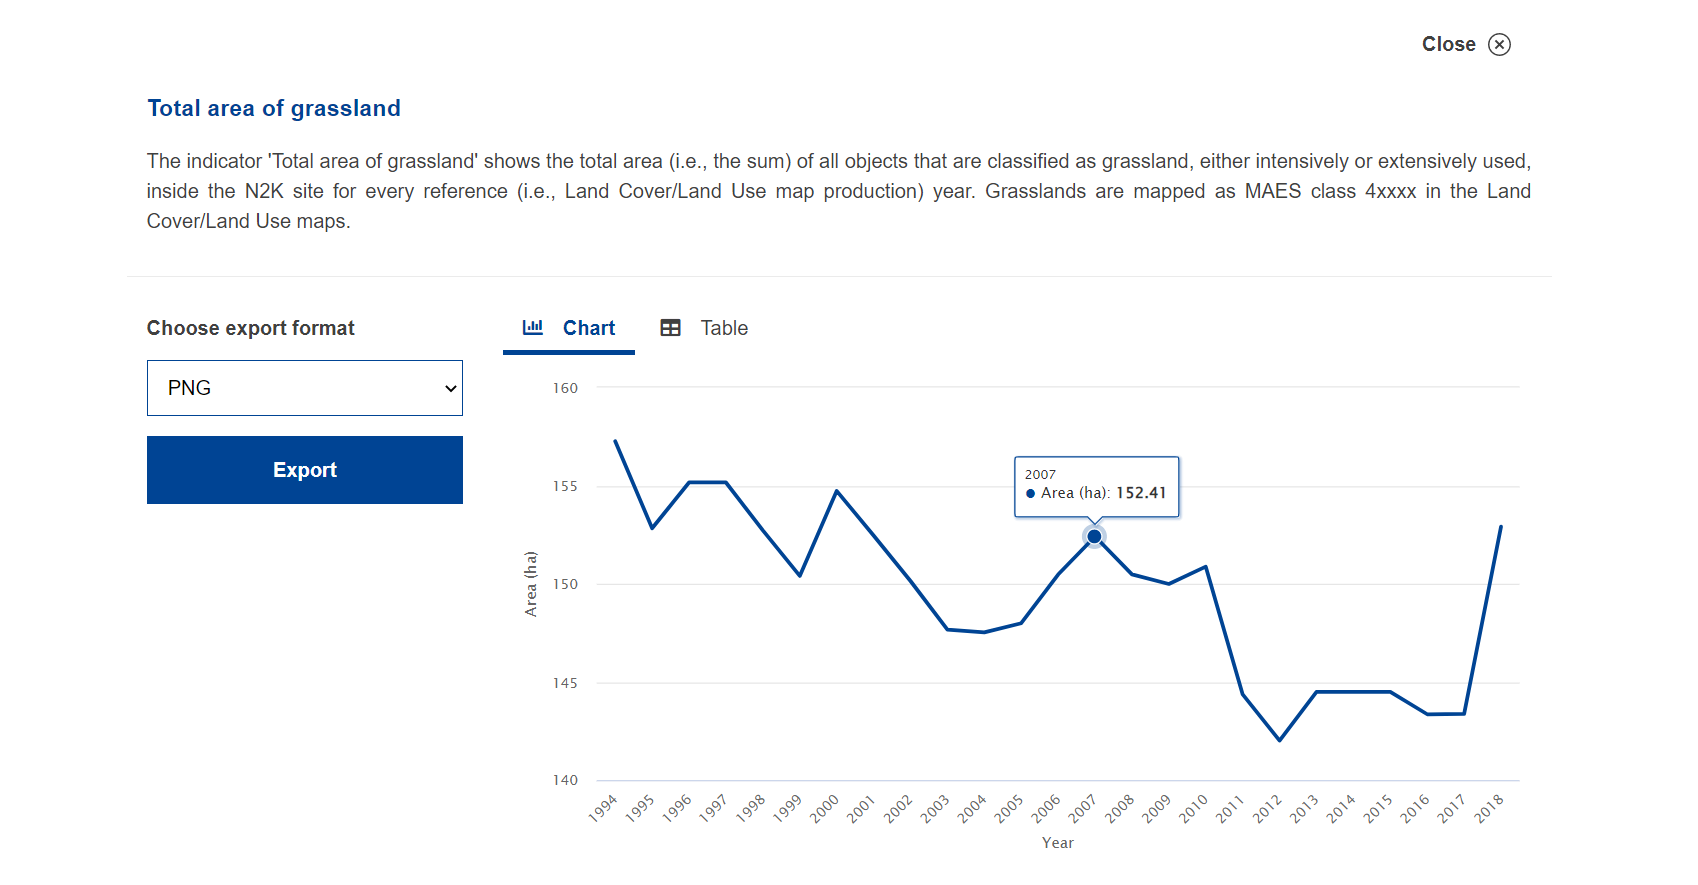
Absolute grassland surface: Total area of grassland within the reference unit.
-
Relative grassland surface: Proportion fo grassland coverage within the reference unit.
-
Grassland cover changes: Changes of grassland coverage within reference unit, both in total and relative values.
-
Class diversity: Diversity of land user/land cover classes within the reference unit.
The chart shows the trend of the sub-indicator over time for the selected area. Clicking the three dots a detail sub-indicator window will be shown.
In the detail window there is a description, a chart with the evolution on the sub-indicator, the data in table format and option to download the data in different formats.
Share
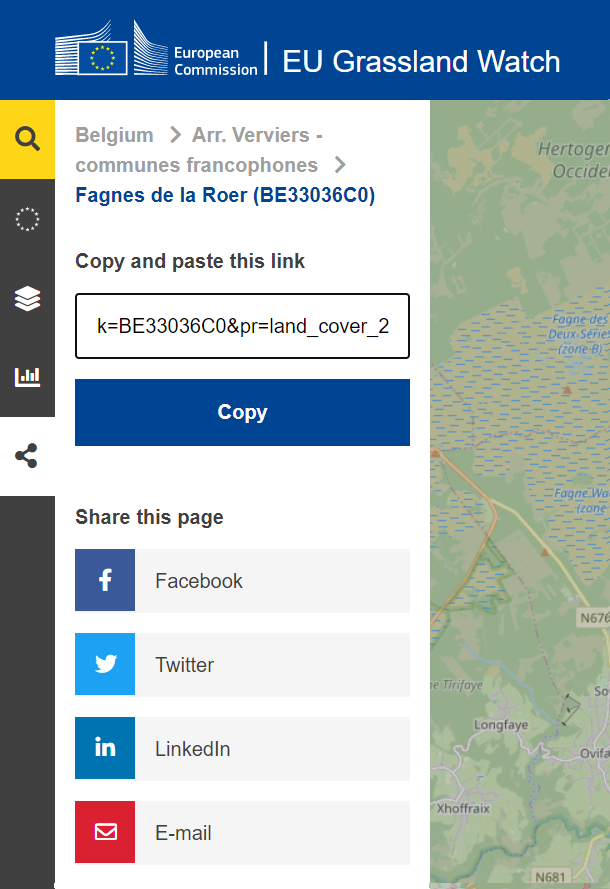
The URL of the selected country, region or site can be shared directly or on the different social networks.