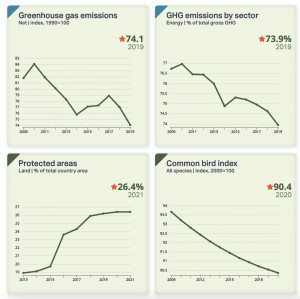
You can follow progress with the European Green Deal through a new set of data charts provided by the European Commission. These give an overview of 26 indicators divided into three main topics: Reducing our climate impact; Protecting our planet & health; and Enabling a green and just transition.
This latest data is presented through a series of new interactive visualisation tools showing statistics relevant for the European Green Deal, which is one of the six European Commission priorities for 2019 – 24. The tool aims to help users of European data discover the statistical indicators in an attractive and intuitive way.