Nuclear energy statistics
Data from December 2023
Planned update: January 2025
Highlights
Nuclear plants generated around 21.8% of the total electricity produced in the EU in 2022.
In 2022, 13 EU countries had operational nuclear reactors: Belgium, Bulgaria, Czechia, Germany, Spain, France, Hungary, the Netherlands, Romania, Slovenia, Slovakia, Finland and Sweden.
In 2022, electricity generation from nuclear plants in the EU decreased by 16.7% compared to 2021.
This article provides recent statistics on nuclear energy in the European Union (EU).
Full article
Nuclear heat and gross electricity production
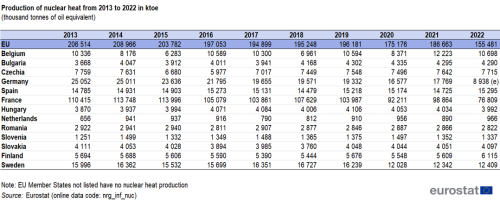
The production of nuclear heat is obtained from the fission of nuclear fuels in nuclear reactors. This heat is subsequently used for the production of electricity. The remaining heat (about 2/3 of the total) is mainly lost, except for a very small part which is used for agriculture and urban heating. The total production of nuclear heat in the EU in 2022 was 155 481 thousand tonnes of oil equivalent (toe), a drop of 24.7 % compared to 2013 and of 16.7 % compared to 2021. On country level, the biggest decreases compared to 2021 were registered in Germany (-49.7 %) and France (-22.3 %).
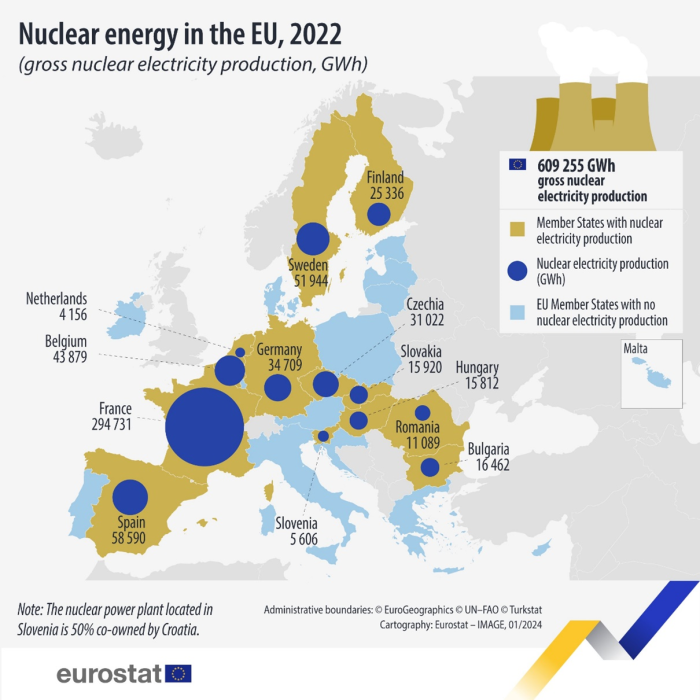
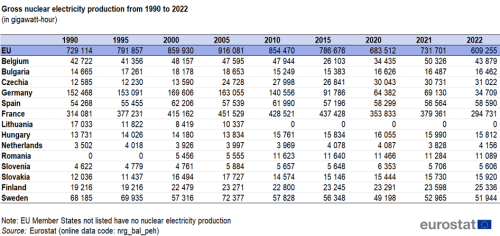
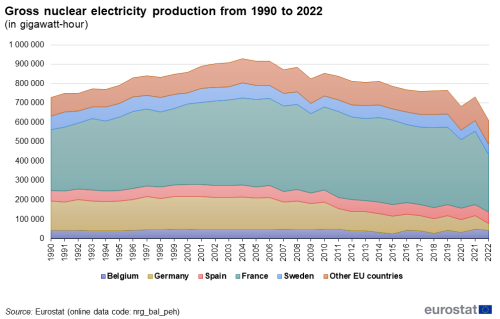
The main use of nuclear heat is the production of electricity. The gross electricity generation from nuclear plants within the EU in 2022 amounted to 609 255 GWh, which represents a 16.7 % decrease compared with 2021 and is in fact a record low value in the period 1990-2022. Over this period two different trends can be distinguished. From 1990 to 2004, the total amount of electricity produced in nuclear facilities in the EU rose by 26.9 %, reaching a peak of 928 438 GWh in 2004, due to an increase in the number of reactors in operation. Between 2004 and 2006, the total production of nuclear power in the EU stabilised, before declining by 33.4 % between 2006 and 2022 (see Table 2).
Source: Eurostat (nrg_bal_peh)
The largest producer by far of nuclear power within the EU in 2022 was France, with a 48.4 % share of the EU total, followed by Spain (9.6 %), Sweden (8.5 %) and Belgium (7.2 %). These four Member States produced 73.7 % of the total amount of electricity generated in nuclear facilities in the EU in 2022.(see Figure 1)
Source: Eurostat (nrg_bal_peh)
Contrary to the general EU trend, between 2006 and 2022 six countries increased their nuclear electricity production: Romania, whose nuclear power production began only in 1996 (+96.9 %), the Netherlands (+19.8 %), Czechia (+19.1 %), Hungary (+17.5 %), Finland (+10.6 %), and Slovenia (+1.0 %). During the same period, the remaining countries (including the main producers) decreased their nuclear electricity production. Lithuania definitively shut down its nuclear facilities in 2009. Germany recorded the highest decrease (-79.3 %), followed by France (-34.5 %), Sweden (-22.5 %), Bulgaria (-15.6 %), Slovakia (-11.6 %), Belgium (-5.9 %) and Spain (-2.6 %).
In 2022 at EU level, 21.8 % of all electricity produced was generated by nuclear power plants. France had the highest share of nuclear in its electricity mix (62.8 %), followed by Slovakia (60.2 %) and Belgium (46.4 %). The Netherlands and Germany were on the other end of the spectrum, with 3.4 % and 6.0 %, respectively.
Enrichment capacity
Uranium found in nature consists largely of two isotopes, uranium-235 (U-235, fissile) at 0.7 % and uranium-238 (U-238, non fissile) at 99.3 %. U-238 does not contribute directly to the fission process (though it does so indirectly by the formation of fissile isotopes of plutonium 239). Because of the small percentage of fissile material in the natural uranium, and in order to obtain suitable nuclear fuel for the pressurised water reactors (PWR, the majority in Europe), it is necessary to increase the concentration (‘enrich’) of the U-235 isotope from 0.7 % to 3-5 %. There are two possibilities: the centrifugation or the diffusion of the uranium in gaseous form (hexafluorure UF6). As a result, the natural uranium is separated into a small part of enriched uranium and a large part of depleted uranium. Only two reactors in the EU (in Romania - Canadian type "CANDU") use natural uranium. This technology does not require uranium enrichment but requires the use of "heavy water" as moderator to compensate.
The standard measure, the "separative work unit", is the effort required to separate isotopes of uranium (U235 and U238) in the enrichment process: 1 tSWU is equivalent to 1 tonne of separative work units (tSWU).
Only three EU Member States operated enrichment plants in 2022: Germany, the Netherlands and France, bringing the total enrichment capacity of the European Union to 16 400 tSWU (see Table 3).
Production of fresh fuel assemblies
The fuel assembly constitutes the base element of the nuclear reactor core. The material used is the low enriched uranium (3 % to 4 % U235) produced by the enrichment plants. The standard pressured water reactor core contains about 157 fuel assemblies (depending on the reactor type). The uranium oxide (black powder) is pressed into pellets (small cylinders), then placed inside rods (tubes of about 1 cm diameter, 4 m length ) which are inserted into the basic element of nuclear fuel, the "assembly". The term "fresh fuel" indicates that it is the first use of uranium extracted from mines as opposed to the "MOX fuel" which is mainly made of recycled material. MOX (mixed oxide) assemblies are not included in this section but are covered in section "Production of MOX fuel elements".
Production of fresh fuel elements are measured in tonnes of heavy metal (tHM).
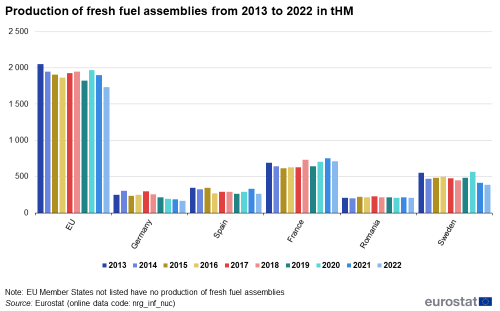
Only five EU Member States produced fresh fuel elements in 2022: Germany, Spain, France, Romania and Sweden (see Table 4 and Figure 2), with an overall decrease from 2013 to 2022 of 15.2 %. Germany recorded the largest decrease in production of fresh fuel elements over the past decade (-32.6 %), followed by Sweden (-29.5 %) and Spain (-24.1 %). France and Romania recorded an increase (+2.2 % and +0.3 %, respectively).
Production of MOX fuel assemblies
The production of MOX (Mixed OXide of uranium and plutonium) assemblies is similar to the production of fresh fuel assemblies. The difference lies in the use of a mix of uranium oxide and plutonium oxide instead of pure uranium oxide.
The aim of using MOX is the "recycling" of the remaining uranium and the plutonium, both extracted from the spent fuel in the reprocessing plants (97 % of the nuclear material can be reused). The MOX fuel is mainly used in France representing 1/4 to 1/3 of the total core fuel in some reactors. The production of MOX fuel elements is measured in tHM (tonnes of heavy metal).
As shown in Table 5, in 2013 only two EU countries produced MOX fuel assemblies: Belgium and France. However, Belgium stopped its production in 2015, leaving France as the only remaining Member State with a MOX production capacity.
Production of uranium and plutonium in reprocessing plants
This section refers to the annual production of uranium (U) and plutonium (Pu) in reprocessing plants, measured in tHM. Reprocessing consists of recovering fissile and fertile materials from used nuclear fuel in order to provide MOX fuel for nuclear power plants. The spent fuel, assembled in rods, is first dismantled, then cut in small pieces, before being chemically separated into uranium, plutonium and waste. 97 % of the nuclear material (U and Pu) is recycled and the remaining 3 % highly radioactive waste material is vitrified and put into containers for long term storage.
As shown in Table 6, France is currently the only EU Member State which operates a nuclear reprocessing plant.

Source: Eurostat (nrg_inf_nuc)
The production of U and Pu in reprocessing plants in France decreased by 21.1nbsp;% in 2022 compared to ten years ago.
Uranium supply security
Uranium is an abundant resource on all five continents: 44 % is found in OECD countries, 22 % in the BRICS (Brazil, Russia, India, China and South Africa) and 34 % in the rest of the world. This distribution greatly limits geopolitical risks compared with, for example, oil supply. According to the International Atomic Energy Agency, the identified global resources with low extraction costs represent a century of consumption at the current rate. In addition, uranium is a stable metal, which can be stored easily without any time limit. Some countries already have strategic stocks that can be used for years.
Source data for tables and graphs
Data sources
Annual data on nuclear energy and production of electricity have been used for all calculations. The most recent data available are for 2022. Data are available for all EU Member States. In general, data are complete, recent and highly comparable across countries.
Context
The basis for nuclear energy in Europe was laid in 1957 by the European Atomic Energy Community (Euratom). The initial goal was to develop the civil use of nuclear material (for medical purposes, electricity production as examples). The sector represents an important source of electrical energy, since nuclear power stations currently produce around a quarter of the electricity consumed in the European Union.
Energy statistics inform the political decision-making in the European Union and its Member States. Statistics on nuclear energy were incorporated in Regulation (EC) No 1099/2008 on energy statistics. This Regulation states that statistics concerning the civil use of nuclear energy must be transmitted annually by Member States to Eurostat. This regulation was amended several times and the last, very comprehensive, amendment (Regulation (EU) 2022/132) entered into force on 20/2/2022. The link to the legislation page on Eurostat's website is here.
In view of finding solutions for achieving the EU’s decarbonisation goals, the European Commission launched an in-depth assessment in 2020 on the possible inclusion of nuclear energy in the EU taxonomy of environmentally sustainable activities. Following the assessment, the Commission prepared a draft text of a Complementary Climate Delegated Act, which includes specific nuclear and gas energy activities in the list of economic activities covered by the EU taxonomy. The draft text was formally adopted by the Commission in March 2022. As neither the European Parliament nor the Council objected to the text, the Commission Delegated Regulation (EU) 2022/1214 was published in the Official Journal on 15 July 2022 and applies as of 1 January 2023.
Direct access to
- Energy statistics - quantities (t_nrg_quant)
- Primary production of energy by resource (ten00076)
- Gross inland energy consumption by fuel type (tsdcc320)
- Energy statistics - quantities (nrg_quant)
- Energy statistics - quantities, annual data (nrg_quanta)
- Energy infrastructure and capacities (nrg_inf)
- Nuclear energy facilities (nrg_inf_nuc)
- Energy infrastructure and capacities (nrg_inf)
- Energy statistics - quantities, annual data (nrg_quanta)
- Energy statistics - quantities (nrg_quant)
- Energy statistics - quantities, annual data (nrg_quanta)
- Energy balances (nrg_bal)
- Complete energy balances (nrg_bal_c)
- Energy balances (nrg_bal)
- Energy statistics - quantities, annual data (nrg_quanta)
- Energy statistics - quantities (nrg_quant)
- Energy statistics - quantities, annual data (nrg_quanta)
- Energy indicators (nrg_ind)
- Gross and net production of electricity and derived heat by type of plant and operator (nrg_ind_peh)
- Energy indicators (nrg_ind)
- Energy statistics - quantities, annual data (nrg_quanta)
Visualisations
- Annual nuclear statistics (nrg_inf_nuc) (ESMS metadata file — nrg_inf_nuc_esms)
