
Accessibility tools
Service tools
Language
Navigation path
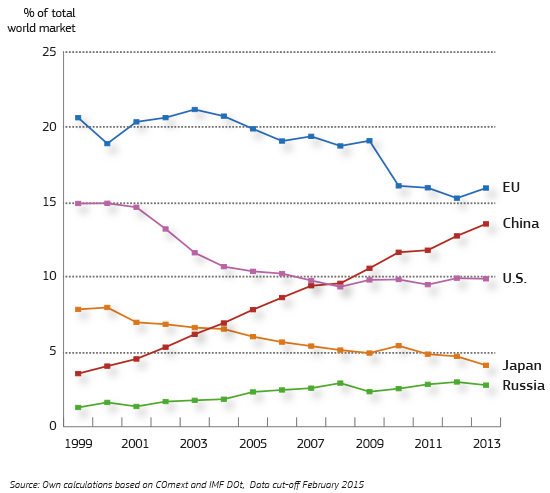
The EU remains the world’s biggest exporter of both goods and services but EU exporters have suffered more from the crisis than their competitors in the US and Japan.
This can be seen by the decline in market share for EU goods exports since 2009, which has been much steeper than for Japanese or US exporters and greater than can be explained by the faster growth of emerging economies.
Relative market shares

Before the crisis, EU exports fared relatively better against competition from China than those of the US and Japan, thanks in good part to the integration of competitive suppliers in Central and East European Member States with other European, particularly German, manufacturers.
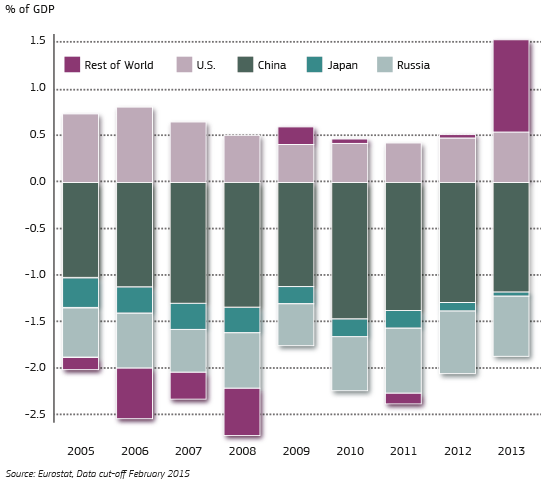
The EU’s trade deficit with China is substantial but has been decreasing over the last few years (see graph 2). By contrast, the EU runs a long-term trade surplus with the US.
EU Trade balance with major partners, 2005-13

In 2013, for the first time in the last 10 years, the EU also registered a significant surplus with the ‘rest of the world’.
Find out more:
Additional tools