
27/01/17
![]()
Accessibility tools
Service tools
Language
Navigation path
The ‘economic climate tracer’ below shows how the EU’s business cycle has moved from downswing and recession in 2008 into an expansionary ‘growth’ phase today.
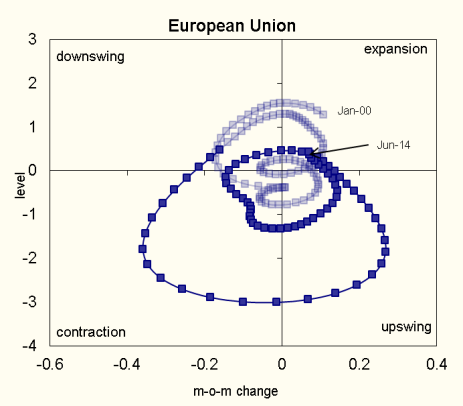
The four quadrants of the graphs enable one to distinguish four phases of the business cycle: "expansion" (top right quadrant), "downswing" (top left), "contraction" (bottom left), and "upswing" (bottom right).
Cyclical peaks are positioned in the top centre of the graph, and troughs in the bottom centre.
The darker line shows developments in the current cycle, which in the EU roughly started in January 2008.
The graph was published in the European Business Cycle Indicator. The report looks at developments in business and consumer survey data in the second quarter of 2014.

Additional tools