Maps
Quality of life in European Cities
What city is the cleanest or the safest? In which city is easy to find a job or a house? Which city has the best public transport or air quality? The report on the Quality of life in European Cities 2020 summarises the results of the 5th survey, carried out in 2019, of 83 European cities.
- 2023: Report on the Quality of life in European cities - Map and interactive chart
- 2020: Report on the Quality of life in European cities - Map and interactive chart
How fast are rail trips between EU cities and is rail faster than air
This paper analyses rail speed on a set of 1 356 routes between medium and large EU cities located less than 500 km apart. On only 3% of routes between these cities do rail speeds exceed 150 km/h and on 30% of routes the speed is below 60 km/h. Rail speeds tend to be lower and more connections are missing in eastern EU Member States and on cross-border routes.
European Regional Competitiveness Index
Since 2010, the EU Regional Competitiveness Index (RCI) has been measuring the major factors of competitiveness for all the NUTS-2 level regions across the European Union. The Index measures, with a rich set of indicators, the ability of a region to offer an attractive environment for firms and residents to live and work. The 2022 edition of the index builds on an updated methodology and therefore it is referred to as RCI 2.0.
Mapping the glass ceiling: The EU regions where women thrive and where they are held back
In which EU regions are women achieving the most, and in which ones they face the largest disadvantage? The EU regional gender equality monitor is the first to capture aspects of gender equality at the regional level for the almost totality of EU NUTS2 regions.
EU Social Progress Index
The EU Social Progress Index (EU-SPI) is a measure of societal development and quality of life at the regional level that goes beyond the Gross Domestic Product. The Index measures social progress in European regions, at the NUTS2 level, using twelve components described by a total number of fifty-five comparable social and environmental indicators, purposefully excluding economic aspects. Its components are further aggregated into three broader dimensions describing respectively basic, intermediate and more sophisticated aspects of social progress.
- 2020: Working Paper - Map and interactive chart
- 2016: Map and scorecards
Convergence of EU regions redux
The 2008 economic crisis had a deep impact on economic and social cohesion in the EU and the surge in disparities is now frequently cited as one of the main causes for the current lack of popular support for the project of constructing the European Union.
Measuring urban accessibility for low-carbon modes
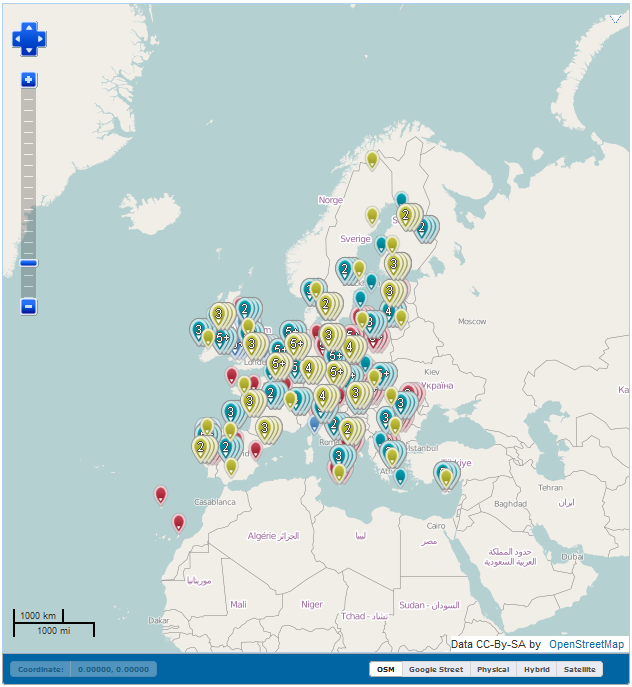
Good urban public transport can reduce congestion, air pollution and greenhouse gas emissions. It can improve a city’s quality of life and strengthen its economy. This map measures access to public transport for many European cities using the United Nations Sustainable Development Goal indicator. The map is accompanied by city fact sheets which report its various indicators and benchmark them to other cities.
Towards a name for each town
The European system of urban/rural territorial classifications relies upon basic types of 1 km² grid cell clusters. By definition,
these clusters are independent from any existing administrative unit. This is an important asset as it avoids distortions due to historical, administrative and/or
political factors. Nevertheless, when analysing indicators at the level of individual grid-based clusters it is very useful to be able to attribute a name to
the clusters. High-density clusters (or urban centres) represent the major cities, each with a population of at least 50,000 inhabitants. There are more than
800 urban centres in Europe. Most of these can be associated with a particular local administrative unit. This means that it has been quite straightforward to
allocate a name to each of the grid-based urban centres.
The class of urban clusters (moderate-density clusters) contains suburbs and towns. While suburbs can be associated to urban centres, grid-based towns do not
have any a-priori name. Still, providing names to these units can be useful to facilitate referencing them. Hence, the challenge is to provide (unique) names
for more than 9000 towns throughout Europe.
Road transport performance in Europe
In Europe, governments invest EUR 100 billion in transport each year to provide people and firms with better access. Accessibility indicators can be used to capture the benefits of these investments, for example by measuring how many destinations can be reached. In that sense, they are a significant improvement over indicators such as speed, capacity or congestion. However, they are seldom used in decision-making. Furthermore, accessibility indicators often primarily reflect the spatial distribution of destinations rather than the performance of transport networks.
Population at risk of poverty
Given the marked territorial dimension of at-risk-of-poverty rates, national level indicators hide important differences.
Policies addressing poverty could benefit from a more detailed geographical breakdown of the prevailing situation and of the main determinants. This is why
the European Commission has produced a more detailed poverty map in cooperation with ESPON and the World Bank.
The at-risk-of-poverty rate is a relative measure of poverty. The poverty threshold is set at national level: someone with a given level of income can be
considered at risk of poverty in one country and not at risk in another country where income levels are generally lower.
Road accessibility in border regions
Cross-border interactions within the European Union (EU) still face more obstacles than interactions within national borders. Road accessibility might be only one of these obstacles, but adequate transport infrastructure is necessary to provide access to opportunities. To help improve cross- border cooperation, we assess road transport infrastructure in border regions.
The geography of EU discontent
Over the last decade, political parties opposed to EU integration have almost doubled their votes. The general opinion of the EU has also deteriorated, revealing a growing number of people who distrust the Union. For the first time, it maps the vote against EU integration in the last national elections across more than 63 000 electoral districts in each of the EU Member States.
Typology of public transport frequencies
Rapid and frequent public transport has a big impact on urban economies. It can expand labour markets, offer more opportunities and better accessibility. These benefits are also reflected in the real estate market with (much) higher prices for houses and offices close to metro stations and highly accessible locations.
European Quality of Government Index
The European Quality of Government Index (EQI), developed by the Quality of Government Institute of Gothenburg University, measures institutional quality at the regional level in the European Union.
Degree of Urbanisation
The degree of urbanisation typology classifies all local authorities (municipalities) into (1) cities, (2) towns and suburbs and (3) rural areas. A wide range of indicators is produced by Eurostat using this classification. The interactive map allows you to check the classification for any place in the EU.
- Working Paper: A harmonised definition of cities and rural areas: the new degree of urbanisation
- Interactive map
Regional statistics
In the Commission's Eighth Report for Economic, Social and Territorial Cohesion a serie of maps shows how European regions compare in a wide range of areas: the economy, social development, the environment, transport, health, education, research and development.
EU regional funding 2021-2027
-
DownloadБългария
-
DownloadBelgien/Belgique/België
-
DownloadCzechia
-
DownloadDanmark
-
DownloadBundesrepublik Deutschland
-
DownloadEesti
-
DownloadΕλλάς
-
DownloadΚύπρος
-
DownloadEspaña
-
DownloadFinland/Suomi
-
DownloadFrance
-
DownloadHravtska
-
DownloadMagyarország
-
DownloadIreland
-
DownloadItalia
-
DownloadLatvija
-
DownloadLietuva
-
DownloadLuxembourg/Luxemburg
-
DownloadMalta
-
DownloadÖsterreich
-
DownloadNederland
-
DownloadPolska
-
DownloadPortugal
-
DownloadRomânia
-
DownloadSlovenská republika
-
DownloadSlovenija
-
DownloadSverige
EU regional funding 2014-2020
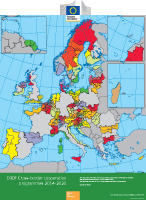
Source: DG REGIO
Non-EU areas are indicative only
EU Membership status and regional eligibility as of 01/01/2014.
Source: DG REGIO
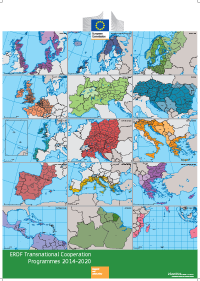
EU regional funding 2007-2013
Each programme area is shown with a specific colour. Hatched areas are part of two or more programme areas simultaneously.
Source: DG REGIO
Non-EU cooperation areas are indicative only, and subject to modification
© EuroGeographics Association for the administrative boundaries (NUTS regions)
Other administrative boundaries: Global Administrative Unit Layers (GAUL), FAO
EU regional funding: history
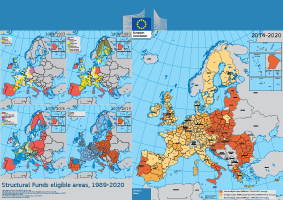
1994-1999: Austria, Finland and Sweden eligible from 1995; Abruzzo (IT) eligible from 1/1/1994 to 31/12/1996
2000-2006: Czech Republic, Estonia, Cyprus, Latvia, Lithuania, Hungary, Malta, Poland, Slovenia and Slovakia eligible from 1/5/2004
2007-2013: Croatia eligible from 1/7/2013
2014-2020: EU Membership status and regional eligibility status as of 01/01/2014
Boundaries of non-EU countries: situation on 31/12/2013
Source: DG REGIO
Watch this short clip to see how the regions eligible for EU regional funding have evolved over the period 1989-2020.
MAPS (PROJECTS)