
DG REGIO: Regional Competitiveness Index
date: 26/11/2019
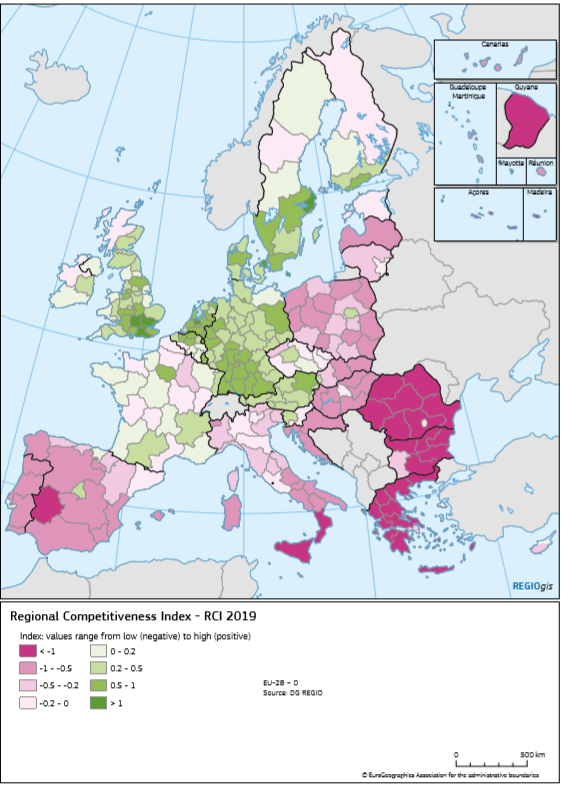
Our friends at DG REGIO maintain the Regional Competitiveness Index (RCI) to measure the major factors of competitiveness over the past ten years for all the NUTS-2 level regions across the European Union. The Index measures with more than 70 comparable indicators the ability of a region to offer an attractive and sustainable environment for firms and residents to live and work.
The 2019 results are illustrated with interactive maps and a range of interactive web tools. The scorecards make it easy to compare any region with the EU and regions with a similar level of GDP per head. Users can see where their region stands on aspects such as governance, infrastructure, including the digital networks, health, human capital, labour market and innovation. With interactive spider-graphs two regions can be benchmarked with each other and with the European average. Dedicated graphs compare the four points in time and allow the user to select the regions of interest. The graphs show when the changes over time represent a significant improvement or deterioration.
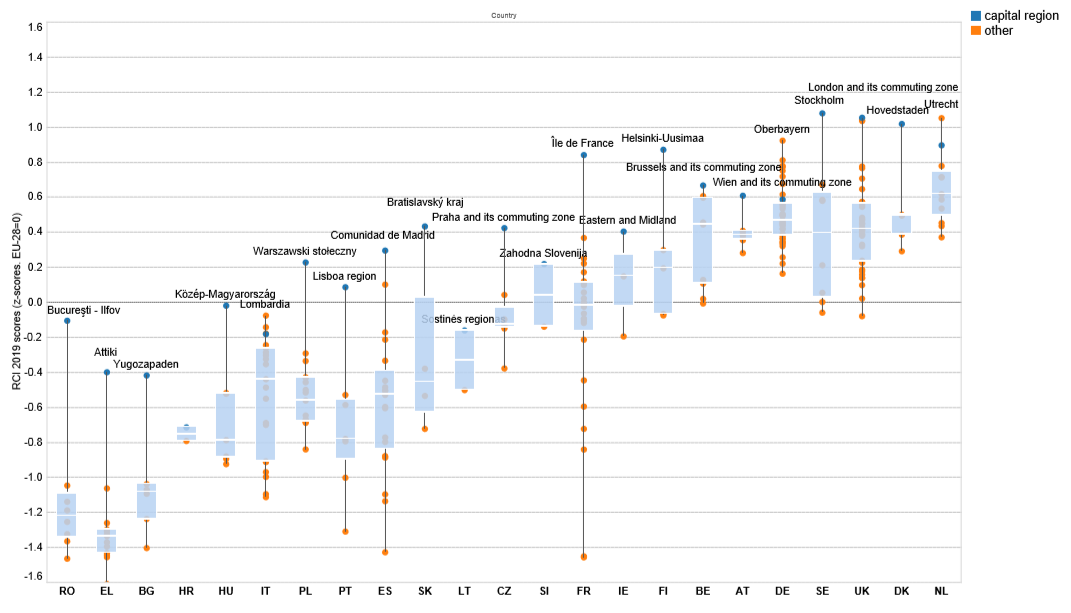
The 2019 results confirm a polycentric pattern with a strong performance of most capitals and regions with large cities, that benefit from agglomeration economies, better connectivity and high levels of human capital. Other regions in the same country in some cases score much worse. Ten years after the crisis and the north-west, south-east divide across the EU is still clear and visible. The top performer in this edition is the region of Stockholm, followed by London, with its wide commuting zone, and Utrecht for a combined second place:
The best performing regions in the countries are (the name of the best region in the country is shown. Shadowed boxes include 50 % of the regions within each country.Only countries with more than one region are displayed):
More information here!