Archive:Urban Europe — statistics on cities, towns and suburbs — the dominance of capital cities
Data extracted in February–April 2016
Highlights
Graphical element
This chapter is part of an online publication that is based on Eurostat’s flagship publication Urban Europe — statistics on cities, towns and suburbs (which also exists as a PDF).
Definitions of territorial units
The various territorial units that are presented within Urban Europe — statistics on cities, towns and suburbs are described in more detail within the introduction. Readers are encouraged to read this carefully in order to help their understanding and interpretation of the data presented in the remainder of the publication.
Full article
The dominance of capital cities
Capital cities have the potential to play a crucial role in the development of the European Union (EU). The cultural identity of well-known European capital cities such as Praha (the Czech Republic), Athina (Greece), Paris (France) or Roma (Italy) helps to shape opinions of the EU across the globe.
The EU’s capital cities are hubs for competitiveness and employment, and may be seen as drivers of innovation and growth, as well as centres for education, science, social, cultural and ethnic diversity, providing a range of services and cultural attractions to their surrounding area. Nevertheless, the EU’s capital cities also provide examples of the ‘urban paradox’ (further details are provided in Chapter 2), insofar as they may be characterised by a range of social, economic and environmental inequalities; as such, they are at the heart of efforts to ensure more sustainable and inclusive growth within the EU.
This chapter examines the relationship between capital cities and the national economies to which they belong. It shows that some capital cities may exert a form of ‘capital magnetism’, through a monocentric pattern of urban development that results in investment/resources being concentrated in the capital. Whether such disparities have a positive or negative effect on the national economy is open to debate, as large capital cities that dominate their national economies may create high levels of income and wealth that radiate to surrounding regions and pull other cities up. By contrast, other capital cities are part of a more polycentric pattern of urban development, whereby economic activity and employment is more evenly balanced between the capital and other major cities.
International comparisons
Table 1 provides information on the total number of inhabitants living in the urban agglomerations of the G20 capitals. The data are provided by the United Nations and are based on national definitions which may undermine comparability in some cases; note the definitions employed are somewhat different to those used elsewhere in this publication (which are based on a harmonised data collection exercise conducted by the EU).
The biggest capital cities in the EU are relatively small when compared with other global capitals
In 2014, the largest urban agglomerations among G20 capitals were located in Asia and Latin America. The total number of inhabitants was highest in Tokyo (37.8 million), followed by Delhi, Mexico City, Beijing and Buenos Aires. Moskva (Moscow) was the first European capital city in the ranking (12.1 million inhabitants), with a slightly higher population than either Paris or London — the only two megacities in the EU with in excess of 10.0 million inhabitants (see Table 1). The number of people living in the Italian and German capital cities — Roma and Berlin — was considerably lower (3.7 and 3.5 million inhabitants respectively) and there were only three G20 capitals that recorded smaller populations, namely, those of South Africa, Canada and Australia — Tshwane (formerly Pretoria), Ottawa-Gatineau and Canberra.
People living in Buenos Aires accounted for 35.6 % of the total population in Argentina …
Given the considerable differences in total population numbers between the G20 countries, it is perhaps more revealing to analyse the population shares of the urban agglomerations for capital cities in their national populations. On this basis, Buenos Aires recorded the highest share, as those living in the Argentinian capital accounted for more than one third (35.6 %) of the total number of inhabitants; note these data are sourced to the United Nations and are based on national definitions. The population of Japan was also relatively concentrated within its capital, as the inhabitants of Tokyo accounted for a 29.8 % share of their national population, while approximately 20 % of the populations of Saudi Arabia and the Republic of Korea inhabited their respective capitals of Ar-Riyadh (Riyadh) and Seoul.
… while the inhabitants of Beijing accounted for 1.4 % of the Chinese population
The 19.5 million inhabitants living in the urban agglomeration of the Chinese capital, Beijing, accounted for just 1.4 % of their national population. According to the United Nations (World Urbanisation Prospects, the 2014 revision) there were 105 other cities in China with at least one million inhabitants (including Shanghai, which has a larger population than Beijing). A similar pattern was observed in the world’s second most populous country, India, as the 25.0 million inhabitants of Delhi accounted for 1.9 % of their national population. The total number of inhabitants living in the capital cities of Brazil, Australia and the United States also accounted for no more than 2.0 % of their respective national populations. All three cities, Brasilia, Canberra and Washington, D.C. had relatively small populations — likely linked to their largely administrative role as capital cities.
Comparisons within the EU
The analysis is extended in Table 2, supplementing the number of inhabitants by the addition of information on employment and gross domestic product (GDP), while the typology used for defining European capital cities is that of metropolitan regions; this typology is based on an approximation of functional urban areas (cities and their commuting zones) based on one or more NUTS level 3 regions, whereby the metropolitan region may include rural regions (if these have a relatively high prevalence of commuting).
GDP — territorial and residential approaches
GDP is calculated on the basis of where people work (a territorial approach, rather than a residential approach). Those cities characterised by high net commuter inflows are likely to witness a higher level of economic output beyond that which could be produced by their active resident population, and GDP per inhabitant will therefore appear inflated.
Furthermore, cities with apparently high standards of living do not necessarily have correspondingly high levels of income, as some of their income will be used to recompense commuters (living in other regions). Furthermore, GDP per inhabitant is an average for a particular territory and does not provide any information on the distribution of wealth among those living in each city.
The relative importance of capital cities to national economies tends to be higher in the smaller EU Member States …
The relative importance of the capital city in the national economy was often inversely related to the population size of the EU Member State in question. This was particularly the case in three of the smallest Member States, namely, Cyprus, Luxembourg and Malta, where the metropolitan region of the capital city equates to the whole (or almost all) of the national territory. Otherwise, Rīga and Tallinn — the relatively small Latvian and Estonian capitals — accounted for the next highest shares of population, employment and GDP, followed by Dublin (Ireland), Athina (Greece), København (Denmark), Wien (Austria) and Budapest (Hungary); the metropolitan regions of these five capitals each accounted for 30–40 % of the total number of national inhabitants. Each of these Member States displayed a monocentric pattern of development, with the metropolitan regions of their capital cities accounting for high shares of their total number of inhabitants, workforce and economic activity; a similar pattern was also observed in France and the United Kingdom.
In the most populous EU Member State, Germany, the metropolitan region of the capital Berlin accounted for the lowest share of national population, employment and GDP (all within the range of 5–6 %). The metropolitan region of Roma also recorded a relatively low share of the total number of inhabitants in Italy (around 1 in 14). As such, Germany and Italy, as well as Poland and Romania, were characterised by more polycentric patterns of development, with several cities accounting for relatively high shares of their populations, economic activity and employment, and conversely the capital city metropolitan region accounting for a relatively low share. For example, Roma accounted for less than 10.0 % of the total number of inhabitants, the workforce and economic output in Italy, while Warszawa accounted for 8.7 % of the Polish population, 10.5 % of its workforce and 17.1 % of its GDP.
… although Paris and London accounted for a relatively high share of economic activity
The unequivocally large size of the metropolitan regions of Paris and London — with more than 10 million inhabitants each — meant that each of these two global capitals accounted for almost one third of their national GDP, while their shares of national population were lower, at closer to one fifth of the total; these figures reinforce the view that the economies of France and the United Kingdom displayed a monocentric pattern of development. Although considerably smaller than Paris or London, the Irish and Greek capital cities also reflected a broadly monocentric pattern of development, with Dublin and Athina generating close to 50 % of their national GDP, while their shares of the total number of inhabitants and workforce were somewhat lower.
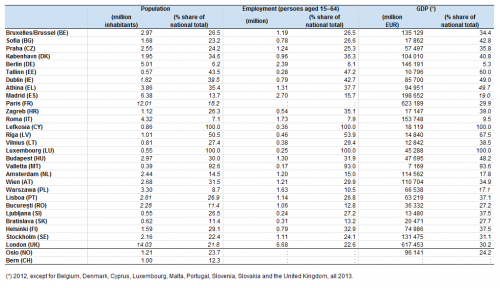
Source: Eurostat (met_pjanaggr3), (met_lfe3emp), (met_10r_3gdp), (demo_pjan), (lfsa_egan) and (nama_10_gdp)
Berlin was the only capital in the EU with GDP per inhabitant below its national average
GDP per inhabitant provides a proxy measure of living standards: when expressed in purchasing power standards (PPS) it is adjusted to take account of the price level differences between EU Member States; note however that there may also be considerable price level differences within individual Member States — for example, the cost of living in Paris is, for most people, much higher than in Bordeaux, Lille or Lyon. Furthermore, GDP per inhabitant fails to reflect a number of negative externalities that may be of considerable importance for some individuals in relation to their standard of living.
Figure 1 presents GDP per inhabitant for the metropolitan regions of the EU’s capital cities in relation to national averages. In 2013, the standard of living among those residing in the Slovakian capital of Bratislava was 2.4 times as high as the national average. A similar situation was observed in the capitals of Bulgaria, Poland and Romania, where GDP per inhabitant for those resident in the metropolitan regions of Sofia, Warszawa or Bucureşti was, on average, 1.9–2.3 times as high as the national average in 2012.
Among the largest EU Member States, the French and German capital cities stood out. GDP per inhabitant in Paris was 64 % higher than the French national average in 2012. By contrast, the standard of living in Berlin was 16 % lower than its national average, the only capital city in the EU where this situation was observed. The standard of living in the metropolitan regions of Roma, Madrid (Spain) and London (2013 data) was 37-41 % higher than their respective national average.
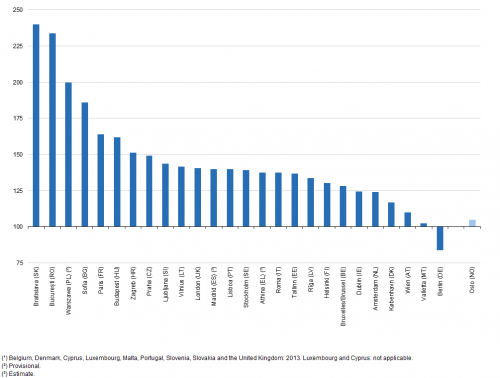
(national average = 100; based on PPS per inhabitant)
Source: Eurostat (met_10r_3gdp) and (nama_10_pc)
A network of relatively large cities was distributed quite evenly across Germany
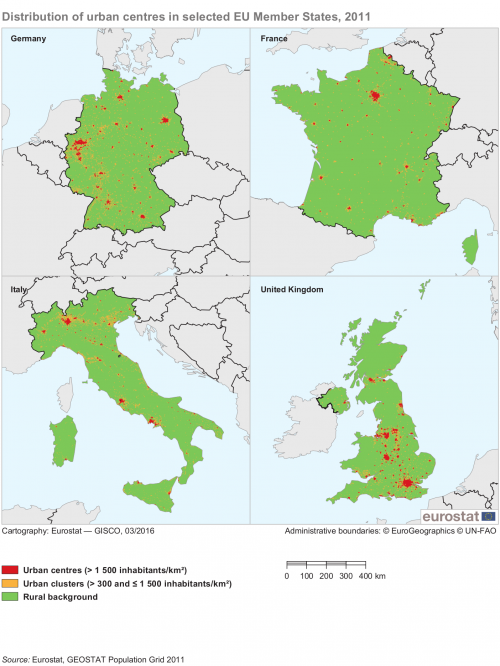
The urban morphology of the EU’s largest economies differs in terms of the number, hierarchy and distribution of cities. Map 1 provides an overview of population distribution across the four most populous EU Member States, highlighting those urban centres with high-density clusters. Germany is characterised by a polycentric distribution of its major cities, from Hamburg in the north, to Köln in the west, München in the south and Berlin in the east, with a number of relatively large cities (for example, Bremen, Hannover, Frankfurt am Main, Stuttgart, Nürnberg, Dresden and Leipzig) spread in a network across the remainder of its territory.
In France, the capital of Paris occupies a prominent position in terms of its location, from which transport links run in a radial pattern to other cities. Outside of the capital, the main urban centres in France are often located around (or close to) its coastline. A relatively high proportion of the population in France inhabits rural areas and these are spread over the majority of its territory. Although not shown, there was a similar pattern observed in Spain, with the capital city Madrid in the centre of the country and a pattern of radial transport links to other cities, most of which were located around the coast. In contrast to France, the interior of Spain is largely arid and often characterised by sparsely populated areas.
The patterns of urban morphology in Italy and the United Kingdom are less uniform. Besides the capital of Roma, there are two other significant urban clusters in Italy, with high-density urban conurbations centred on Milano in the north and Napoli to the south of the capital. The urban morphology of northern Italy is not dissimilar to that found in Germany, insofar as there is a network of relatively large cities distributed quite evenly across its territory, while south of Firenze this pattern ceases and relatively sparsely populated areas become the norm, with the distribution of urban areas more akin to that in Spain.
In the United Kingdom, London is by far the largest urban agglomeration. The other metropolitan regions are principally those of the West Midlands (including Birmingham) and Merseyside/Greater Manchester in the north-west of England. The morphology of the United Kingdom is quite distinct insofar as there are relatively short distances between these high-density areas, with the bulk of the population living in the south-east of the territory, while most parts of Wales or Scotland are sparsely populated.
In Germany, the second city had a higher number of inhabitants than the capital city
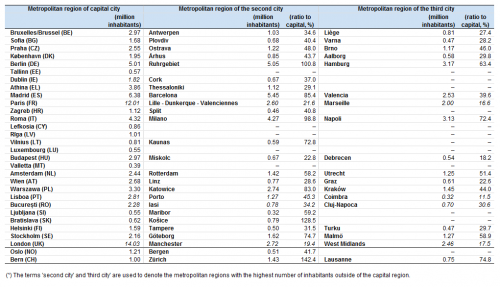
Table 3 presents information on the number of inhabitants residing in the three largest metropolitan regions of each EU Member State; note that under this typology there are only 17 Member States with three or more metropolitan regions (see the table for more information on data coverage).
The aggregated number of inhabitants living in the 17 capital cities of those EU Member States with at least three metropolitan regions was 71.1 million inhabitants in 2014. A similar calculation reveals there were 33.6 million inhabitants living in their second cities and 22.9 million inhabitants living in their third cities. As such, these aggregate figures show a close relationship to Zipf’s law, insofar as the population of the metropolitan regions of the 17 capital cities was, on average, 2.1 times as high as that recorded for second cities and 3.1 times as high as for third cities.
Zipf’s law
Initially based on a language study, Zipf’s law states that the frequency of use of any word is inversely proportional to its rank. In other words, the most frequently used word (‘the’ in the English language) will occur approximately twice as often as the second most frequently used word (‘of’), three times as often as the third most frequently used word (‘and’), etc. Such a rule based on frequency and rank has been applied to a number of other situations across a range of natural and social sciences. It has been shown to apply to the distribution of: income between individuals; enterprises operating in a particular economic activity; or the size of cities.
Zipf’s law in relation to city sizes suggests that the city with the largest population in a given country is generally twice as large as the second largest city, and three times as large as the third largest city, and so on. Empirically, there are a number of studies that show the distribution of city sizes tends to converge to Zipf’s law, at least at the upper end of the distribution among larger cities.
Within the individual EU Member States there were also examples that approximated closely to Zipf’s law, for example:
- in Bulgaria, the population of Sofia (1.68 million inhabitants) was 2.5 times as large as in Plovdiv (0.68 million inhabitants) and 3.5 times as high as in Varna (0.47 million inhabitants);
- in Denmark the population of København (1.95 million inhabitants) was 2.3 times as large as in Århus (0.85 million inhabitants) and 3.4 times as high as in Aalborg (0.58 million inhabitants).
However, there were also examples that diverged from Zipf’s law, for example, in Germany and Italy there were only minor differences between the number of inhabitants living in the capital city and the second city, whereas the number of inhabitants residing in the capitals of Hungary, France and the United Kingdom was substantially bigger than that recorded in each of their respective second cities:
- in Hungary, the population of Budapest (2.97 million inhabitants) was 4.4 times as large as in Miskolc (0.67 million inhabitants);
- in France, the population of Paris (12.01 million inhabitants) was 4.6 times as large as in the conurbation of Lille - Dunkerque - Valenciennes (2.60 million inhabitants);
- in the United Kingdom, the population of London (14.03 million inhabitants) was 5.2 times as high as in (Greater) Manchester.
Source: Eurostat (met_pjanaggr3)
Are capital cities growing?
An inverse relationship between the population size of an EU Member State and the share of its capital city in the national economy has already been mentioned earlier in this chapter (see Table 2). This analysis is extended by introducing a time dimension to look at developments during a recent 10-year period during which the relative importance of capital cities was seen to grow in the vast majority of the 25 EU Member States for which data are available (metropolitan regions for the capital cities of Cyprus and Luxembourg equate to the whole of their national territory at NUTS level 3, while the main island of Malta accounts for the vast majority of its territory (Gozo is excluded); these three Member States are therefore excluded from this analysis).
All but one of the EU’s capital cities accounted for a growing share of their national population
The number of inhabitants residing in capital cities as a share of national populations grew in all but one of the EU Member States between 2004 and 2014 (see Figure 2). Athina was the only exception as its share of the Greek population fell from 36.0 % to 35.4 %, perhaps reflecting the effects of the financial and economic crisis and subsequent sovereign debt crisis during which Greece experienced a strong increase in emigration. There was no change in the share of the French population living in Paris, while the number of inhabitants residing in Madrid and Berlin rose modestly relative to their national populations.
The most rapid shifts in population towards capital cities were recorded in the three Baltic Member States. The proportion of the Estonian population living in Tallinn rose from 39.3 % to 43.5 % during the period 2004–14 — an increase of 4.2 percentage points — while the share of the population living in the Latvian and Lithuanian capitals of Rīga and Vilnius rose by 2.8 and 2.6 percentage points respectively; in Sofia and Budapest there was also a relatively rapid transformation, as an increasing share of the national population chose to live in the Bulgarian and Hungarian capitals.
Between 2003 and 2013, the Austrian capital of Wien was the only metropolitan region among the 19 for which data are available (see Figure 3), to report that its share of national GDP fell (2003–12); there was no change in the share of Portuguese GDP generated in its capital, Lisboa. Otherwise, each of the remaining 17 EU Member States reported an increasing share of their economic activity being generated within their capital. This shift was most pronounced in Bulgaria and Romania (both 2003–12), as the share of economic activity that was generated in Sofia and Bucureşti increased by 9.0 percentage points and 6.0 percentage points respectively.
In 13 out of the 19 Member States for which data are available, the shift in economic activity towards the capital city was at a faster pace than the change recorded for population, suggesting that these capital cities were becoming increasingly productive in relation to the rest of the country or that commuter inflows were increasing; the exceptions were Tallinn, Wien, Rīga, Lisboa, Praha and Helsinki.

(%)
Source: Eurostat (met_pjanaggr3) and (demo_pjan)

(%)
Source: Eurostat (met_10r_3gdp) and (nama_10_gdp)
Patterns of urban development among the largest EU Member States
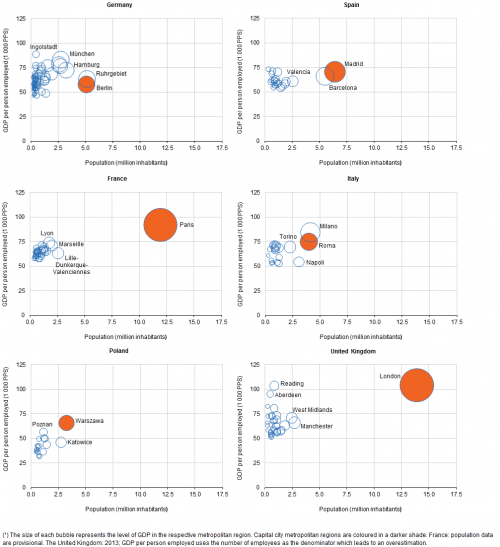
An alternative approach to analyse the importance of capital cities relative to their national economies is presented in Figure 4, which shows the number of inhabitants living in the metropolitan regions of the largest EU Member States, as well as their GDP per person employed, which may be used as an indicator to measure labour productivity or more generally competitiveness; note the size of each bubble represents the overall level of GDP for each city. The advantage of the ratio of GDP to the number of persons employed is that it is not influenced by commuter flows, as commuters are included in the number of persons employed and contribute to GDP.
Paris and London play an influential role in their national economies
Paris and London appeared as distinct outliers, with each of these megacities playing an influential role in their national economies, accounting for very high shares of the total number of inhabitants and overall GDP, as well as the highest levels of GDP per person employed; note that GDP per person employed for all of the cities in the United Kingdom is based on the number of employees as the denominator which leads to an overestimation. Warszawa also recorded the biggest share of its national population and the highest level of GDP per person employed, although its size and level of productivity were far more in keeping with the other Polish cities.
It is interesting to note that Milano, the second largest city in Italy had a somewhat higher level of productivity than the capital Roma and that these two cities were almost equal in terms of their number of inhabitants, while the two main cities in Spain — Madrid and Barcelona — also recorded results that were within close proximity of each other. The pattern observed in Germany was similar insofar as the two largest metropolitan regions in population terms, Berlin and the Ruhrgebiet, were again almost the same size and also recorded similar levels of productivity; however, these were not — as in most other EU Member States — the highest productivity levels in the national economy.
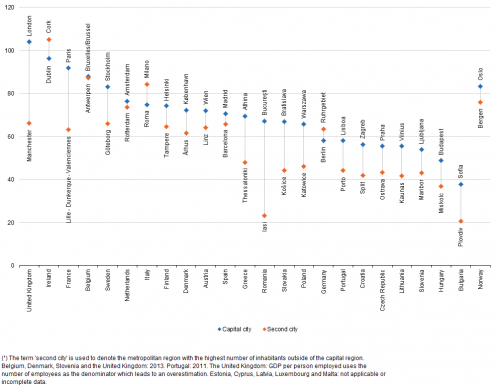
A more detailed picture is presented in Table 4: in 2012 there were only three EU Member States where the capital city failed to record the highest level of GDP per person employed. Two of these were Berlin and Roma (as mentioned above), while the third was the Irish capital of Dublin. Although Dublin recorded the second highest level of GDP per person employed among EU capitals (just behind London), there was one metropolitan region in Ireland with a higher level of productivity, namely, the southern Irish city of Cork, which is home, among others, to a number of pharmaceutical and information technology multinationals.
Source: Eurostat (met_pjanaggr3), (met_10r_3gdp) and (met_10r_3emp)

Source: Eurostat (met_pjanaggr3), (met_10r_3gdp) and (met_10r_3emp)
A comparison between productivity levels for the capital city and second city of each EU Member State shows that the widest disparities between metropolitan regions were recorded in Romania, where GDP per person employed in Bucureşti was 2.9 times as high as in the second city of Iasi. There was also a relatively wide gap in productivity levels between the capitals of Paris, Bratislava, London and Sofia and their respective second cities of Lille - Dunkerque - Valenciennes, Košice, (Greater) Manchester and Plovdiv, with GDP per person employed 1.5–1.8 times as high in these four capitals. Many of the capital cities with the highest levels of productivity and the widest gaps (in relation to productivity levels in their second cities) were located in those Member States characterised by a monocentric pattern of economic development.
(1 000 PPS)
Source: Eurostat (met_pjanaggr3), (met_10r_3gdp) and (met_10r_3emp)
Capital city economic developments to the detriment of provincial cities?
A comparison between GDP per inhabitant and GDP per person employed may be used to examine differences between standards of living on the one hand and labour productivity/competitiveness on the other (see Figure 6). The differences shown reflect, among others, employment rates in each city and the impact of commuter flows; more information on commuting is presented in Chapter 9.
With these provisos, the overall patterns in Figure 6 confirm that Paris and London had considerably higher standards of living and productivity than their second to fifth largest cities, emphasising the monocentric nature of economic developments in these two economies. In the United Kingdom the gaps between London and the four largest provincial cities were particularly wide, as (Greater) Manchester, the West Midlands, Glasgow and Liverpool each reported a level of GDP per inhabitant below the national average for the United Kingdom. A similar pattern was observed for the two southern Italian cites of Napoli and Bari, where GDP per inhabitant was lower than in Roma and also below the national average.
All four of the provincial cities in Germany had higher levels of GDP per inhabitant than the capital of Berlin and three out of the four — Hamburg, München and Stuttgart — reported an average standard of living that was above the national average.

(capital city = 100; based on values in PPS terms)
Source: Eurostat (met_pjanaggr3), (met_10r_3gdp) and (met_10r_3emp)
Source data for tables and graphs
Direct access to
- Urban Europe — statistics on cities, towns and suburbs (online publication)
- Degree of urbanisation classification - 2011 revision
- Eurostat regional yearbook
- Statistics on regional typologies in the EU
- Regions and cities (all articles on regions and cities)
- Territorial typologies
- Territorial typologies for European cities and metropolitan regions
- What is a city?
- Urban audit (ESMS metadata file — urb_esms)
- Regional statistics by typology (ESMS metadata file — reg_typ_esms)
- European Commission, Directorate-General for Regional and Urban Policy, Urban development
- European Commission, Directorate-General for Regional and Urban Policy, A harmonised definition of cities and rural areas: the new degree of urbanisation
- OECD, Redefining urban — a new way to measure metropolitan areas

