Unused files
The following files exist but are not embedded in any page. Please note that other web sites may link to a file with a direct URL, and so may still be listed here despite being in active use.
Showing below up to 50 results in range #1 to #50.
View (previous 50 | next 50) (20 | 50 | 100 | 250 | 500)
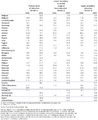
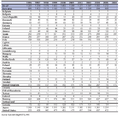
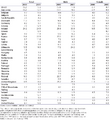
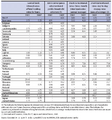
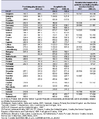 Healthcare indicators (per 100 000 inhabitants).PNG 572 × 690; 40 KB
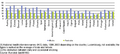
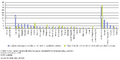
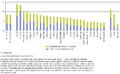
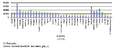
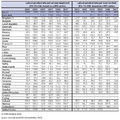
 Minimum wages in EU Member States and Turkey.PNG 947 × 721; 65 KB
 Daily smokers, 2003 (1) (% of male female population).PNG 556 × 250; 10 KB
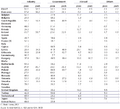 Gross domestic expenditure on R&D by source of funds.PNG 927 × 842; 81 KB
 20090304152555!GDP per capita at current market prices, 2007.PNG 716 × 336; 25 KB
 Daily smokers among the population aged 15-24, 2003 (1).PNG 919 × 469; 40 KB
 Farm labour force, 2005.PNG 927 × 1,058; 129 KB
 Life expectancy at 65, 2006 (1)(years).PNG 675 × 301; 23 KB
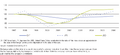
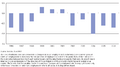
 Net migration (including corrections), EU-27 (1)(1 000).PNG 673 × 302; 18 KB
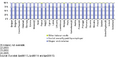
 Pupil-teacher ratio in primary, lower and upper secondary education (1).PNG 932 × 1,139; 119 KB
 Student mobility in tertiary education, 2005 (1).PNG 930 × 467; 39 KB
 Tax rate on low wage earners- tax wedge on labour cost, 2006 (%).PNG 677 × 287; 20 KB
 Total catches in all fishing regions(1 000 tonnes live weight).PNG 682 × 695; 77 KB
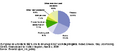 Utilisation of milk, EU, 2007(%) (1).PNG 395 × 169; 5 KB
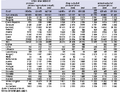
 Agricultural production of crops, 2006.PNG 926 × 1,100; 141 KB
 Relative median at-risk-of-poverty gap, 2006(%).PNG 682 × 327; 21 KB
 Total aquaculture production(1 000 tonnes live weight).PNG 688 × 676; 65 KB
 Unemployment rates by duration, 2006.PNG 915 × 562; 60 KB
 Agricultural output and value added (EUR million).PNG 485 × 371; 20 KB
 Breakdown of labour costs, business economy, 2006 (1).PNG 556 × 263; 11 KB
 Expenditure on care for elderly, 2005 (1)(% of GDP).PNG 695 × 344; 24 KB
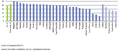
 Maastricht criterion rates, annual average for 2007.PNG 938 × 544; 41 KB
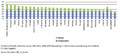
 Resource productivity (GDP per DMC).PNG 846 × 422; 28 KB
 State aid, 2005.PNG 920 × 615; 62 KB
 20090303130830!GDP per capita at current market prices, 2007.PNG 489 × 209; 7 KB
 Science and technology graduates.PNG 925 × 1,007; 106 KB
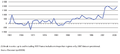
 20090304140335!Exchange rates against the euro (1).PNG 901 × 414; 36 KB
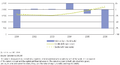 Current account transactions, EU-27 (1).PNG 906 × 489; 35 KB
 Interest rates (%).PNG 680 × 726; 82 KB
 Labour cost growth, EU-27.PNG 918 × 514; 41 KB
 Labour productivity.PNG 681 × 680; 97 KB
 Overweight people, 2003 (1)(% of total population).PNG 679 × 317; 22 KB

.PNG)
,_2006_(per_100_000_inhabitants).PNG)

.PNG)
_(%25_of_male_female_population).PNG)
.PNG)

(million).PNG)
(%25,_based_on_acid_equivalents).PNG)

_(fi_nal_consumption_by_private_households_including_indirect_taxes,_EU-27%3D100).PNG)
.PNG)


(years).PNG)
,_EU-27_(1)(1_000).PNG)
.PNG)
.PNG)
.PNG)
.PNG)
_(1).PNG)

.PNG)
.PNG)

.PNG)
.PNG)
(%25_of_GDP).PNG)

_in_total_nonfinancial_business_economy_employment,_by_NUTS_2_regions,_2005_Percentage.PNG)
.PNG)

(%25_of_sectoral_total).PNG)

.PNG)
_(1998%3D100,_based_on_the_number_of_serious_accidents_per_100_000_persons_employed).PNG)

(%25_of_sectoral_total).PNG)
.PNG)
.PNG)
(1_000).PNG)
.PNG)


(%25_of_total_population).PNG)
_(%25_share_of_total_gross_value_added).PNG)
.PNG)
).PNG)