Gallery of new files
This special page shows the last uploaded files.
 Share of utility vehicles in total number of vehicles, the 15 EU regions with the highest shares, NUTS 2 regions, 2022 (%) .png N00btduu
09:12, 16 July 2024
1,209 × 560; 46 KB
 Share of utility vehicles in total number of vehicles, the 15 EU regions with the lowest shares, NUTS 2 regions, 2022 (%) .png N00btduu
09:12, 16 July 2024
1,090 × 590; 45 KB
 Share of electric passenger cars, by NUTS 2 regions, 2022 upd.png N00btduu
09:12, 16 July 2024
2,000 × 2,000; 885 KB
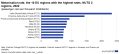
 Motorisation rate, the 10 EU regions with the lowest rates, NUTS 2 regions, 2022 (passenger cars per thousand inhabitants).png N00btduu
09:12, 16 July 2024
1,000 × 473; 33 KB
 Motorisation rate, the 10 EU regions with the highest rates, NUTS 2 regions, 2022 (passenger cars per thousand inhabitants).png N00btduu
09:12, 16 July 2024
1,000 × 451; 31 KB
 Motorisation rate, by NUTS 2 regions, 2022 upd.png N00btduu
09:11, 16 July 2024
2,000 × 2,000; 897 KB
 Influenza vaccination rate, people aged 65 years or over, EU, 2009–22 (%) Health2024.png EXT-S-Allen
09:06, 16 July 2024
1,000 × 625; 38 KB
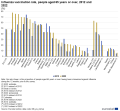 Influenza vaccination rate, people aged 65 years or over, 2012 and 2022 (%) Health2024.png EXT-S-Allen
09:06, 16 July 2024
1,001 × 927; 75 KB

 Standardised death rate from influenza, 2021 (per 100 000 inhabitants) Health2024.png EXT-S-Allen
09:06, 16 July 2024
1,001 × 851; 53 KB
 Data sources for immunisation against influenza (among population aged 65 or over), 2022 Health2024.png EXT-S-Allen
09:06, 16 July 2024
1,026 × 789; 41 KB
- Healthcare activities statistics - consultations Health2024.xlsx EXT-S-Allen
09:06, 16 July 2024
; 628 KB
- Healthcare activities statistics - consultations-interactive Health2024.xlsx EXT-S-Allen
09:06, 16 July 2024
; 12 KB
 Consultation of a medical doctor, average 2019–21 and 2022 (average number of consultations per inhabitant) Health2024.png EXT-S-Allen
09:06, 16 July 2024
1,000 × 924; 100 KB
 Consultation of a dentist, 2022 (average number of consultations per inhabitant) Health2024.png EXT-S-Allen
09:06, 16 July 2024
1,001 × 696; 63 KB
 Colorectal cancer screening rate, people aged 50 to 74 years, 2022 (%) Health2024.png EXT-S-Allen
09:06, 16 July 2024
1,000 × 901; 72 KB
 Breast cancer screening, women aged 50 to 69 years, 2012 and 2022 (%) Health2024.png EXT-S-Allen
09:06, 16 July 2024
1,001 × 1,109; 114 KB
 Cervical cancer screening rate, women aged 20 to 69 years, 2022 (%) Health2024.png EXT-S-Allen
09:06, 16 July 2024
1,000 × 1,123; 109 KB
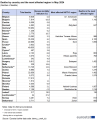
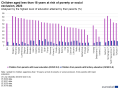 Fig3 Children less 18y AROPE, 2023 by parents education (%).png N00bteb4
14:34, 15 July 2024
1,001 × 751; 67 KB
 Fig2 People AROPE, by age group, 2023 (% of population in respective age group).png N00bteb4
14:34, 15 July 2024
1,000 × 768; 65 KB
 Fig1 Children AROPE, 2022 and 2023 (% of population in respective age group).png N00bteb4
14:33, 15 July 2024
999 × 687; 55 KB
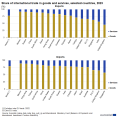
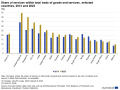 Share of services within total trade of goods and services, selected countries, 2013 and 2023 (%) GL2024.png EXT-S-Allen
12:15, 15 July 2024
1,000 × 748; 68 KB
 International trade in services, selected countries, 2013, 2022 and 2023 GL2024.png EXT-S-Allen
12:15, 15 July 2024
1,026 × 575; 43 KB
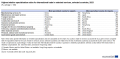 Highest relative specialisation ratios for international trade in selected services, selected countries, 2023 (%, average = 100) GL2024.png EXT-S-Allen
12:15, 15 July 2024
1,025 × 504; 51 KB
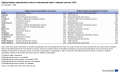 Highest relative specialisation ratios for international trade in selected services, 2023 (%, average = 100) GL2024.png EXT-S-Allen
12:15, 15 July 2024
1,024 × 623; 62 KB
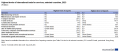 Highest levels of international trade for services, selected countries, 2023 (EUR billion) GL2024.png EXT-S-Allen
12:15, 15 July 2024
1,025 × 448; 38 KB
 Developments for international trade in services, selected countries, 2013–23 (2013 = 100) GL2024.png EXT-S-Allen
12:15, 15 July 2024
3,202 × 3,242; 299 KB
 Derived indicators for international trade in services, selected countries, 2013 and 2023 GL2024.png EXT-S-Allen
12:15, 15 July 2024
1,024 × 512; 34 KB

 Value of international trade in goods and services, selected countries, 2023 (EUR billion) GL2024.png EXT-S-Allen
12:15, 15 July 2024
1,000 × 791; 55 KB
 Share of world trade for goods and services, selected countries, 2012–22 (%) GL2024.png EXT-S-Allen
12:15, 15 July 2024
1,034 × 1,074; 80 KB
 Share of international trade in goods and services, selected countries, 2023 (%) GL2024.png EXT-S-Allen
12:15, 15 July 2024
3,193 × 3,108; 221 KB
 International trade in goods and services relative to GDP, selected countries, 2013 and 2023 (%) GL2024.png EXT-S-Allen
12:15, 15 July 2024
1,074 × 887; 63 KB
- 1.1 World trade in goods and services - overview GL2024.xlsx EXT-S-Allen
12:15, 15 July 2024
; 684 KB
 F1Share of external inflow from neighbouring territories in renewable freshwater resources - long-term average.png Maphoto
09:08, 15 July 2024
1,010 × 639; 61 KB
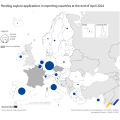
 F8 Applications processed under the accelerated procedure over the last twelve months APR2024 V2.png Errarau
16:32, 12 July 2024
1,623 × 993; 91 KB
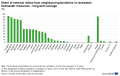
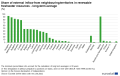
 Share of the population connected to at least secondary urban wastewater treatment, 2000-2022 (%).png Horvaju
15:55, 12 July 2024
833 × 761; 47 KB
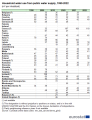 Household water use from public water supply, 1990-2022 (m³ per inhabitant).png Horvaju
15:53, 12 July 2024
606 × 791; 44 KB
 Share of external inflow from neighbouring territories in renewable freshwater resources - long-term average (%).png Horvaju
15:51, 12 July 2024
1,010 × 639; 60 KB
 Share of external inflow from neighbouring territories in renewable freshwater resources - long-term average.png Horvaju
15:44, 12 July 2024
1,010 × 639; 60 KB
_.png)
_.png)

.png)
.png)

_Health2024.png)
_Health2024.png)
_Health2024.png)
,_2022_Health2024.png)
_Health2024.png)
_Health2024.png)
_Health2024.png)
_Health2024.png)
_Health2024.png)

.png)
.png)
.png)
_GL2024.png)

_GL2024.png)
_GL2024.png)
_GL2024.png)
_GL2024.png)


_GL2024.png)
_GL2024.png)
_GL2024.png)
_GL2024.png)


.png)
.png)
.png)
