Tutorials
Log in
Statistics Explained
menu
search
search
Navigation
Main page
Statistical themes
Glossary
Categories
Statistics 4 beginners
Tutorials
Help
Eurostat home
Education corner
Online publications
Regional yearbook
Sustainable development
Full list
Tools
User contributions
Logs
View user groups
Special pages
search
Navigation
Main page
Statistical themes
Glossary
Categories
Statistics 4 beginners
Tutorials
Help
Eurostat home
Education corner
Online publications
Regional yearbook
Sustainable development
Full list
Tools
User contributions
Logs
View user groups
Special pages
Navigation
Main page
Statistical themes
Glossary
Categories
Statistics 4 beginners
Tutorials
Help
Eurostat home
Education corner
Online publications
Regional yearbook
Sustainable development
Full list
Tools
User contributions
Logs
View user groups
Special pages
Uploads by Gnjatte
This special page shows all uploaded files.
File list
Items per page:
20
50
100
250
500
Search for media name:
Username:
Include old versions of files
Go
First page
Previous page
Next page
Last page
Date
Name
Thumbnail
Size
Description
Versions
12:12, 21 June 2024
Energy production and imports 2023.xlsx
(
file
)
254 KB
1
12:08, 21 June 2024
Supply of fossil fuels & nuclear, EU, index 2005=100 1990-2023.png
(
file
)
83 KB
1
12:02, 21 June 2024
Supply of coal and coal products, EU, kt2023.png
(
file
)
45 KB
1
12:00, 21 June 2024
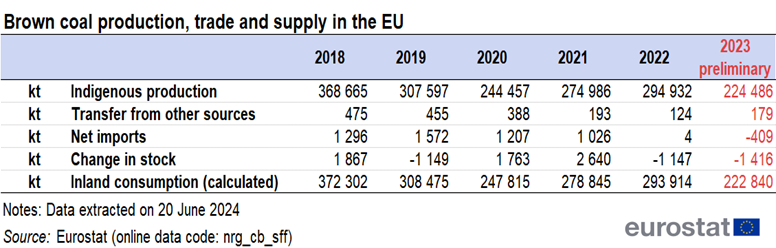
Brown coal production, trade and supply in the EU2023.png
(
file
)
98 KB
1
11:59, 21 June 2024
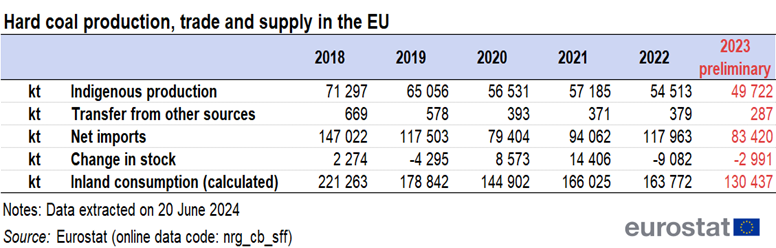
Hard coal production, trade and supply in the EU2023.png
(
file
)
100 KB
1
11:41, 21 June 2024
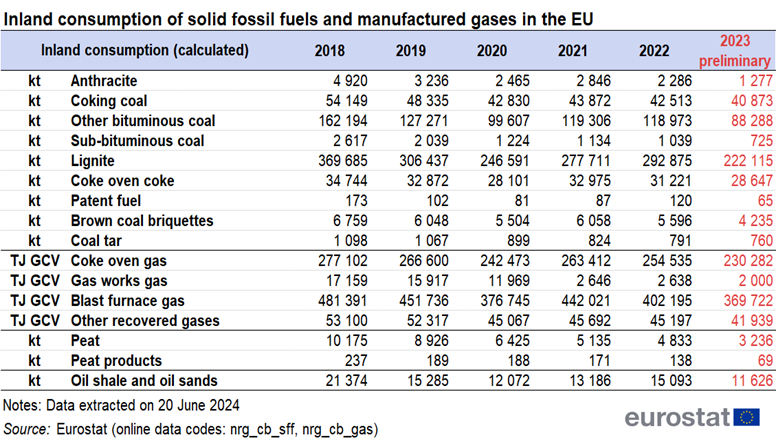
Inland consumption of solid fossil fuels and manufactured gases in the EU2023 v2.png
(
file
)
205 KB
1
11:23, 21 June 2024
Supply of gas in the grid, EU, TJ GCV2023.png
(
file
)
46 KB
1
11:13, 21 June 2024
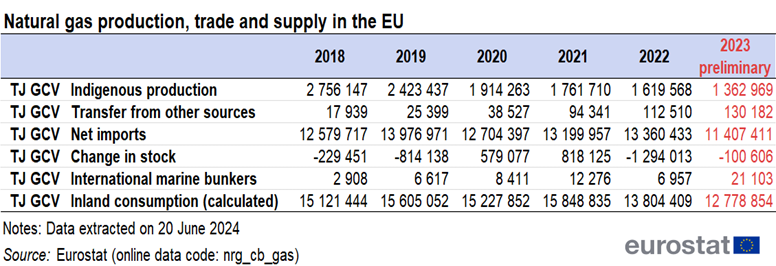
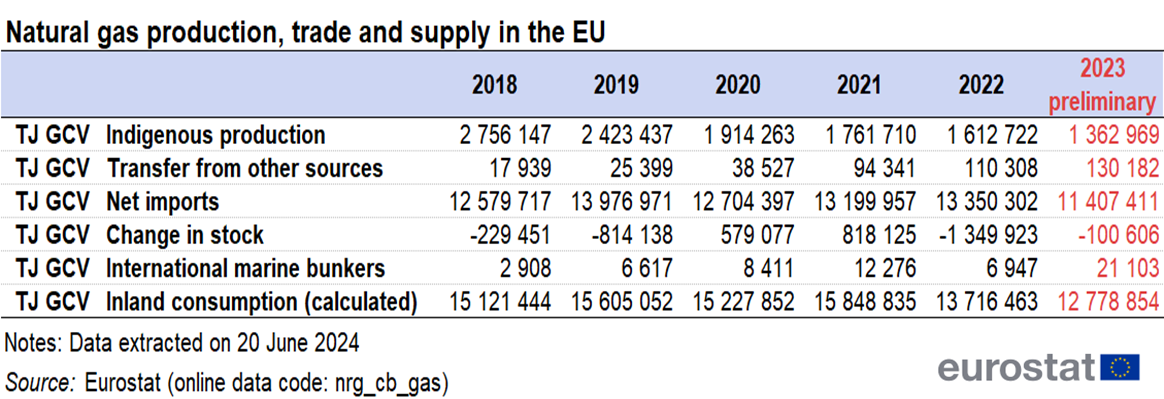
Natural gas production, trade and supply in the EU2023 v2.png
(
file
)
129 KB
1
10:22, 21 June 2024
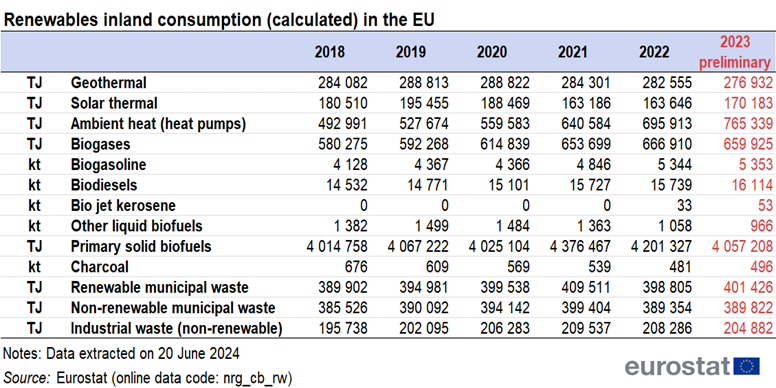
Renewables inland consumption (calculated) in the EU2023.png
(
file
)
184 KB
1
10:14, 21 June 2024
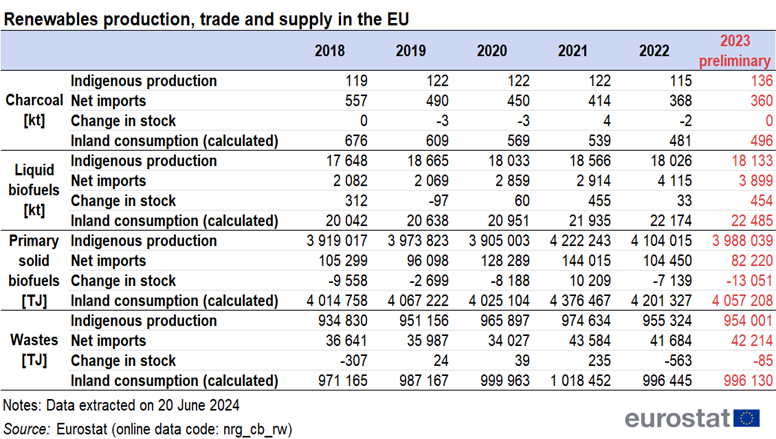
Renewables production, trade and supply in the EU2023.png
(
file
)
212 KB
1
10:04, 21 June 2024
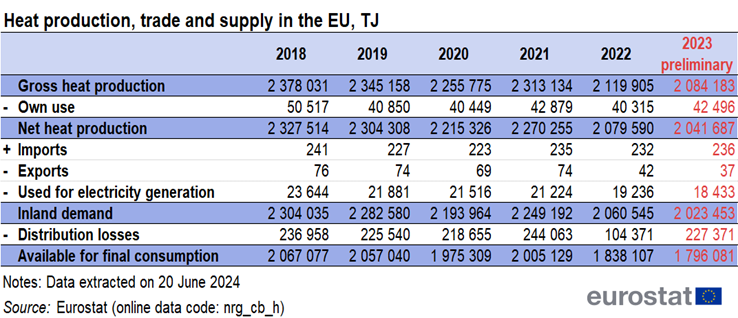
Heat production, trade and supply in the EU, TJ2023.png
(
file
)
161 KB
1
10:02, 21 June 2024
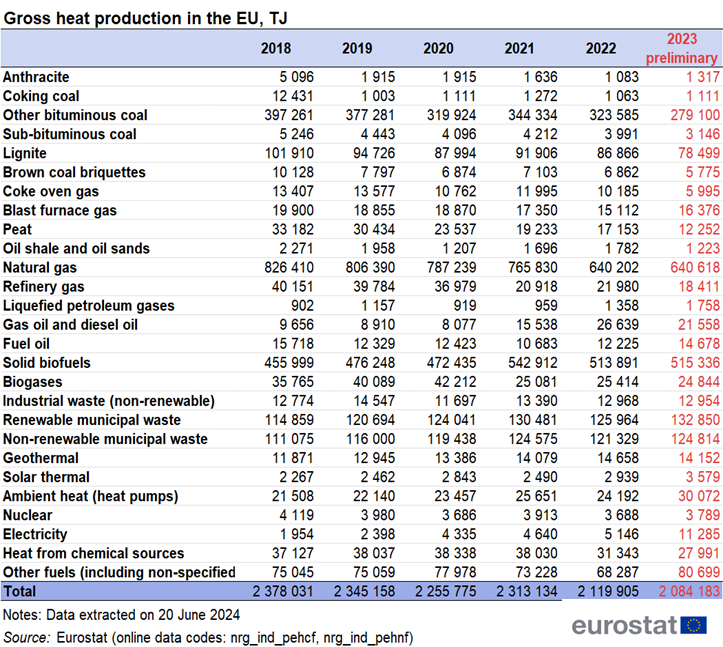
Gross heat production in the EU, TJ2023.png
(
file
)
306 KB
1
09:48, 21 June 2024
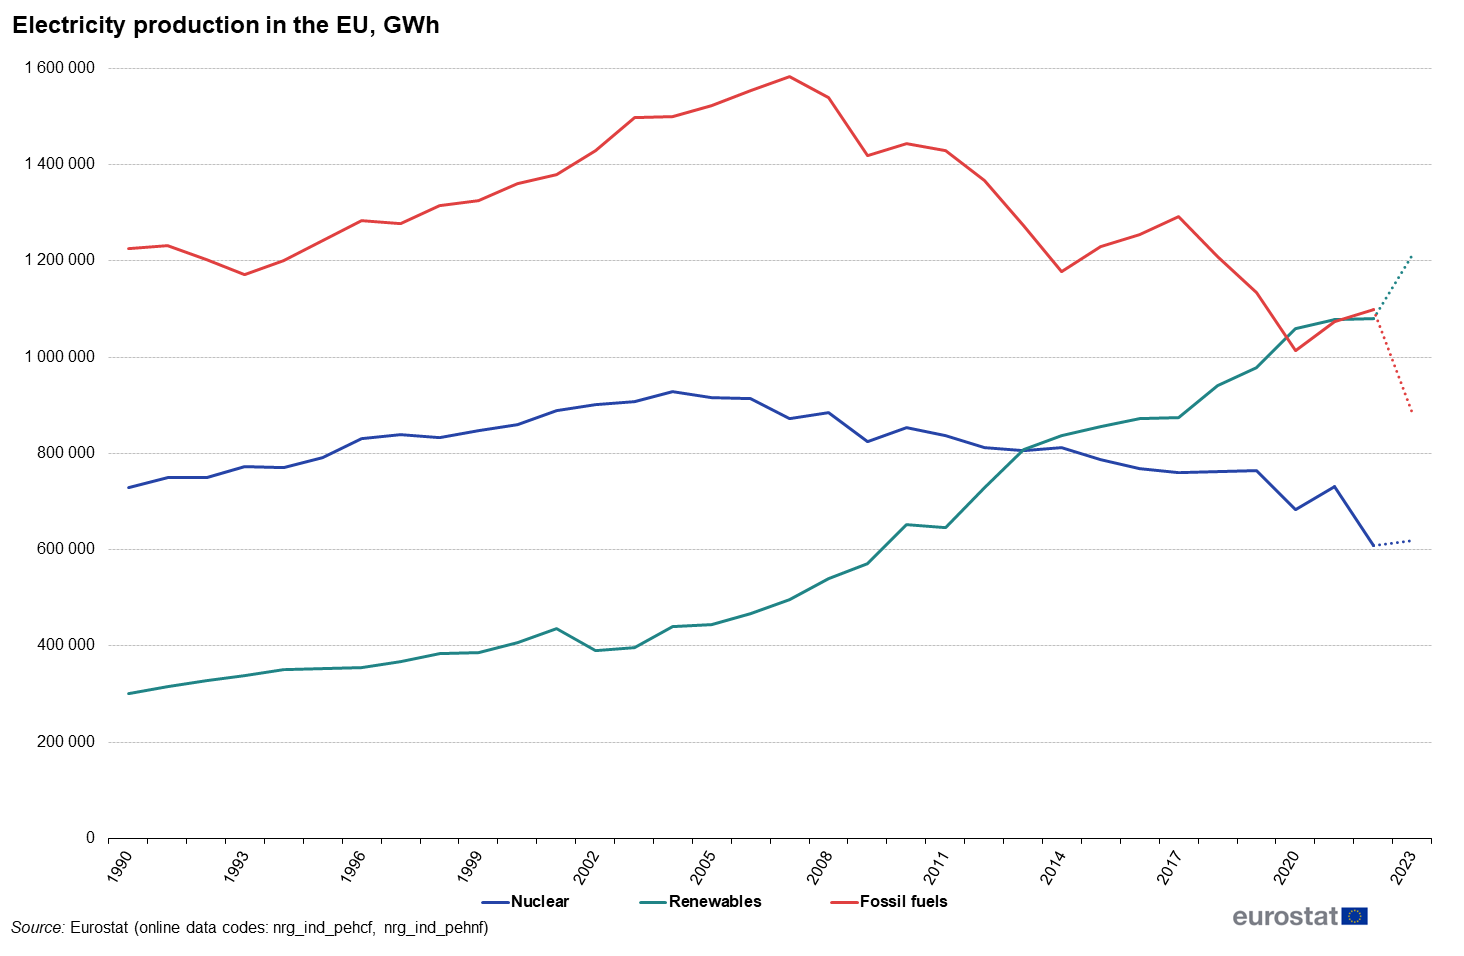
Electricity production in the EU, GWh2023.png
(
file
)
50 KB
1
09:42, 21 June 2024
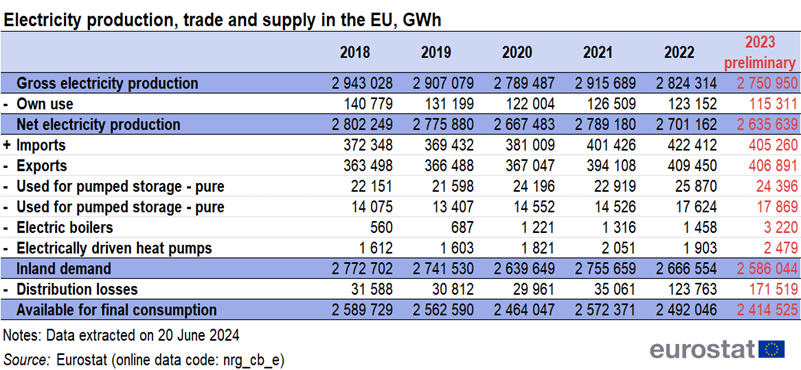
Electricity production, trade and supply in the EU, GWh2023.png
(
file
)
204 KB
1
09:39, 21 June 2024
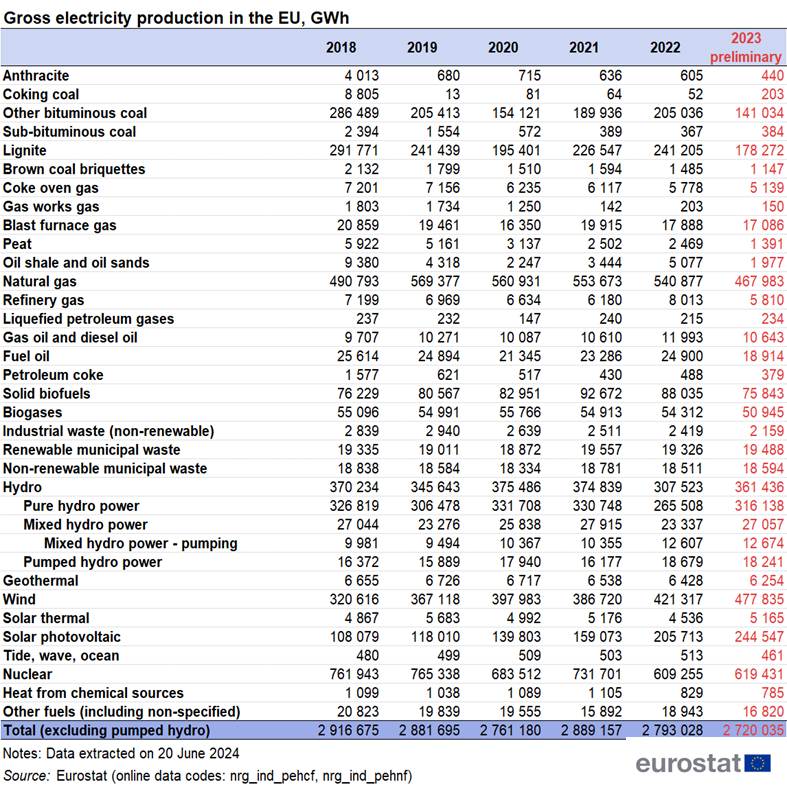
Gross electricity production in the EU, GWh2023.png
(
file
)
373 KB
1
00:36, 21 June 2024
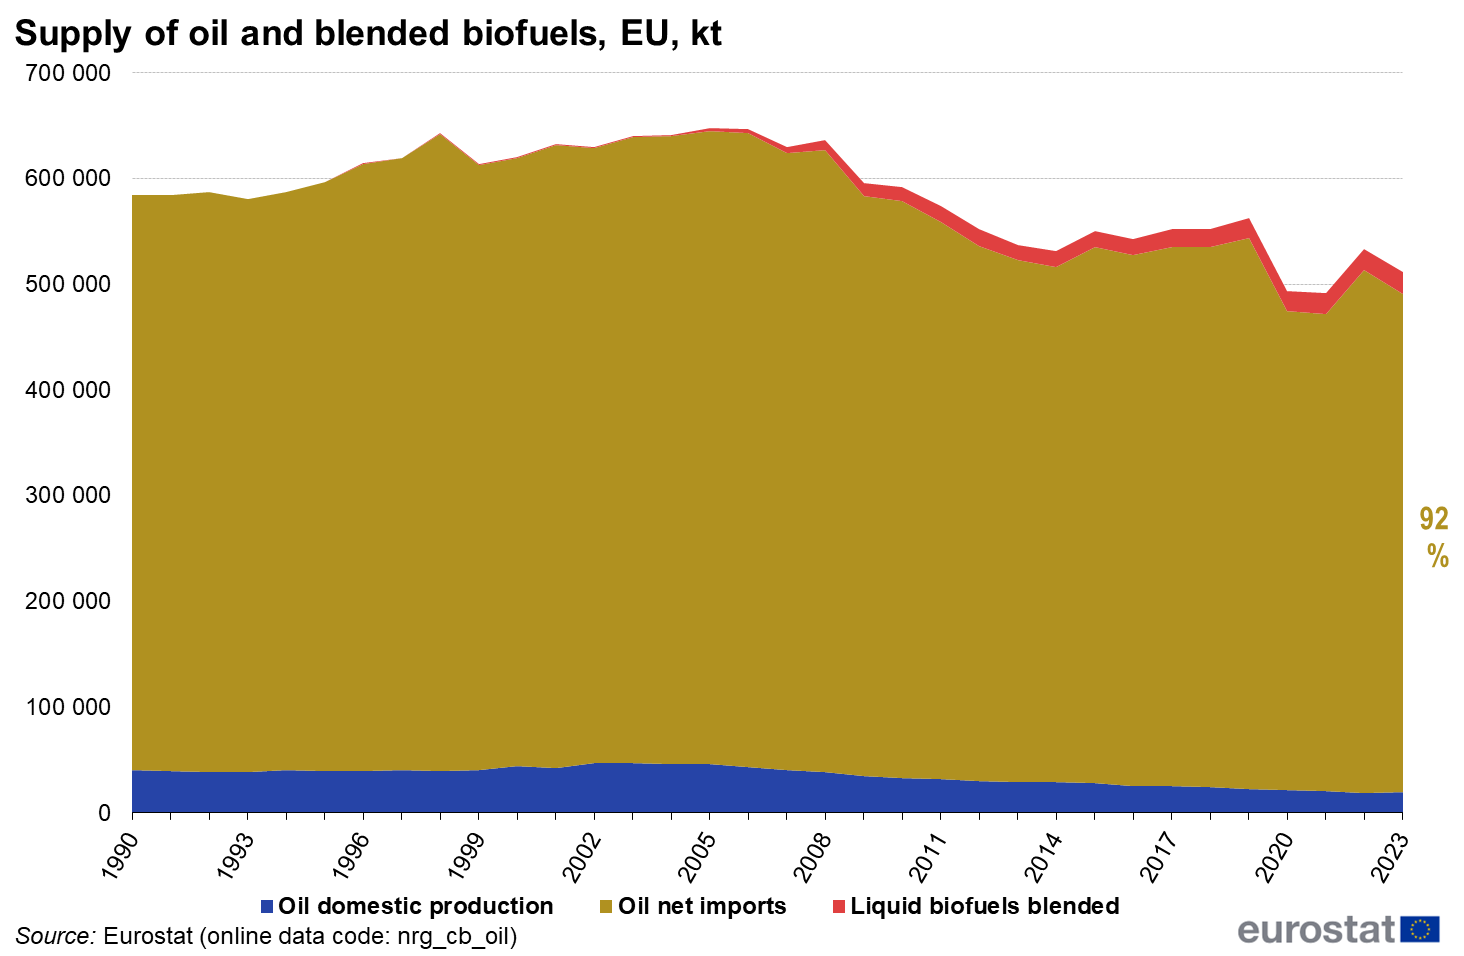
Supply of oil and blended biofuels, EU, kt2023.png
(
file
)
54 KB
1
00:30, 21 June 2024
Refinery gross output in the EU, kt2023.png
(
file
)
309 KB
1
00:28, 21 June 2024
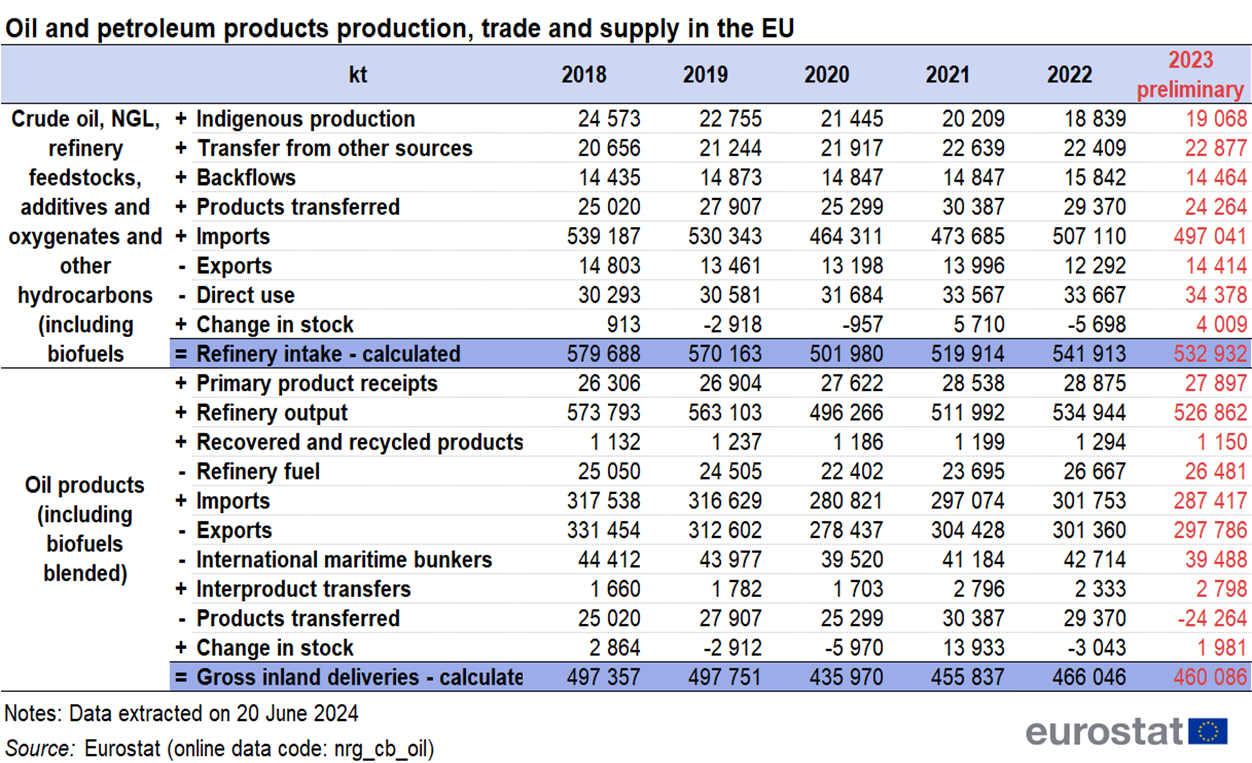
Oil and petroleum products production, trade and supply in the EU2023.png
(
file
)
536 KB
1
22:44, 20 June 2024
Natural gas production, trade and supply in the EU.png
(
file
)
239 KB
1
09:59, 8 May 2024
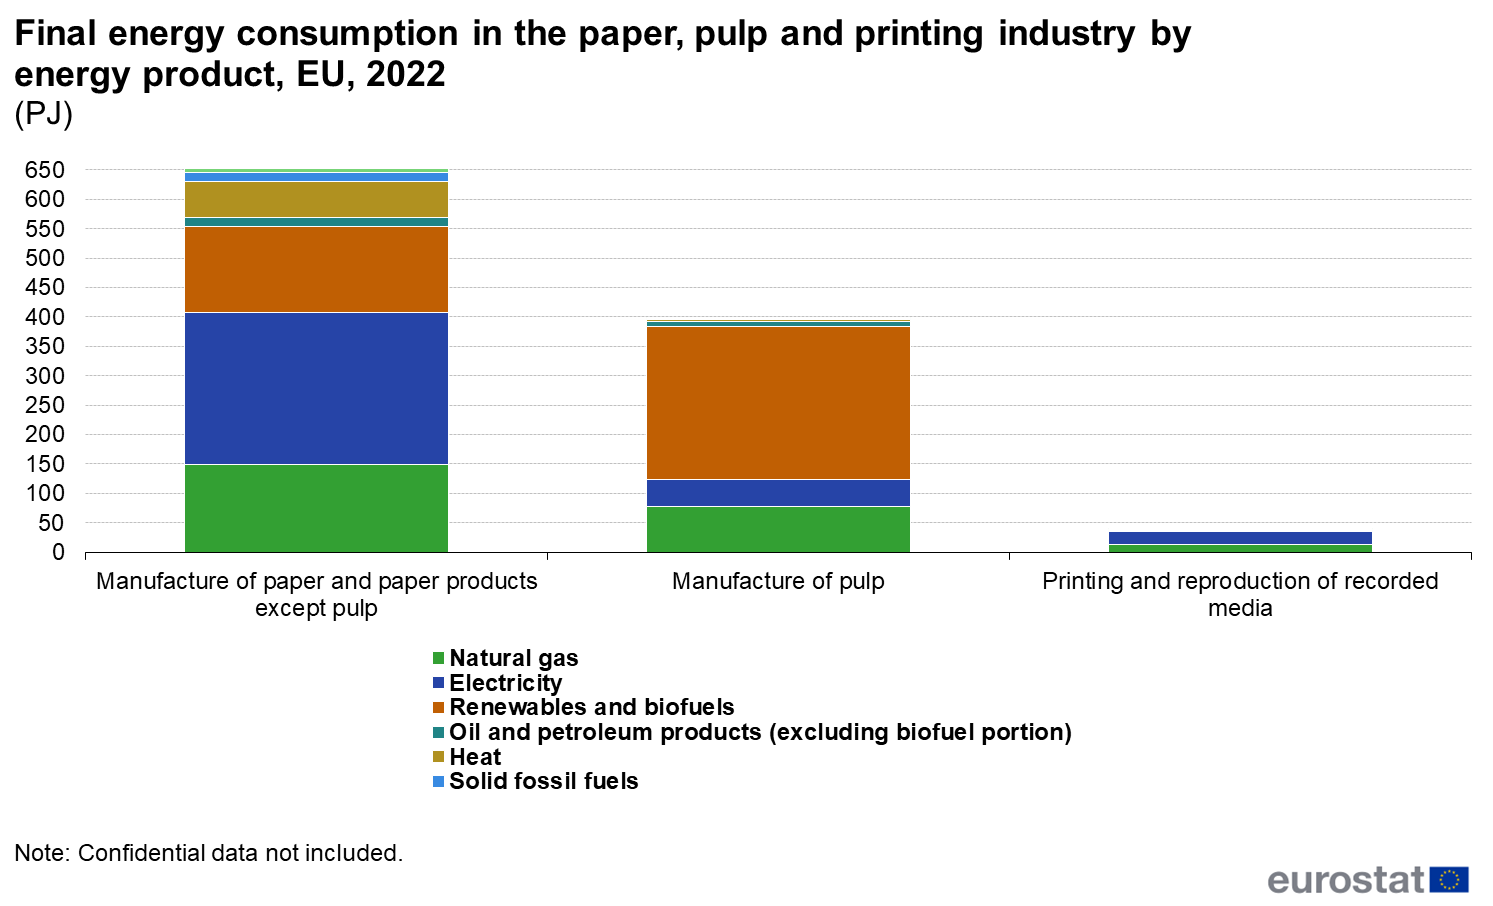
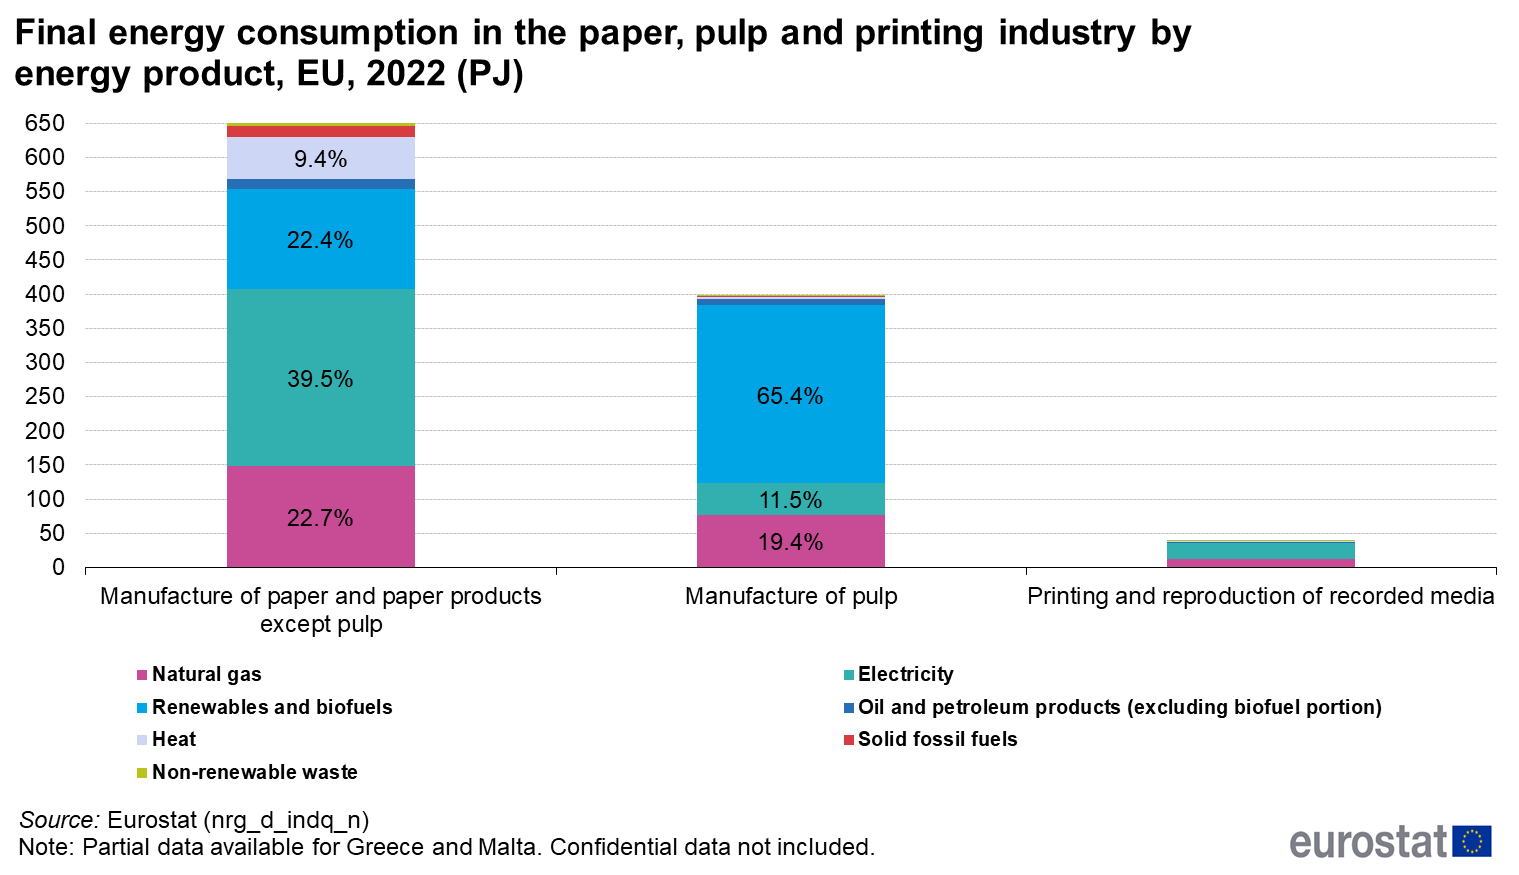
Final energy consumption in the paper, pulp and printing industry by energy product, EU, 2022 (PJ) v4.png
(
file
)
32 KB
1
09:57, 8 May 2024
Final energy consumption in the non-metallic minerals industry by energy product, EU, 2022 (PJ) v4.png
(
file
)
35 KB
1
16:41, 7 May 2024
Disaggregated industry data 2022v2.xlsx
(
file
)
225 KB
1
16:40, 7 May 2024
Final energy consumption in the paper, pulp and printing industry by energy product, EU, 2022 (PJ) v3.png
(
file
)
54 KB
1
16:38, 7 May 2024
Final energy consumption in the non-metallic minerals industry by energy product, EU, 2022 (PJ) v3.png
(
file
)
58 KB
1
16:36, 7 May 2024
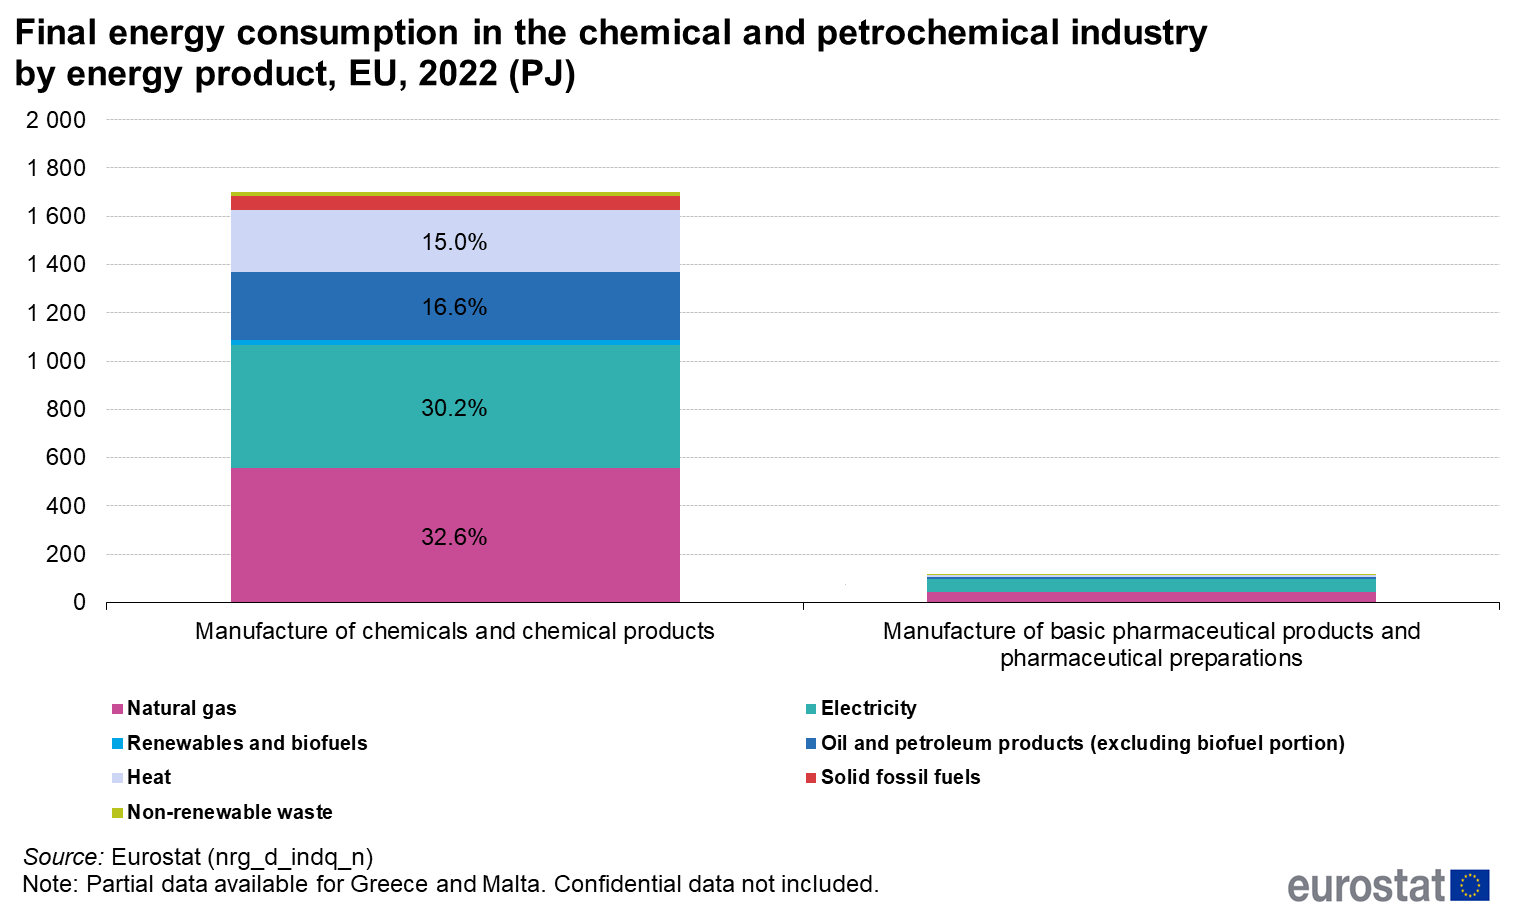
Final energy consumption in the chemical and petrochemical industry by energy product, EU, 2022 (PJ) v3.png
(
file
)
58 KB
1
16:34, 7 May 2024
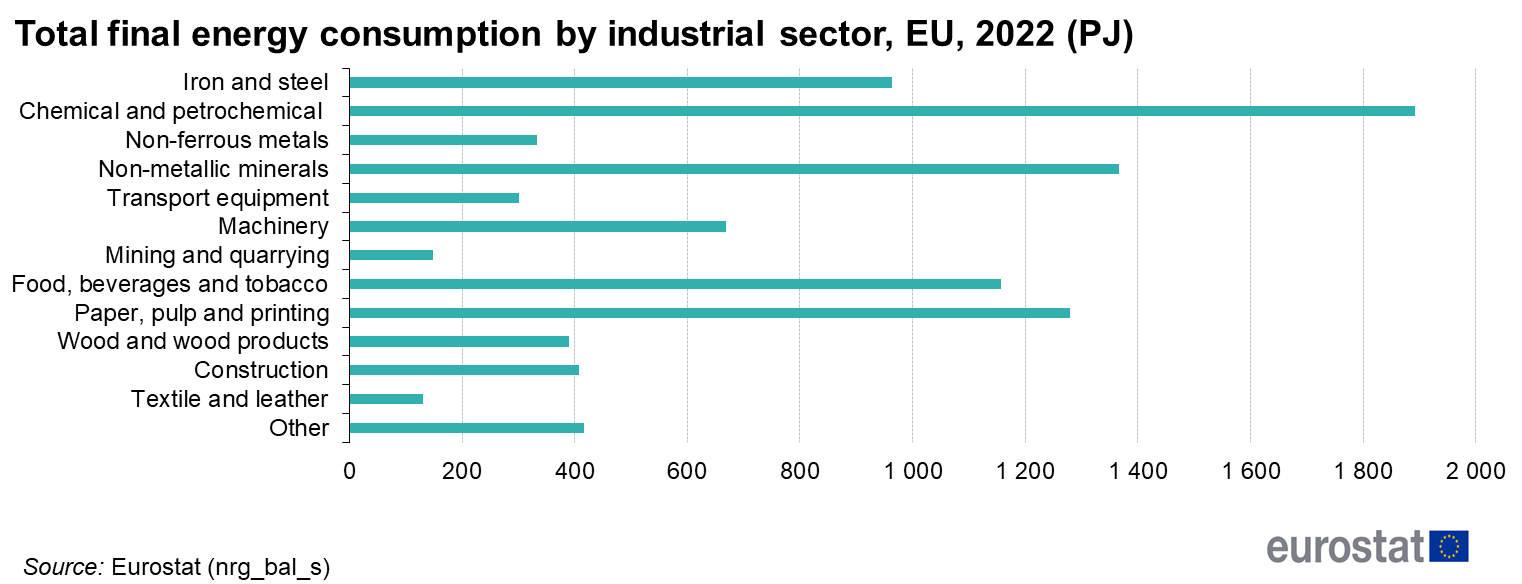
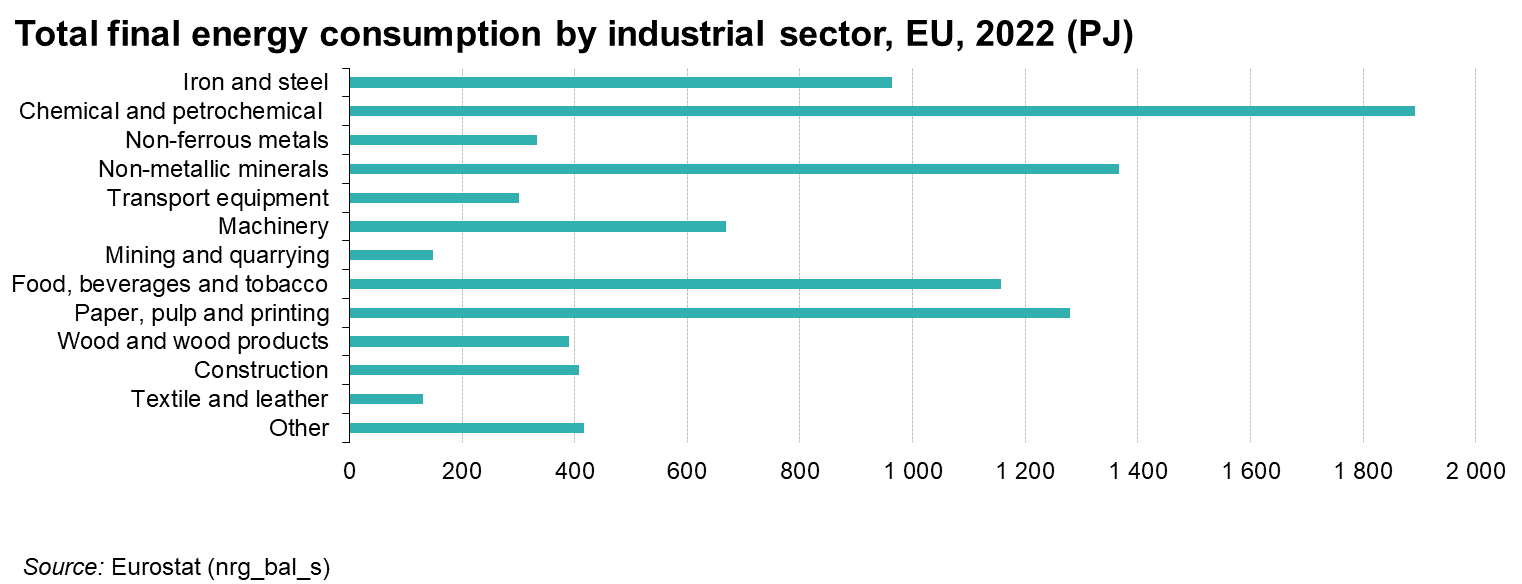
Total final energy consumption by industrial sector, EU, 2022 (PJ) v3.png
(
file
)
54 KB
1
16:33, 7 May 2024
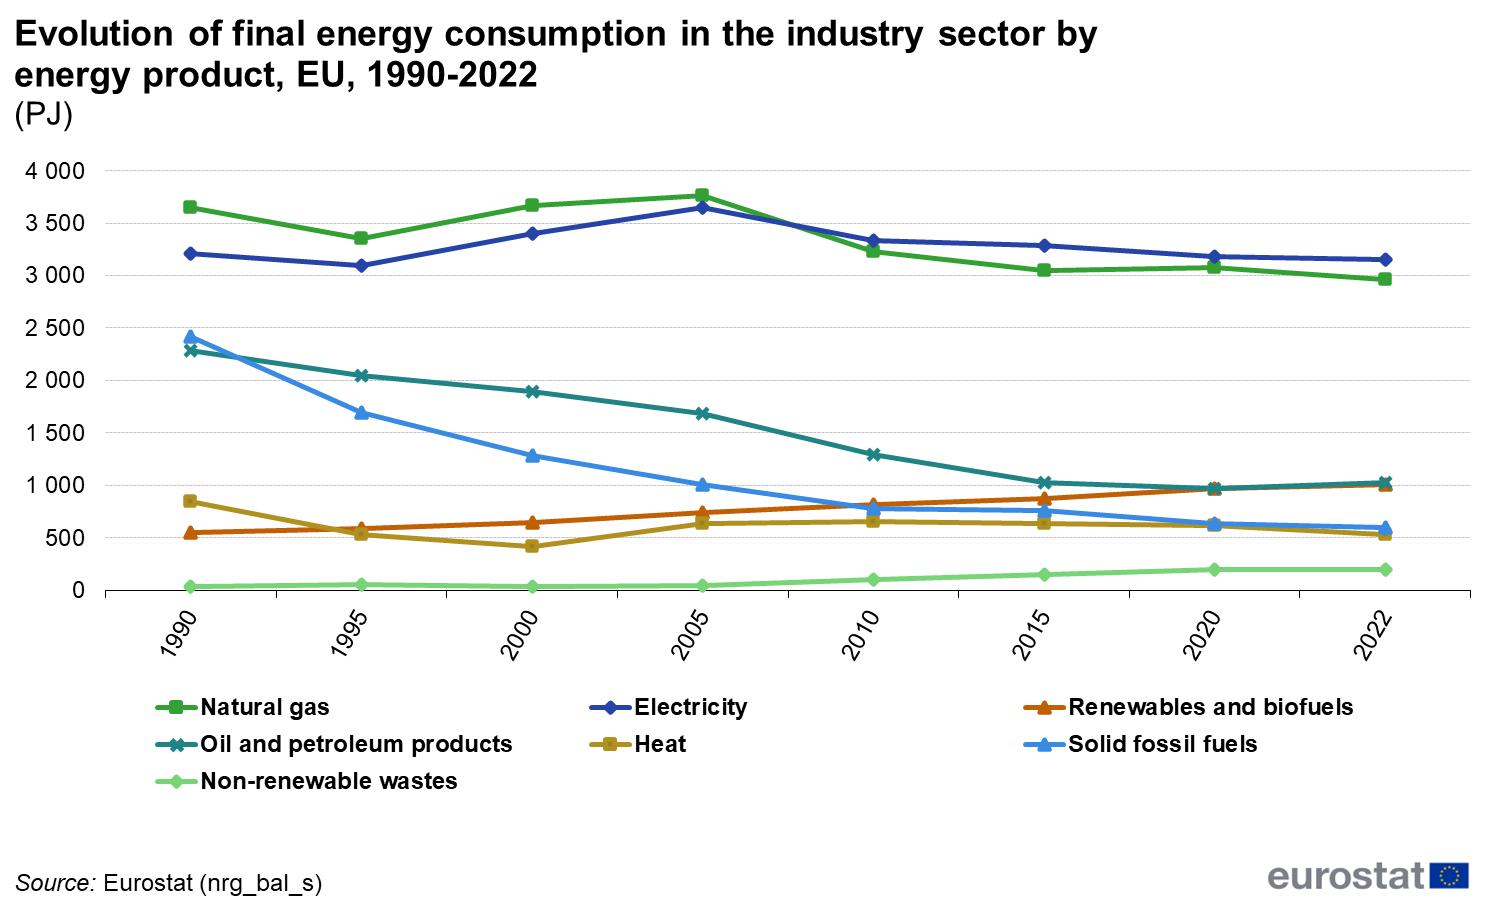
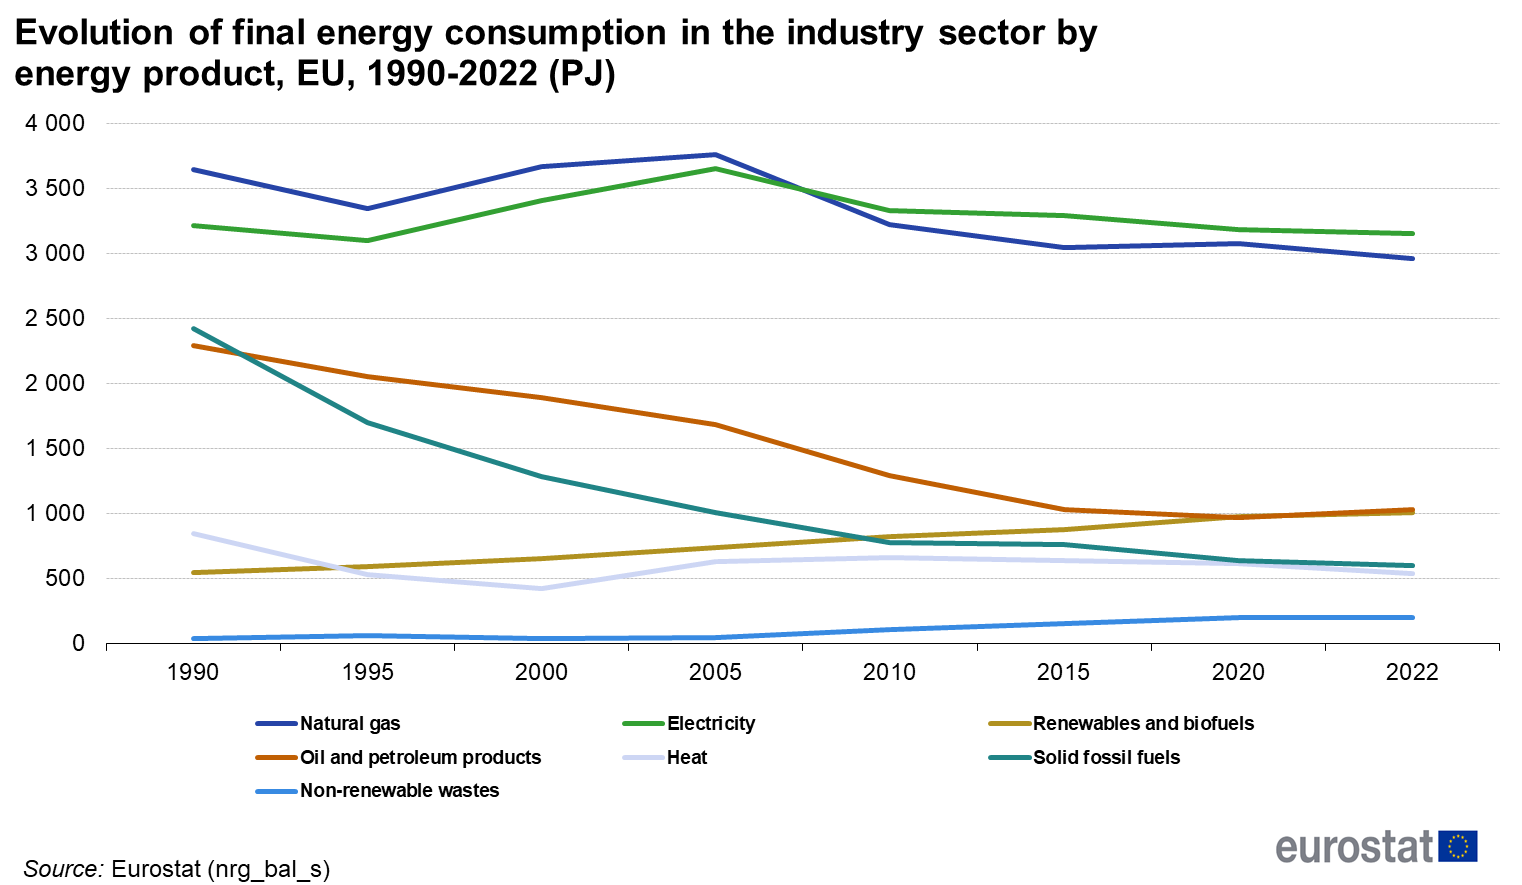
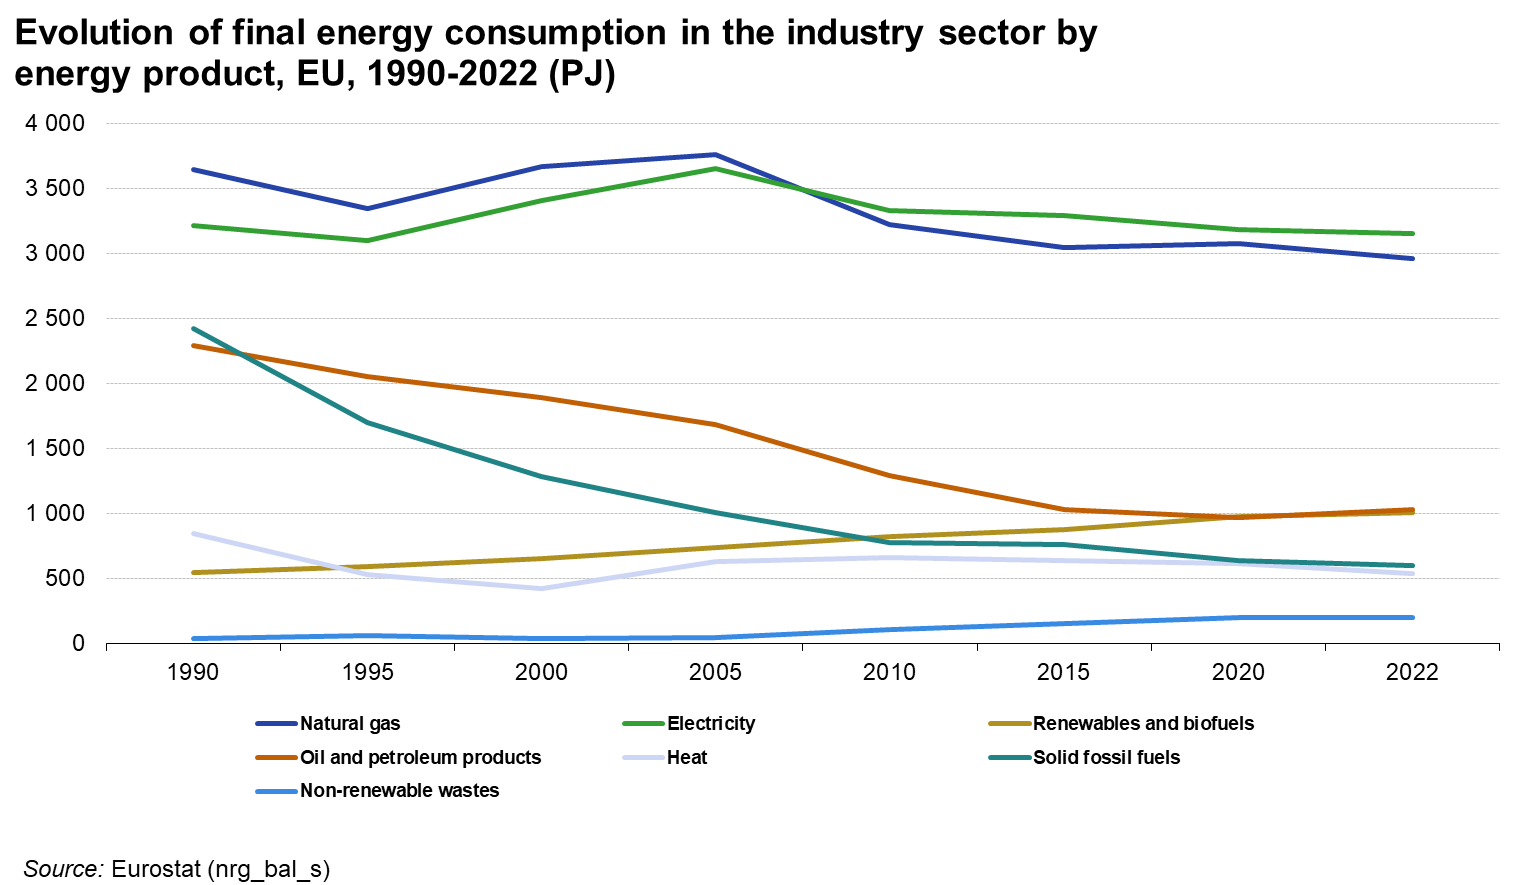
Evolution of final energy consumption in the industry sector by energy product, EU, 1990-2022 (PJ) v3.png
(
file
)
77 KB
1
16:30, 7 May 2024
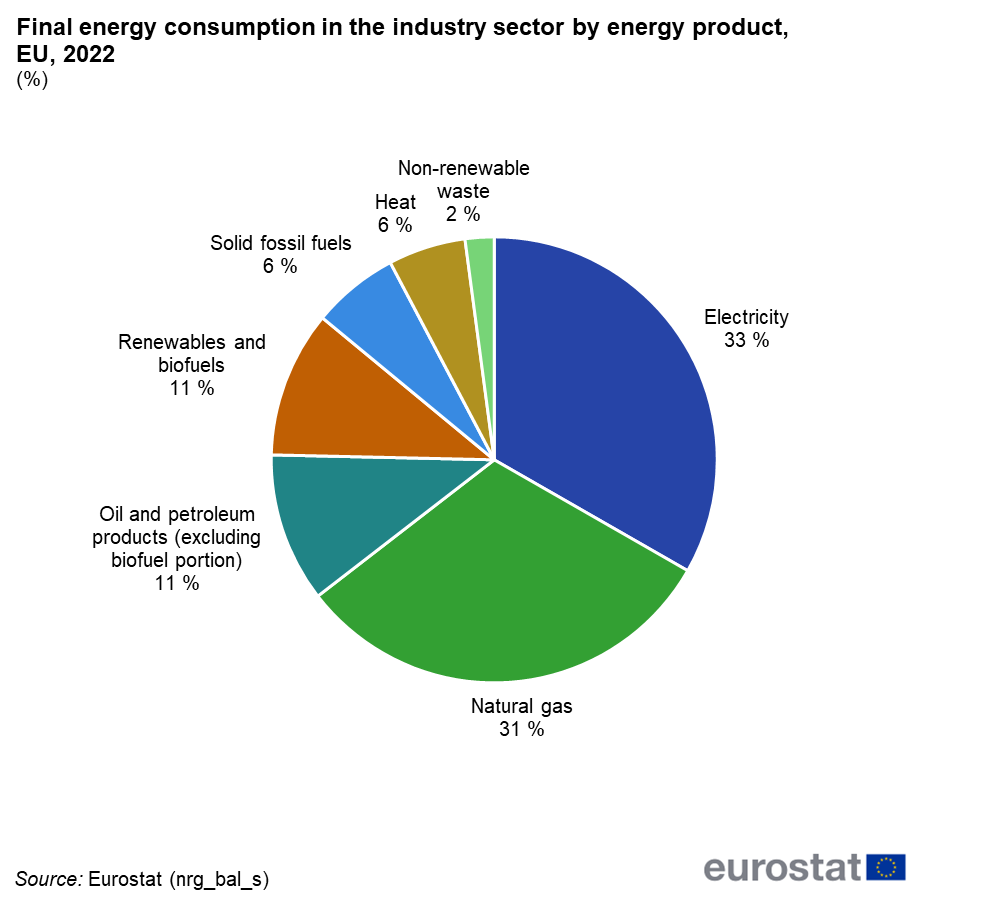
Final energy consumption in the industry sector by energy product, EU, 2022 (%) v3.png
(
file
)
50 KB
1
23:04, 6 May 2024
Disaggregated industry data 2022.xls
(
file
)
526 KB
1
23:03, 6 May 2024
Final energy consumption in the paper, pulp and printing industry by energy product, EU, 2022 (PJ).png
(
file
)
64 KB
1
23:01, 6 May 2024
Final energy consumption in the non-metallic minerals industry by energy product, EU, 2022 (PJ).png
(
file
)
70 KB
1
22:57, 6 May 2024
Final energy consumption in the chemical and petrochemical industry by energy product, EU, 2022 (PJ).png
(
file
)
60 KB
1
22:55, 6 May 2024
Total final energy consumption by industrial sector, EU, 2022 (PJ) v2.png
(
file
)
53 KB
1
22:54, 6 May 2024
Evolution of final energy consumption in the industry sector by energy product, EU, 1990-2022 (PJ) v2.png
(
file
)
69 KB
1
22:24, 6 May 2024
Total final energy consumption by industrial sector, EU, 2022 (PJ).png
(
file
)
27 KB
1
22:22, 6 May 2024
Evolution of final energy consumption in the industry sector by energy product, EU, 1990-2022 (PJ).png
(
file
)
62 KB
1
22:20, 6 May 2024
Final energy consumption in the industry sector by energy product, EU, 2022 (PJ).png
(
file
)
46 KB
1
23:03, 19 December 2023
Nuclear energy SE Data2022.xlsx
(
file
)
165 KB
1
16:51, 19 December 2023
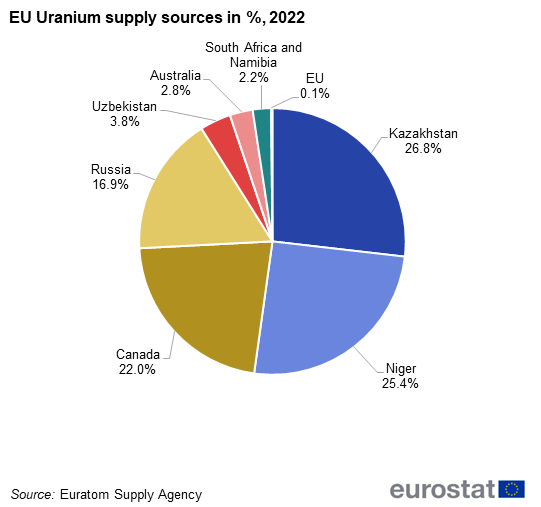
EU Uranium supply sources in %, 2022 v1.png
(
file
)
25 KB
1
16:50, 19 December 2023
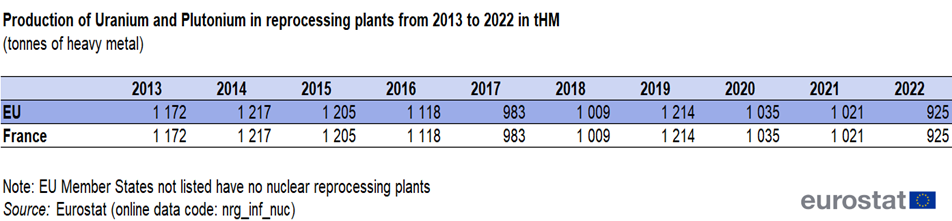
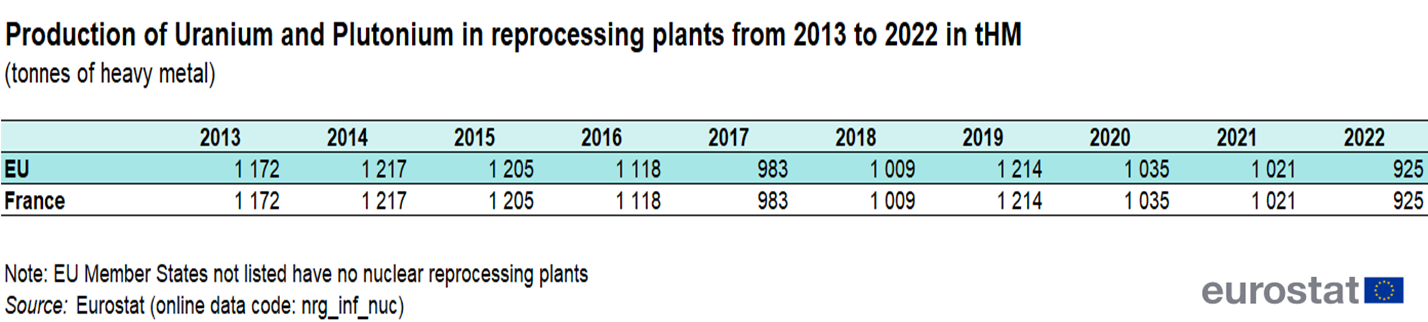
Production of Uranium and Plutonium in reprocessing plants from 2013 to 2022 in tHM (tonnes of heavy metal) v1.png
(
file
)
83 KB
1
16:49, 19 December 2023
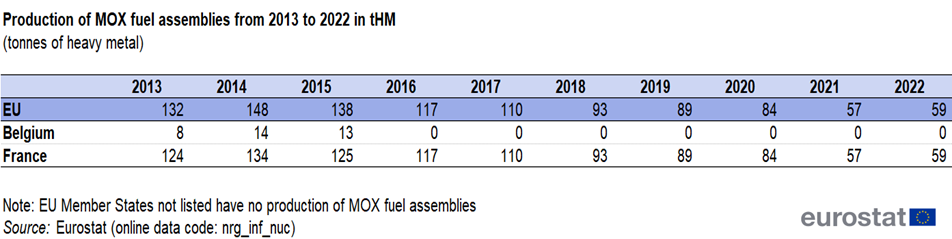
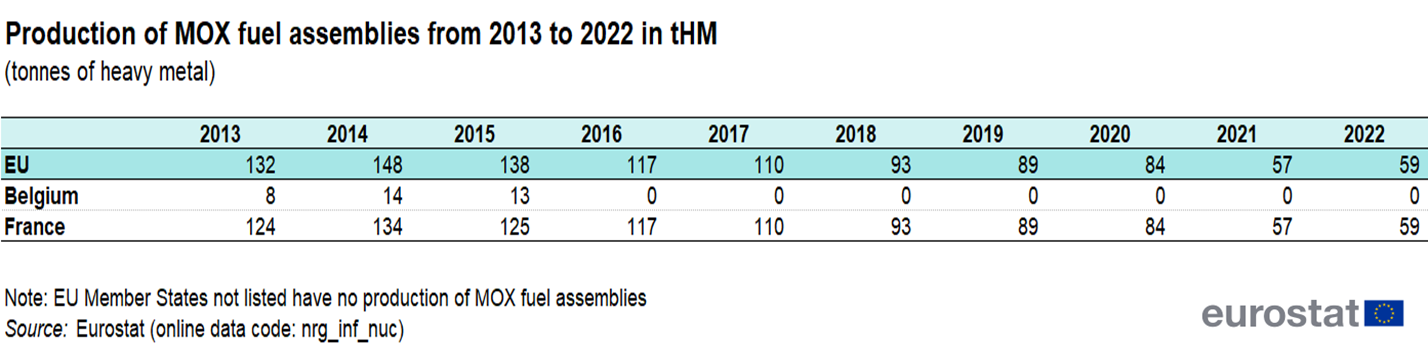
Production of MOX fuel assemblies from 2013 to 2022 in tHM (tonnes of heavy metal) v1.png
(
file
)
79 KB
1
16:47, 19 December 2023
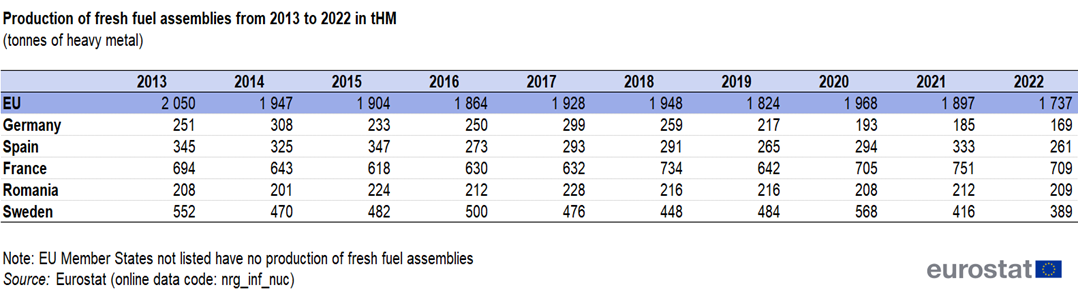
Production of fresh fuel assemblies from 2013 to 2022 in tHM Figure2.png
(
file
)
47 KB
1
16:46, 19 December 2023
Production of fresh fuel assemblies from 2013 to 2022 in tHM (tonnes of heavy metal) v1.png
(
file
)
117 KB
1
16:45, 19 December 2023
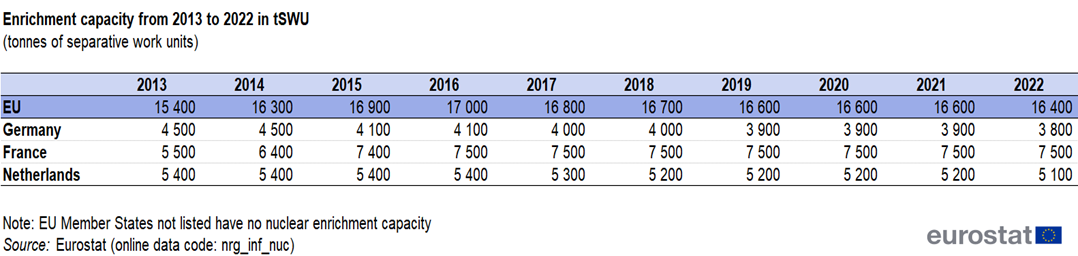
Enrichment capacity from 2013 to 2022 in tSWU (tonnes of separative work units) v1.png
(
file
)
111 KB
1
16:42, 19 December 2023
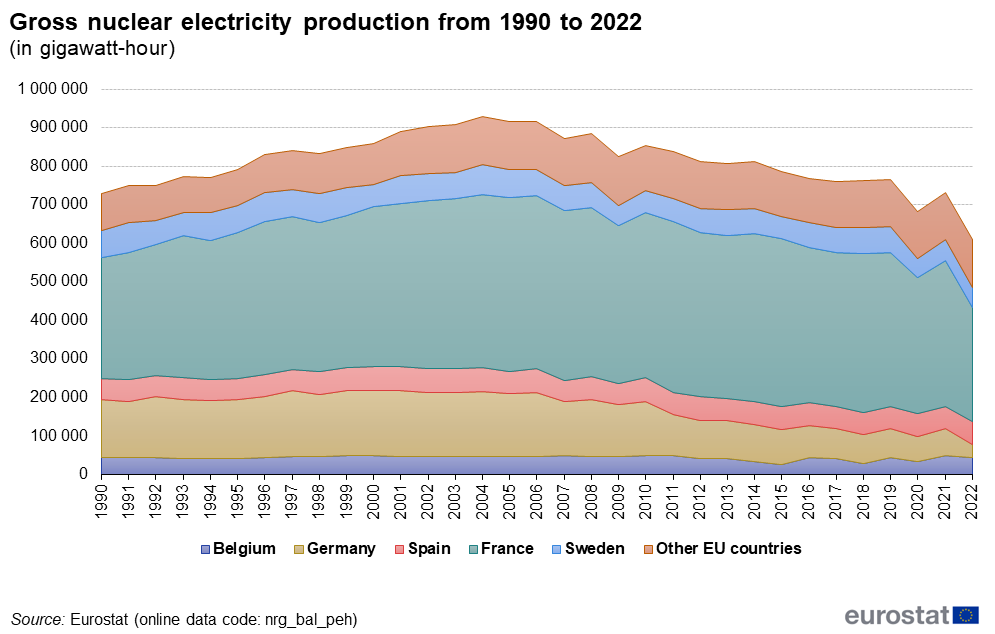
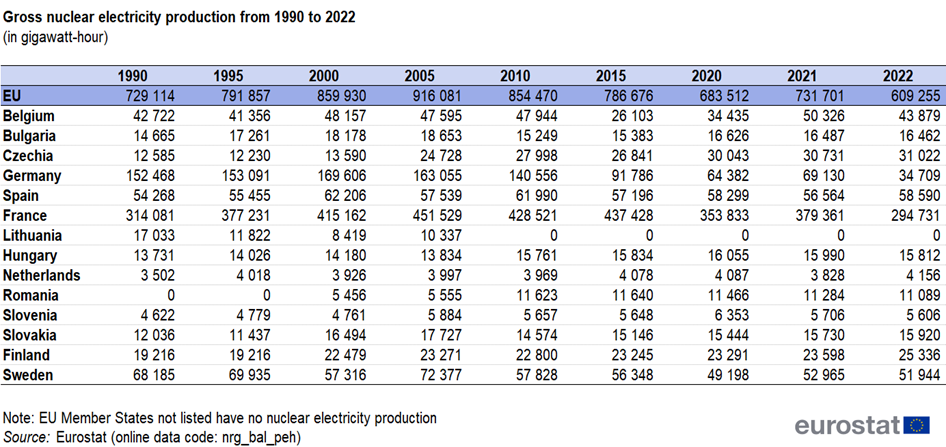
Gross nuclear electricity production from 1990 to 2022 (in gigawatt-hour) Figure1.png
(
file
)
48 KB
1
16:40, 19 December 2023
Gross nuclear electricity production from 1990 to 2022 (in gigawatt-hour) v1.png
(
file
)
226 KB
1
16:39, 19 December 2023
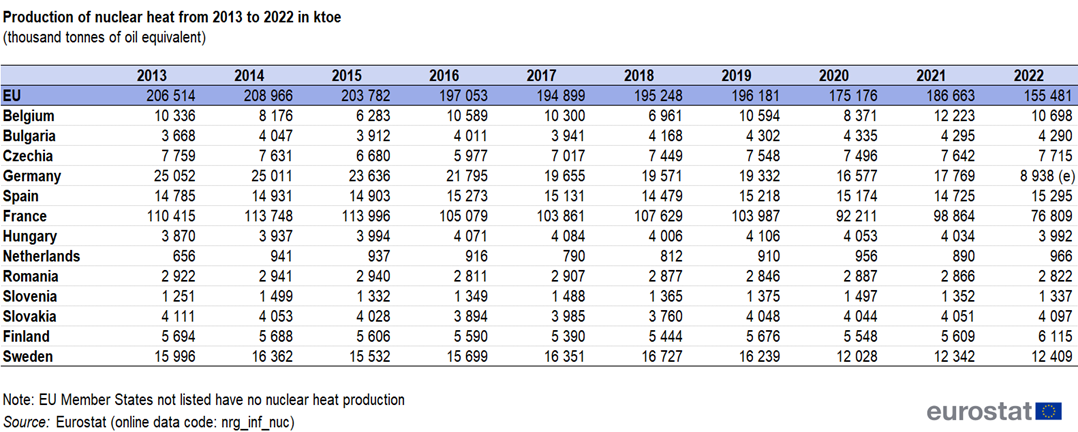
Production of nuclear heat from 2013 to 2022 in ktoe (thousand tonnes of oil equivalent) v1.png
(
file
)
223 KB
1
11:29, 18 December 2023
EU Uranium supply sources in %, 2022.png
(
file
)
42 KB
1
11:26, 18 December 2023
Production of Uranium and Plutonium in reprocessing plants from 2013 to 2022 in tHM (tonnes of heavy metal).png
(
file
)
149 KB
1
11:24, 18 December 2023
Production of MOX fuel assemblies from 2013 to 2022 in tHM (tonnes of heavy metal).png
(
file
)
141 KB
1
First page
Previous page
Next page
Last page
Special page
ISSN 2443-8219


_in_the_EU2023.png)


_v4.png)
_v4.png)
_v3.png)
_v3.png)
_v3.png)
_v3.png)
_v3.png)
_v3.png)
.png)
.png)
.png)
_v2.png)
_v2.png)
.png)
.png)
.png)


_Figure1.png)
_v1.png)
_v1.png)

_v1.png)
_v1.png)
_v1.png)
_v1.png)
.png)
.png)