Tutorials
Log in
Statistics Explained
menu
search
search
Navigation
Main page
Statistical themes
Glossary
Categories
Statistics 4 beginners
Tutorials
Help
Eurostat home
Education corner
Online publications
Regional yearbook
Sustainable development
Full list
Tools
User contributions
Logs
View user groups
Special pages
search
Navigation
Main page
Statistical themes
Glossary
Categories
Statistics 4 beginners
Tutorials
Help
Eurostat home
Education corner
Online publications
Regional yearbook
Sustainable development
Full list
Tools
User contributions
Logs
View user groups
Special pages
Navigation
Main page
Statistical themes
Glossary
Categories
Statistics 4 beginners
Tutorials
Help
Eurostat home
Education corner
Online publications
Regional yearbook
Sustainable development
Full list
Tools
User contributions
Logs
View user groups
Special pages
Uploads by F.ST
This special page shows all uploaded files.
File list
Items per page:
20
50
100
250
500
Search for media name:
Username:
Include old versions of files
Go
First page
Previous page
Next page
Last page
Date
Name
Thumbnail
Size
Description
Versions
18:34, 15 December 2015
SIF Crime 2008-2013 - Figures.xlsx
(
file
)
463 KB
3
18:34, 15 December 2015
SIF Crime 2008-2013 - Detailed tables.xlsx
(
file
)
536 KB
3
14:40, 14 December 2015
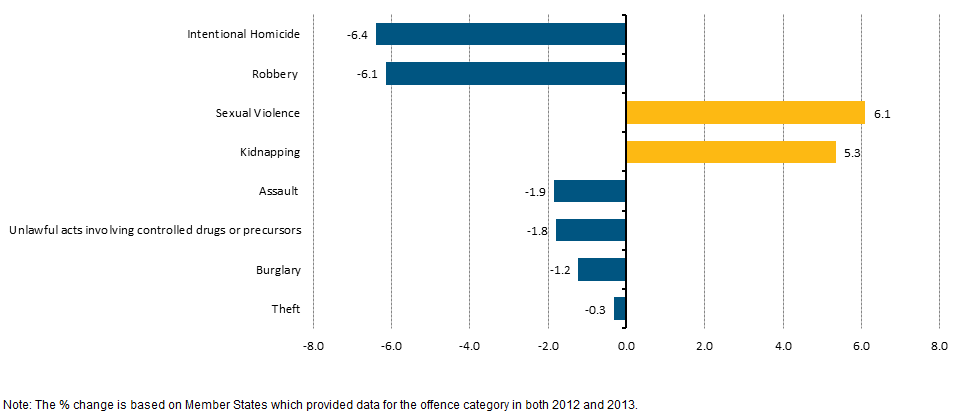
Percentage change 2012-2013 at the EU level, by offence category.PNG
(
file
)
17 KB
3
09:37, 9 December 2015
Female prison personnel in adult prisons 2008–2013.PNG
(
file
)
52 KB
2
09:35, 9 December 2015
Male prison personnel in adult prisons 2008–2013.PNG
(
file
)
53 KB
2
09:32, 9 December 2015
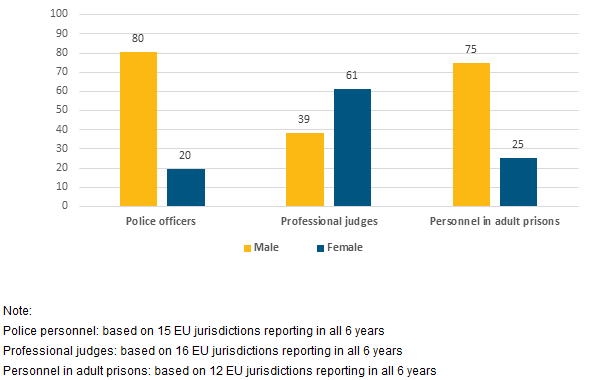
Gender distribution for criminal justice personnel, 2013 (%).PNG
(
file
)
14 KB
3
09:22, 9 December 2015
Prisoners who are foreign citizens in the reporting country 2008–2013.PNG
(
file
)
63 KB
1
09:21, 9 December 2015
Prisoners who are citizens of the reporting country 2008–2013.PNG
(
file
)
65 KB
1
09:21, 9 December 2015
Juvenile prison population 2008–2013.PNG
(
file
)
58 KB
1
09:20, 9 December 2015
Adult female prisoners 2008–2013.PNG
(
file
)
63 KB
1
09:20, 9 December 2015
Adult male prisoners 2008–2013.PNG
(
file
)
66 KB
1
09:19, 9 December 2015
Total prison population 2008–2013.PNG
(
file
)
69 KB
1
09:18, 9 December 2015
Prison personnel in adult prisons 2008–2013.PNG
(
file
)
63 KB
1
09:18, 9 December 2015
Female professional judges 2008–2013.PNG
(
file
)
53 KB
1
09:17, 9 December 2015
Male professional judges 2008–2013.PNG
(
file
)
51 KB
1
18:33, 8 December 2015
Professional judges 2008–2013.PNG
(
file
)
55 KB
1
18:07, 8 December 2015
Female police officers 2008–2013.PNG
(
file
)
57 KB
1
18:06, 8 December 2015
Male police officers, 2008–2013.PNG
(
file
)
58 KB
1
18:06, 8 December 2015
Police officers, 2008–2013.PNG
(
file
)
69 KB
1
18:06, 8 December 2015
Sexual assault offences recorded by the police, 2008–2013.PNG
(
file
)
60 KB
1
18:05, 8 December 2015
Rape offences recorded by the police, 2008–2013.PNG
(
file
)
62 KB
1
18:05, 8 December 2015
Offences of sexual violence recorded by the police, 2008–2013.PNG
(
file
)
60 KB
1
18:04, 8 December 2015
Unlawful acts involving controlled drugs or precursors offences recorded by the police, 2008–2013.PNG
(
file
)
72 KB
1
18:04, 8 December 2015
Burglary offences recorded by the police, 2008–2013.PNG
(
file
)
76 KB
1
17:58, 8 December 2015
Theft offences recorded by the police, 2008–2013.PNG
(
file
)
77 KB
1
17:58, 8 December 2015
Kidnapping offences recorded by the police, 2008–2013.PNG
(
file
)
55 KB
1
17:57, 8 December 2015
Robbery offences recorded by the police, 2008–2013.PNG
(
file
)
69 KB
1
17:56, 8 December 2015
Assault offences recorded by the police, 2008–2013.PNG
(
file
)
63 KB
1
17:56, 8 December 2015
Intentional homicide offences recorded by the police, 2008–2013.PNG
(
file
)
60 KB
1
17:50, 8 December 2015
Gender distribution for adult prisoners, 2013 (%).PNG
(
file
)
17 KB
2
17:50, 8 December 2015
Trends in the prison population (2008=100).PNG
(
file
)
17 KB
2
17:49, 8 December 2015
Trends in criminal justice personnel.PNG
(
file
)
20 KB
2
17:48, 8 December 2015
Gender distribution for offences relating to sexual violence, 2013 (%).PNG
(
file
)
14 KB
2
17:47, 8 December 2015
Trends in sexual violence at the EU level (2008=100).PNG
(
file
)
20 KB
2
17:33, 8 December 2015
Trends in police-recorded offences at the EU level (2008=100).PNG
(
file
)
26 KB
Reverted to version as of 15:16, 8 December 2015
4
17:27, 8 December 2015
Trends in police-recorded offences at the EU level (2008=100) .PNG
(
file
)
26 KB
1
16:11, 9 February 2015
Distribution of people with tertiary education (ISCED 5-6) aged 25-34 by ISCO by sex, 2013.PNG
(
file
)
39 KB
1
16:11, 9 February 2015
Distribution of people with tertiary education (ISCED 5-6) aged 25-34 by ISCO, 2013.PNG
(
file
)
26 KB
1
15:57, 9 February 2015
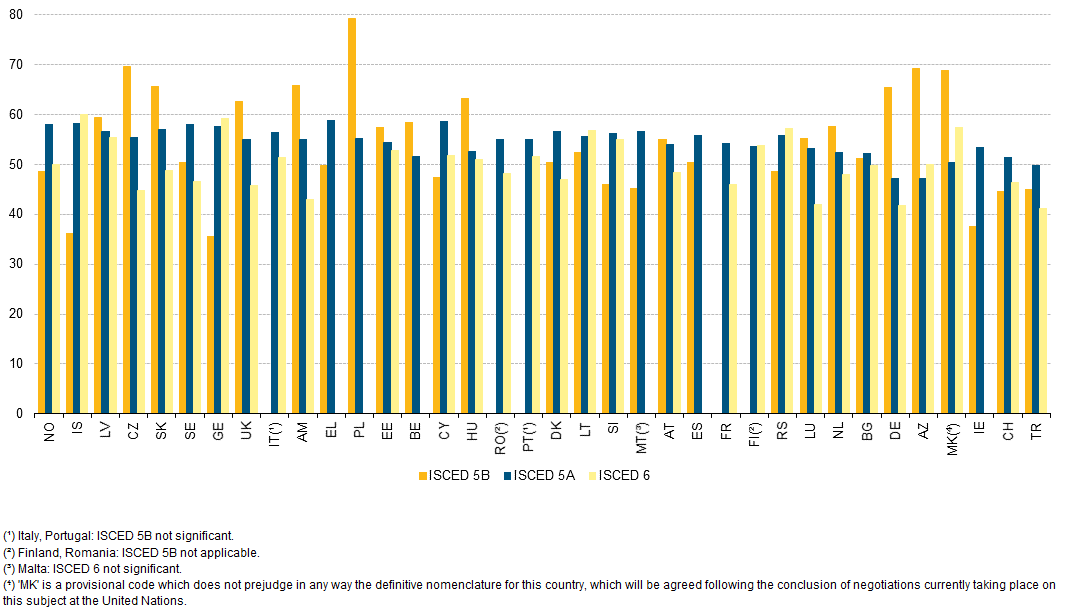
Completion rates in tertiary type A programmes (%), 2011.PNG
(
file
)
24 KB
1
15:57, 9 February 2015
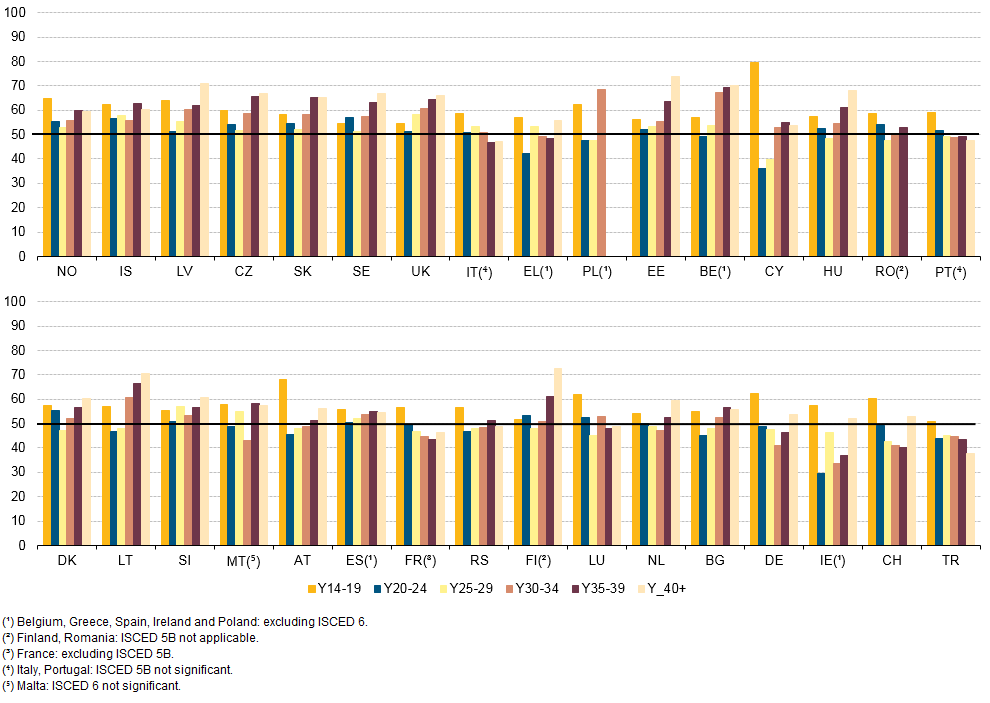
Percentage of persons with tertiary education by age group 2013.PNG
(
file
)
68 KB
1
15:52, 9 February 2015
Attainment by educational background, 2011.PNG
(
file
)
17 KB
1
15:42, 9 February 2015
Median percentage of women in enrolled students by field of education and level of Bologna structure-(BA and MA), 2011 12.PNG
(
file
)
23 KB
1
15:42, 9 February 2015
Median and percentile of percentage women in new entrants in tertiary education by field of education-EHEA, 2011 12.PNG
(
file
)
44 KB
1
15:31, 9 February 2015
Median percentage of women in enrolled students by field of education and level of Bologna structure (BA and MA), 2011 12.PNG
(
file
)
23 KB
2
15:30, 9 February 2015
Median and percentile of percentage women in new entrants in tertiary education by field of education, EHEA, 2011 12..PNG
(
file
)
44 KB
1
15:28, 9 February 2015
Percentage of women in new entrants by age group..PNG
(
file
)
81 KB
1
15:27, 9 February 2015
Women in new entrants in tertiary education by level of education, 2011 12..PNG
(
file
)
37 KB
1
15:22, 9 February 2015
Median and percentile of percentage women in new entrants in tertiary education by field of education, EHEA, 2011 12.PNG
(
file
)
81 KB
1
15:22, 9 February 2015
Percentage of women in new entrants by age group.PNG
(
file
)
81 KB
1
15:21, 9 February 2015
Women in new entrants in tertiary education by level of education, 2011 12.PNG
(
file
)
37 KB
1
First page
Previous page
Next page
Last page
Special page
ISSN 2443-8219


.PNG)


.PNG)
.PNG)

.PNG)
.PNG)
.PNG)
_.PNG)
_aged_25-34_by_ISCO_by_sex,_2013.PNG)
_aged_25-34_by_ISCO,_2013.PNG)
,_2011.PNG)


,_2011_12.PNG)

,_2011_12.PNG)


