Tutorials
Log in
Statistics Explained
menu
search
search
Navigation
Main page
Statistical themes
Glossary
Categories
Statistics 4 beginners
Tutorials
Help
Eurostat home
Education corner
Online publications
Regional yearbook
Sustainable development
Full list
Tools
User contributions
Logs
View user groups
Special pages
search
Navigation
Main page
Statistical themes
Glossary
Categories
Statistics 4 beginners
Tutorials
Help
Eurostat home
Education corner
Online publications
Regional yearbook
Sustainable development
Full list
Tools
User contributions
Logs
View user groups
Special pages
Navigation
Main page
Statistical themes
Glossary
Categories
Statistics 4 beginners
Tutorials
Help
Eurostat home
Education corner
Online publications
Regional yearbook
Sustainable development
Full list
Tools
User contributions
Logs
View user groups
Special pages
Uploads by Czechbe
This special page shows all uploaded files.
File list
Items per page:
20
50
100
250
500
Search for media name:
Username:
Include old versions of files
Go
First page
Previous page
Next page
Last page
Date
Name
Thumbnail
Size
Description
Versions
16:42, 11 April 2023
Wages and labour costs April 2023 update.xlsx
(
file
)
101 KB
2
16:31, 11 April 2023
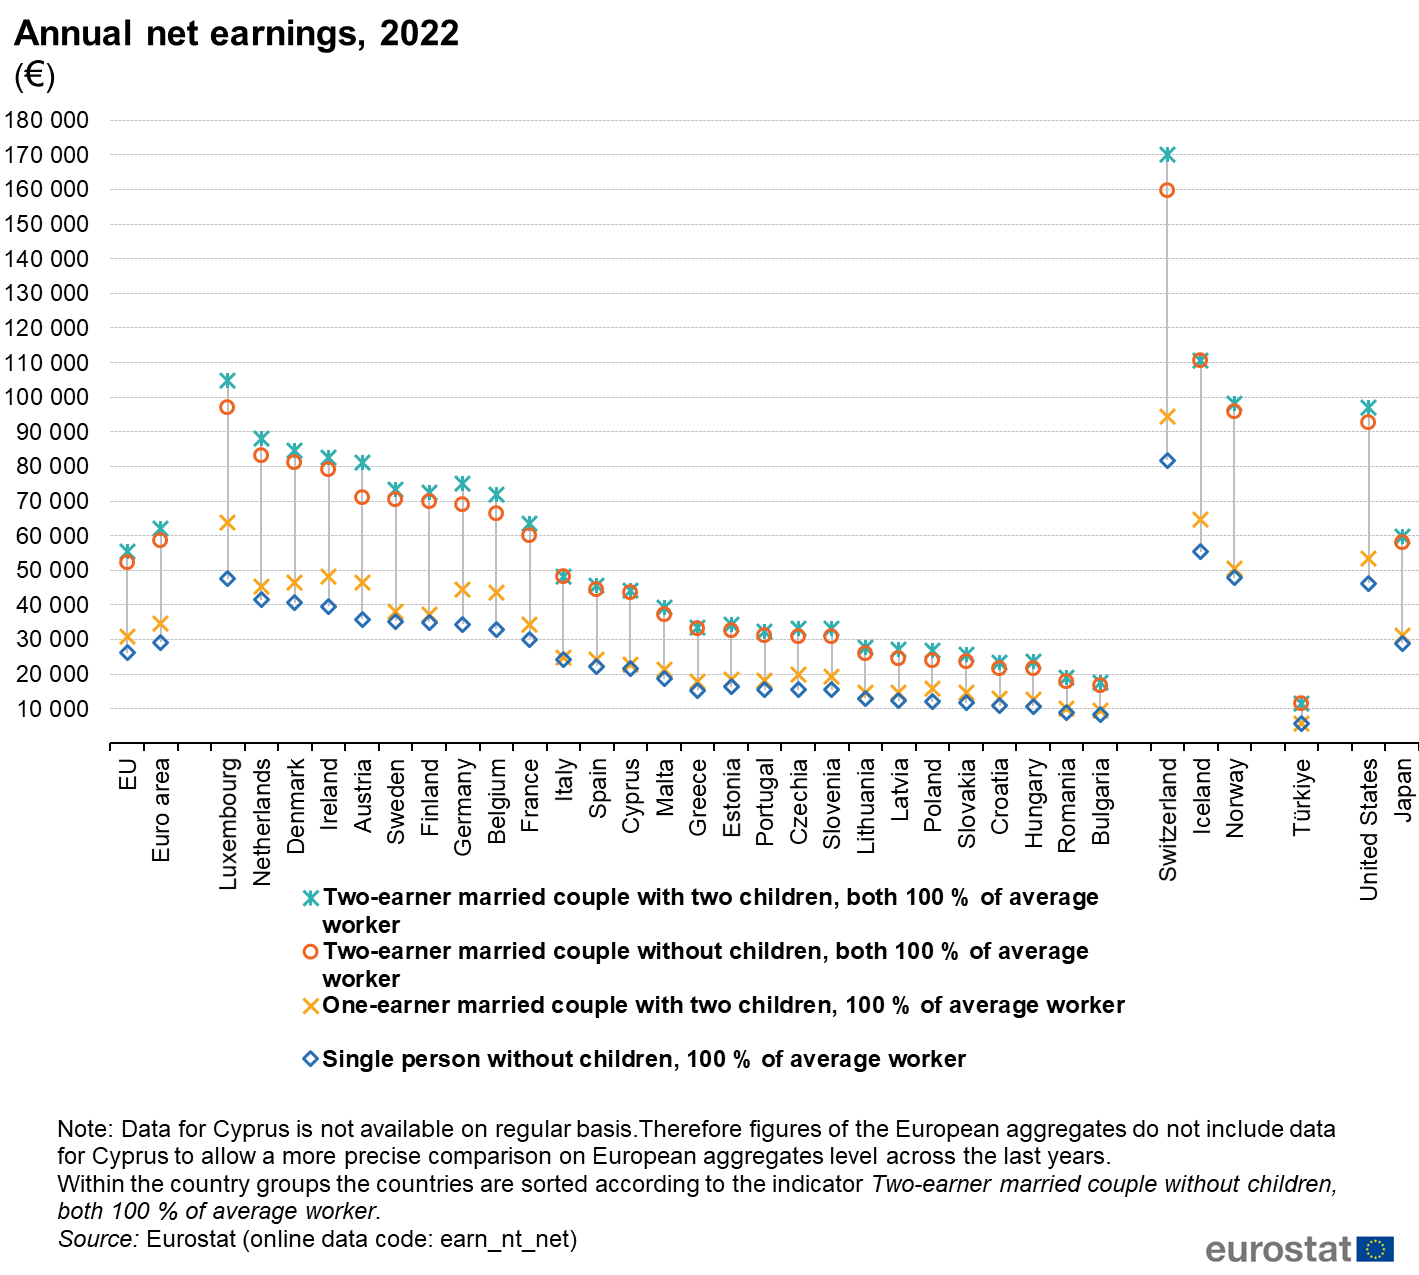
Annual net earnings, 2022 (€).png
(
file
)
179 KB
2
12:52, 7 April 2023
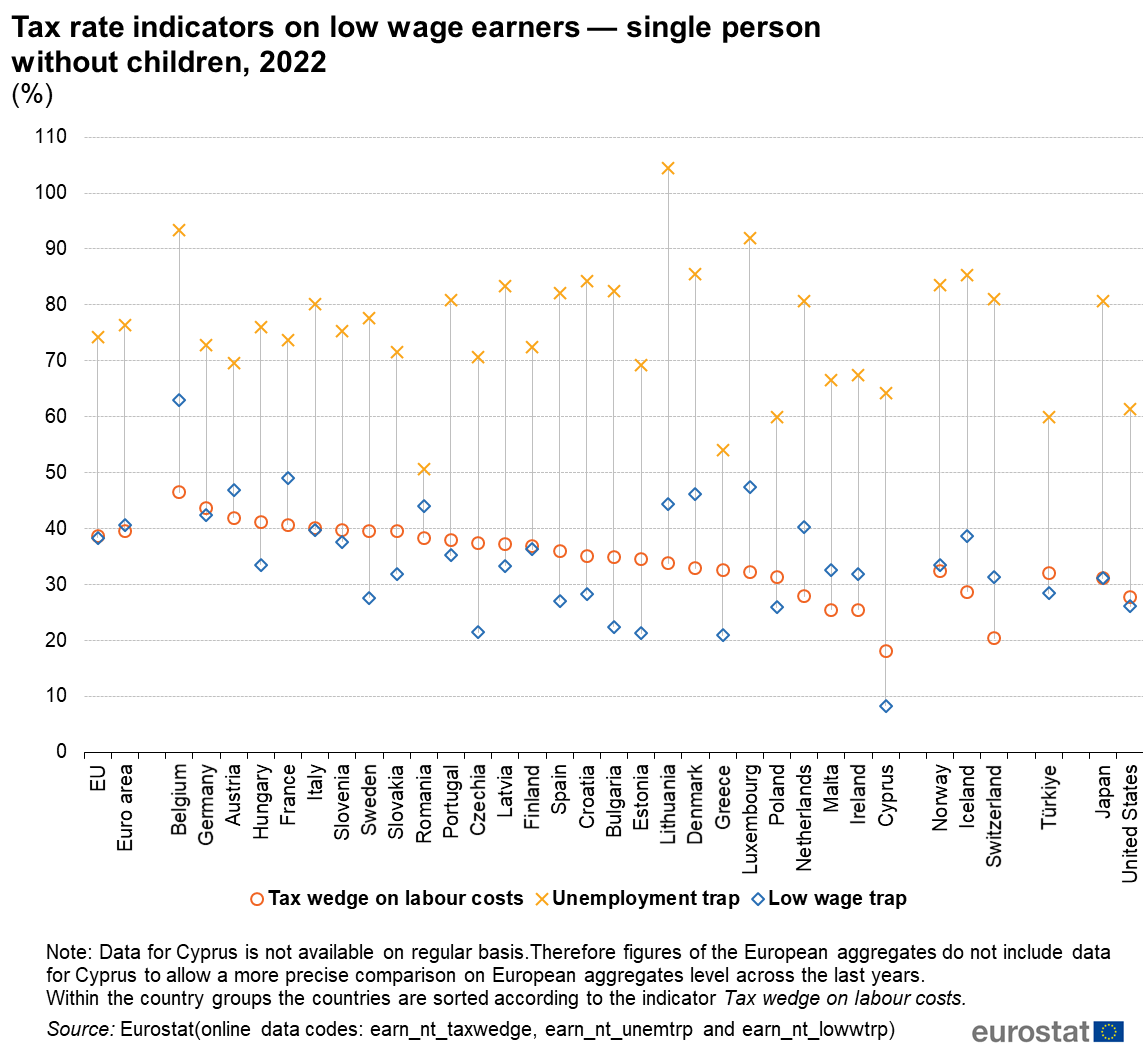
Tax rate indicators on low wage earners, 2022 (%).png
(
file
)
130 KB
1
14:09, 23 March 2022
Tax rate indicators on low wage earners, 2021 (%).png
(
file
)
129 KB
1
14:03, 23 March 2022
Annual net earnings, 2021 (EUR).png
(
file
)
144 KB
1
20:32, 8 March 2021
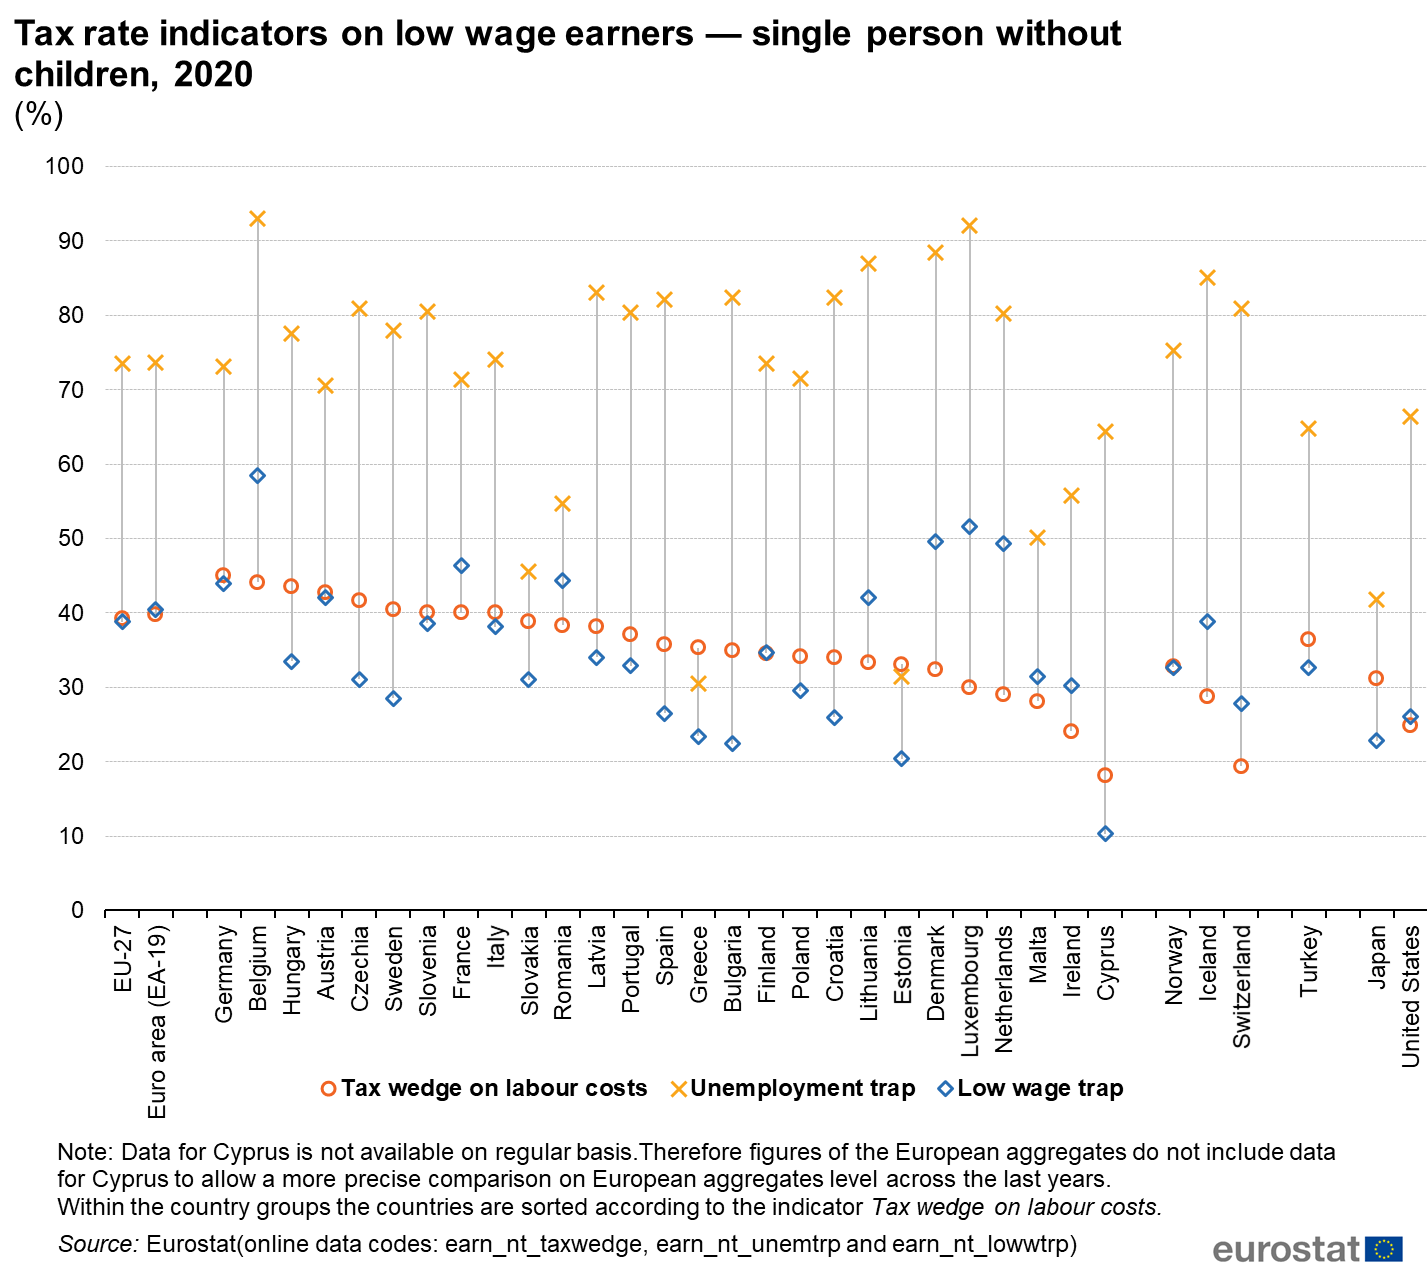
Tax rate indicators on low wage earners, 2020 (%).png (%).png
(
file
)
167 KB
1
16:42, 16 December 2020
Wages and labour costs December-2020 update2.xlsx
(
file
)
100 KB
1
16:40, 16 December 2020
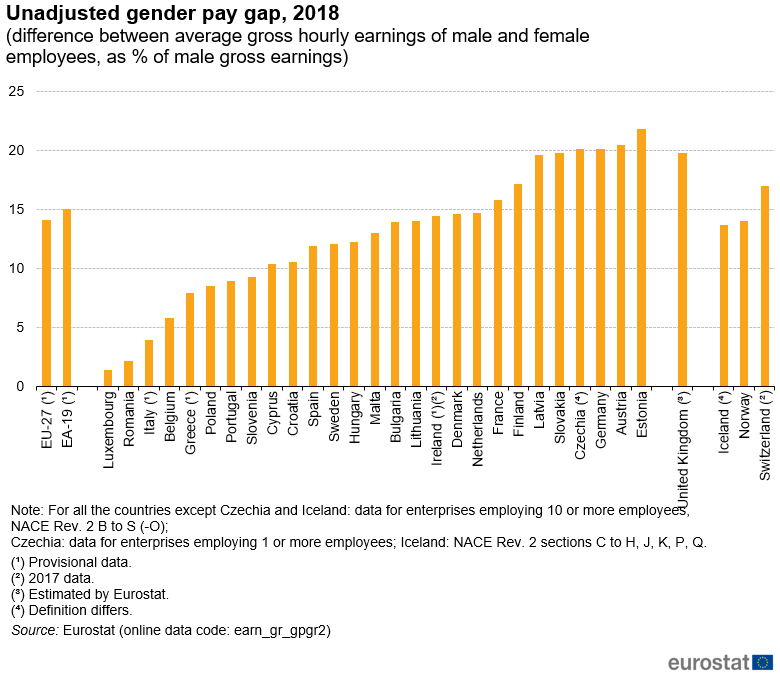
Unadjusted gender pay gap, 2018 (difference between average gross hourly earnings of male and female employees, as % of male gross earnings).png
(
file
)
60 KB
4
16:27, 16 December 2020
Wages and labour costs December-2020 update1.xlsx
(
file
)
100 KB
1
08:04, 18 August 2020
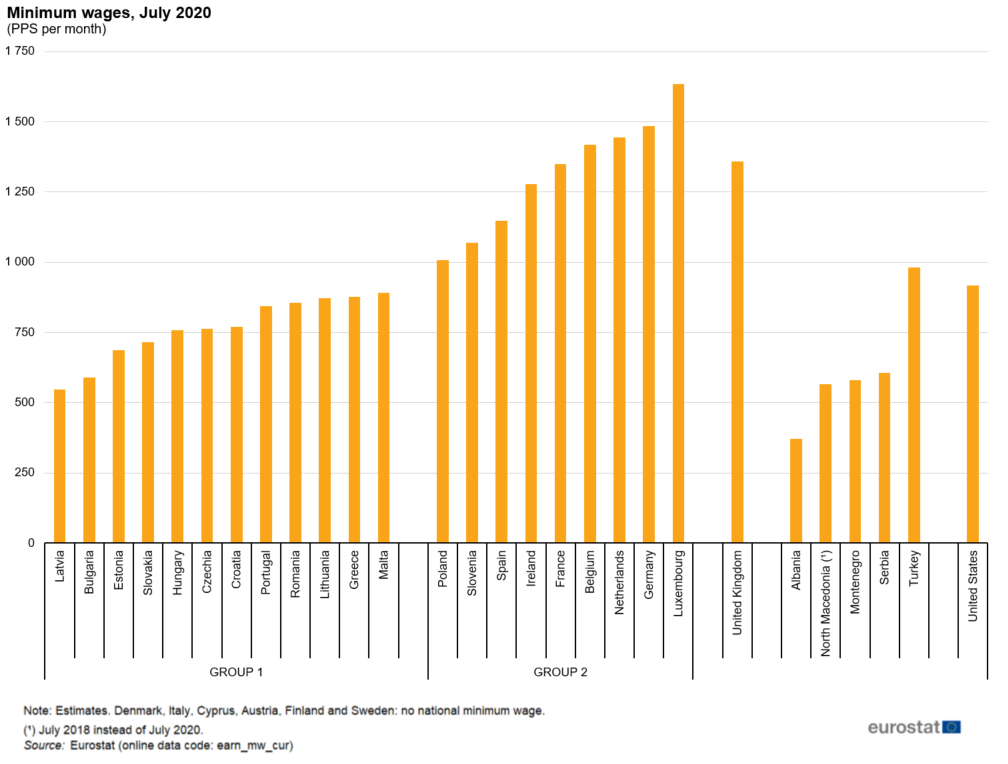
Minimum wages, July 2020 (PPS per month).png
(
file
)
95 KB
3
13:57, 17 August 2020
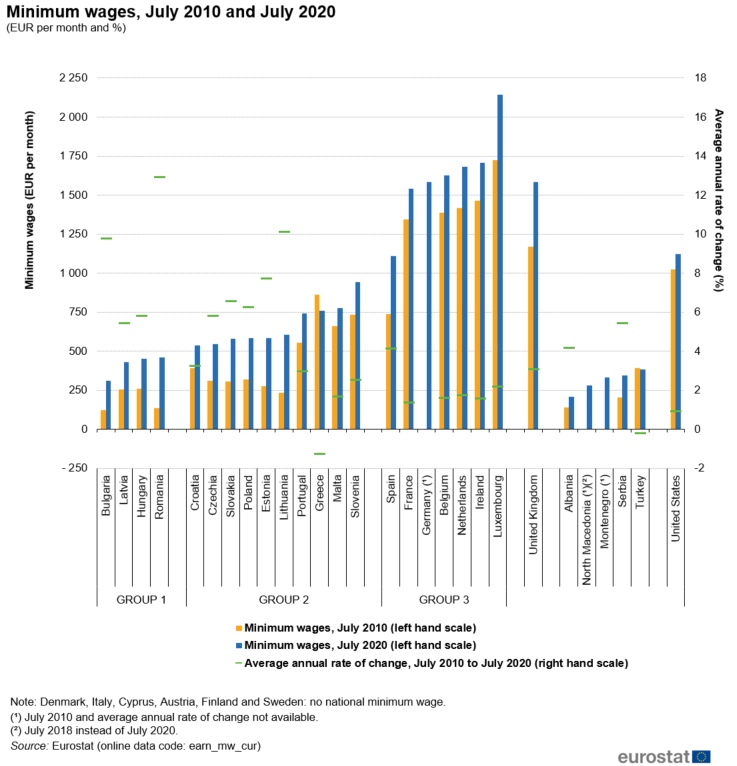
Minimum wages, July 2010 and July 2020 (EUR per month and %).png
(
file
)
96 KB
4
13:49, 17 August 2020
Minimum wage statistics 17.08.2020.xlsx
(
file
)
79 KB
1
11:10, 17 August 2020
Minimum wage statistics 13.08.2020.xlsx
(
file
)
55 KB
1
11:50, 28 April 2020
Wages and labour costs April-2020 update (3).xlsx
(
file
)
101 KB
1
09:51, 13 December 2019
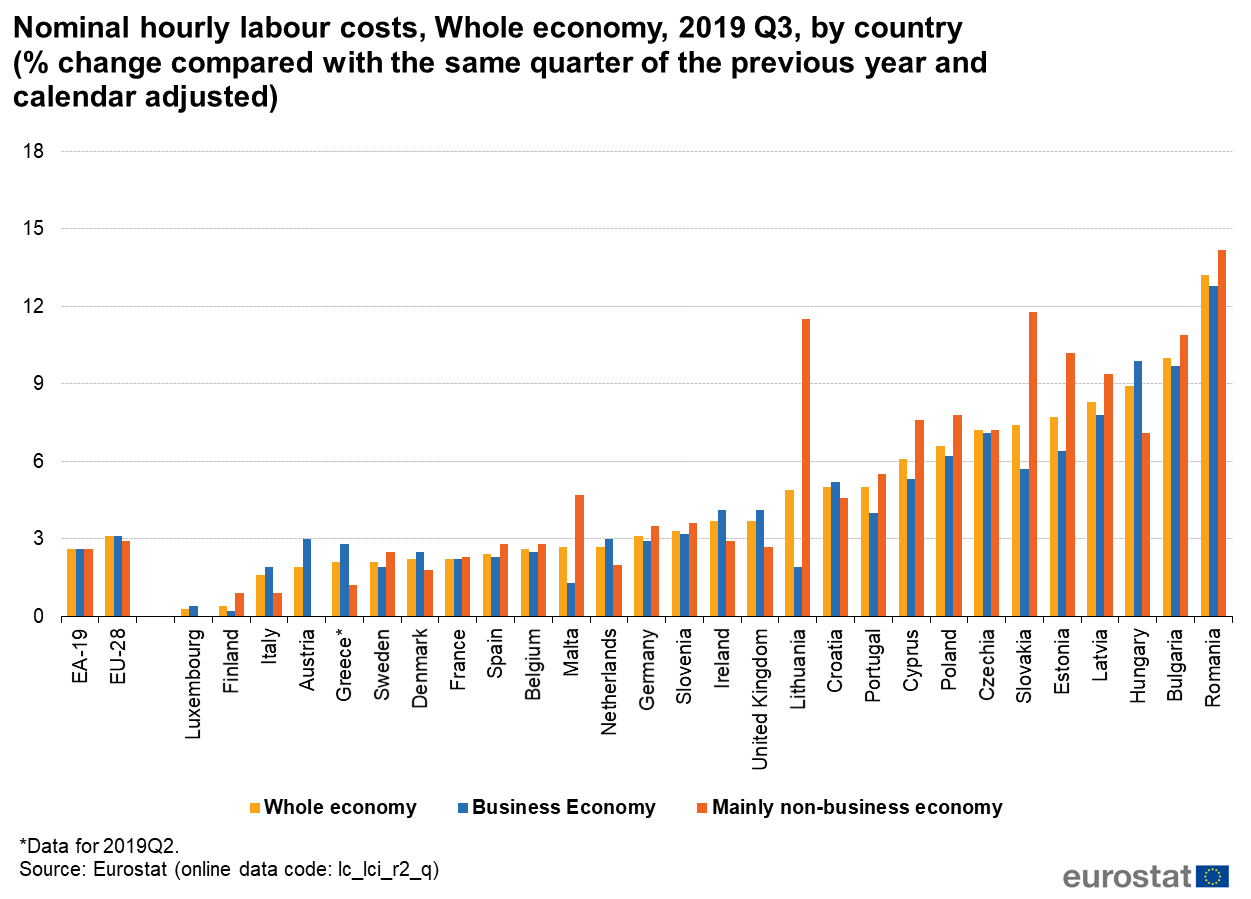
Nominal hourly labour costs, Whole economy, 2019 Q3, by country ( % change compared with the same quarter of the previous year and calendar adjusted).png
(
file
)
111 KB
1
19:05, 12 December 2019
Nominal hourly labour costs, Whole economy, 2019 Q3, by country (% change compared with the same quarter of the previous year and calendar adjusted).png
(
file
)
109 KB
1
19:02, 12 December 2019
Total nominal hourly labour costs, Whole economy, 2019 Q3 (change compared to same quarter of previous year, calendar adjusted).png
(
file
)
85 KB
1
18:57, 12 December 2019
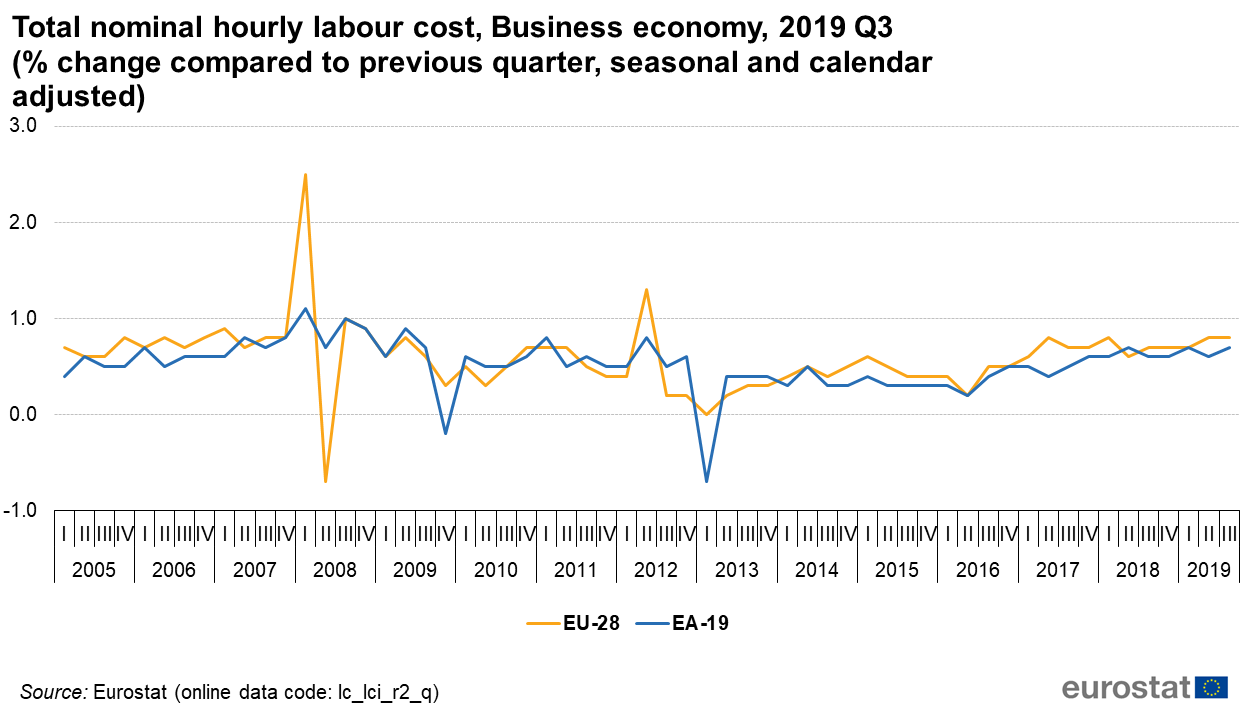
Total nominal hourly labour cost, Business economy, 2019 Q3 (% change compared to previous quarter, seasonal and calendar adjusted).png
(
file
)
72 KB
1
09:49, 28 June 2019
Wages and labour costs June-2019.xlsx
(
file
)
84 KB
1
12:58, 28 September 2012
Figure 4 Minimum wage as of 1 July 2012.png
(
file
)
7 KB
1
12:40, 18 September 2012
Stat explained 2012q2.xls
(
file
)
92 KB
1
12:38, 18 September 2012
JVR by country 2012Q2 chart.PNG
(
file
)
11 KB
1
12:37, 18 September 2012
JVR EUEAagg 2012Q2 chart.PNG
(
file
)
13 KB
1
12:25, 18 September 2012
JVR by country 2012Q2 table.png
(
file
)
38 KB
1
12:25, 18 September 2012
JVR by country 2012Q2 chart.png
(
file
)
11 KB
1
12:24, 18 September 2012
JVR EUEAagg 2012Q2 chart.png
(
file
)
13 KB
2
11:35, 2 August 2012
MW map EUR July 2012.png
(
file
)
59 KB
1
09:30, 2 August 2012
MW as % of mean July 2012.png
(
file
)
8 KB
1
09:30, 2 August 2012
MW PPS July 2012.png
(
file
)
13 KB
1
09:29, 2 August 2012
MW EUR July 2012.png
(
file
)
13 KB
1
14:27, 19 June 2012
JVR EUEAagg 2012Q1 chart.PNG
(
file
)
13 KB
1
14:25, 19 June 2012
JVR by country 2012Q1 chart.PNG
(
file
)
11 KB
1
14:23, 19 June 2012
Stat explained 2012q1.xls
(
file
)
86 KB
1
14:22, 19 June 2012
JVR by country 2012Q1 table.png
(
file
)
37 KB
1
14:21, 19 June 2012
JVR EUEAagg 2012Q1 chart.png
(
file
)
13 KB
2
17:57, 19 March 2012
Stat explained 2011q4.xls
(
file
)
67 KB
1
17:53, 19 March 2012
JVR by country 2011Q4 chart.PNG
(
file
)
6 KB
1
17:52, 19 March 2012
JVR EUEAagg 2011Q4 chart.PNG
(
file
)
10 KB
1
17:07, 19 March 2012
JVR by country 2011Q4 table.png
(
file
)
16 KB
1
17:06, 19 March 2012
JVR by country 2011Q4 chart.png
(
file
)
6 KB
1
17:06, 19 March 2012
JVR EUEAagg 2011Q4 chart.png
(
file
)
10 KB
1
10:07, 15 February 2012
MW map EUR Feb 2012.png
(
file
)
317 KB
1
09:47, 15 February 2012
MW map EUR Jan 2012.png
(
file
)
317 KB
2
13:18, 10 February 2012
MW as % of mean Jan 2012.png
(
file
)
7 KB
1
13:18, 10 February 2012
MW PPS Jan 2012.png
(
file
)
12 KB
1
13:17, 10 February 2012
MW EUR Jan 2012.png
(
file
)
11 KB
1
13:31, 19 December 2011
Stat explained 2011q3.xls
(
file
)
62 KB
1
13:26, 19 December 2011
JVR by country 2011Q3 chart.PNG
(
file
)
7 KB
1
13:25, 19 December 2011
JVR EUEAagg 2011Q3 chart.PNG
(
file
)
10 KB
1
13:23, 19 December 2011
JVR by country 2011Q3 table.png
(
file
)
16 KB
1
First page
Previous page
Next page
Last page
Special page
ISSN 2443-8219
.png)
.png)
.png)
.png)
.png_(%25).png)
.png)
.png)
.png)
.png)
.png)
.png)
.png)


