Tutorials
Log in
Statistics Explained
menu
search
search
Navigation
Main page
Statistical themes
Glossary
Categories
Statistics 4 beginners
Tutorials
Help
Eurostat home
Education corner
Online publications
Regional yearbook
Sustainable development
Full list
Tools
User contributions
Logs
View user groups
Special pages
search
Navigation
Main page
Statistical themes
Glossary
Categories
Statistics 4 beginners
Tutorials
Help
Eurostat home
Education corner
Online publications
Regional yearbook
Sustainable development
Full list
Tools
User contributions
Logs
View user groups
Special pages
Navigation
Main page
Statistical themes
Glossary
Categories
Statistics 4 beginners
Tutorials
Help
Eurostat home
Education corner
Online publications
Regional yearbook
Sustainable development
Full list
Tools
User contributions
Logs
View user groups
Special pages
Uploads by Courtth
This special page shows all uploaded files.
File list
Items per page:
20
50
100
250
500
Search for media name:
Username:
Include old versions of files
Go
Date
Name
Thumbnail
Size
Description
Versions
10:43, 31 August 2012
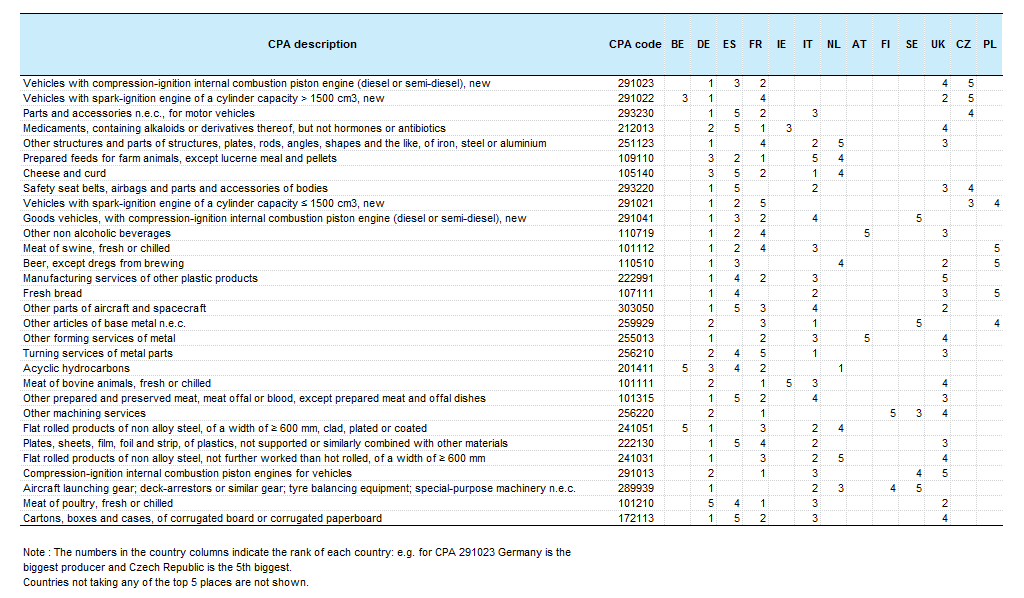
PRODCOM Top 5 producing countries of each of the top 30 products at CPA level by value of sold production, EU 27, 2011.png
(
file
)
39 KB
3
09:30, 31 August 2012
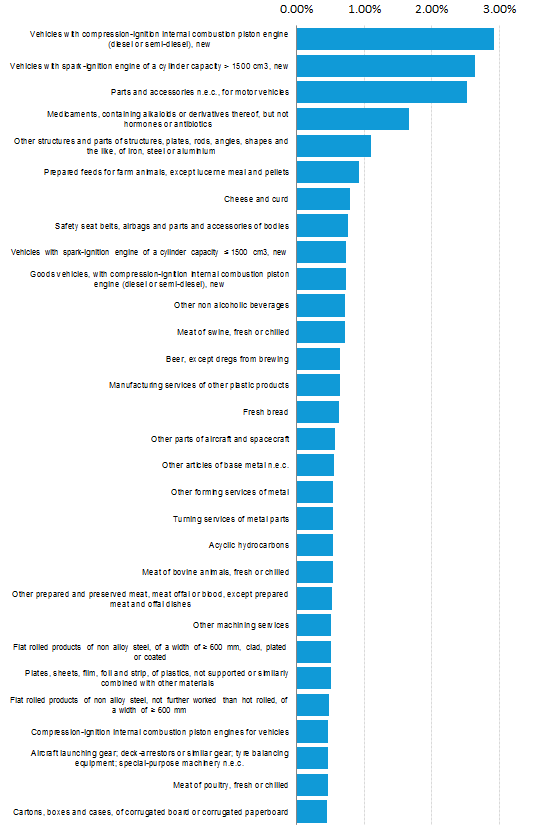
PRODCOM Top 30 Products at CPA level by value of sold production, EU27, 2011.png
(
file
)
38 KB
4
08:57, 31 August 2012
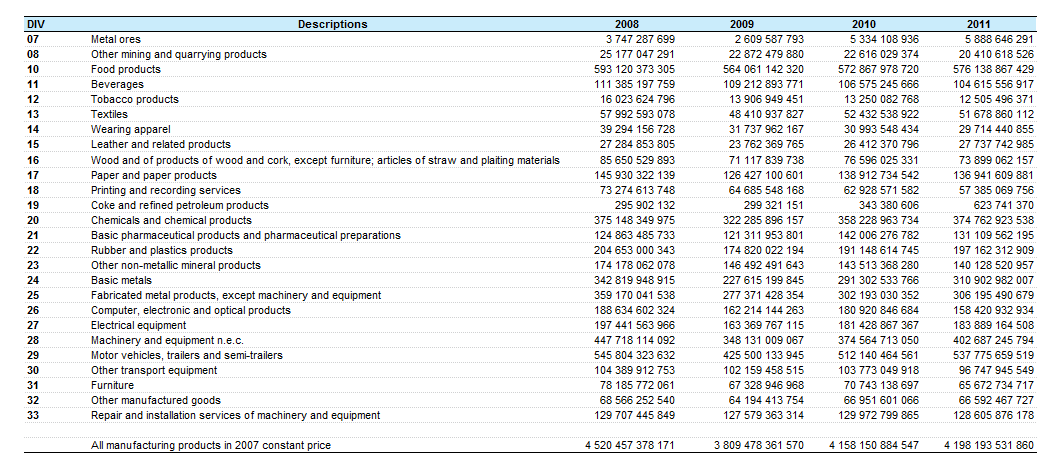
PRODCOM Evolution of Sold Production constant prices by Nace Division, EU27, 2011.png
(
file
)
38 KB
3
08:55, 31 August 2012
PRODCOM StatisticExplained 2011 TableToPulish CPA.xls
(
file
)
152 KB
2
11:43, 22 August 2012
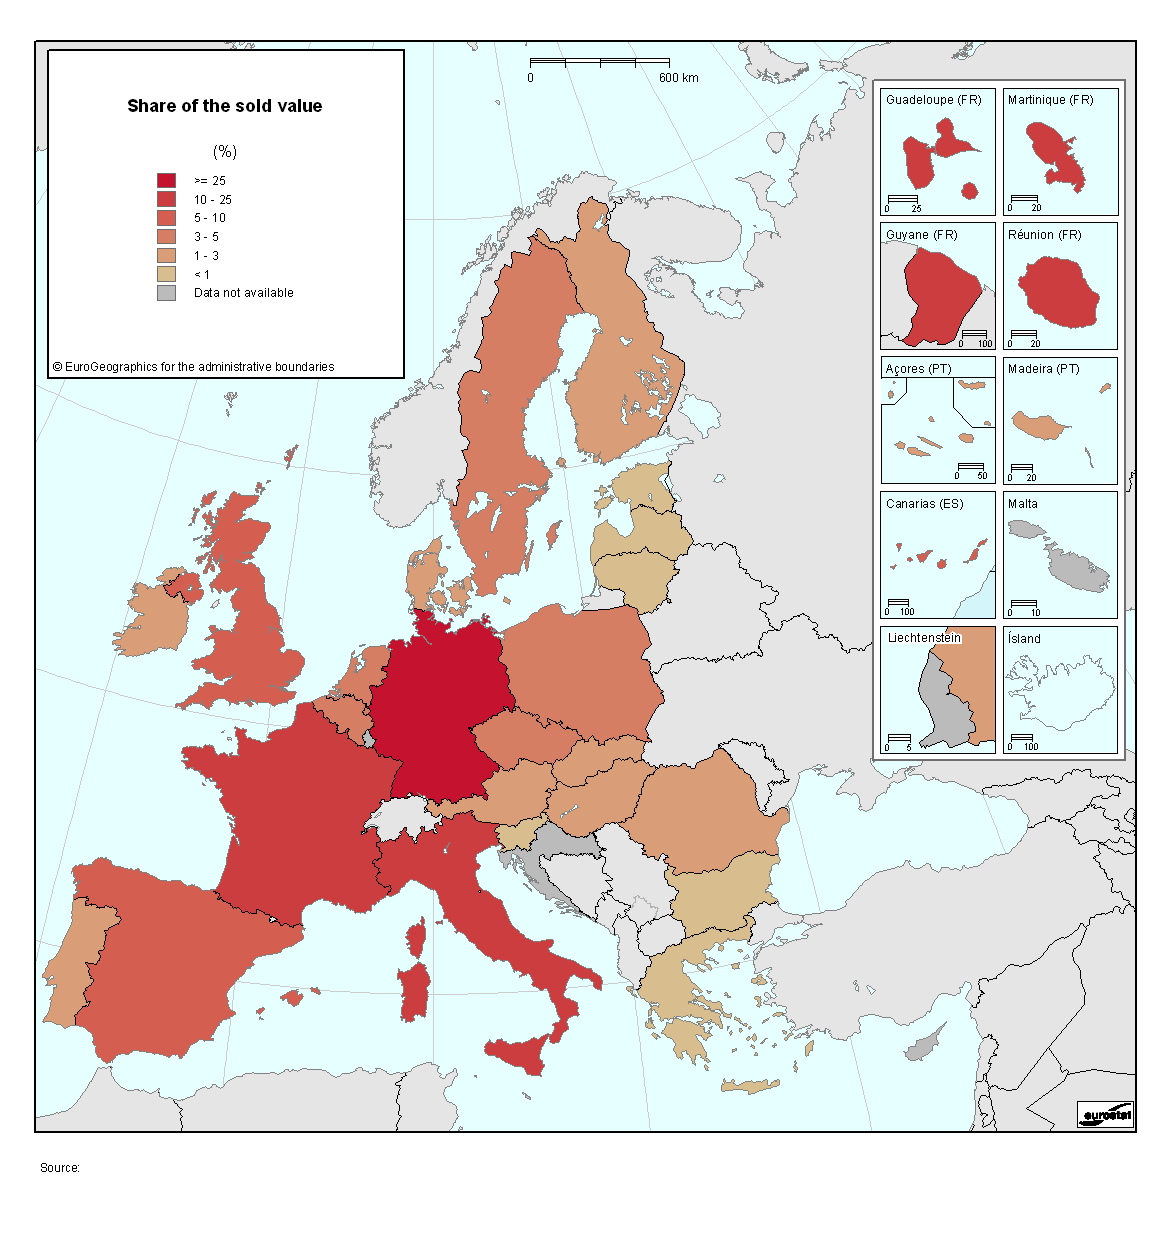
Production, share of sold production value, EU-27, 2011.png
(
file
)
51 KB
2
11:36, 22 August 2012
PRODCOM Share of EU-27 total of top-30 products at CPA level by value of sold production, 2011.PNG
(
file
)
25 KB
2
11:26, 22 August 2012
PRODCOM Evolution of Sold Production constant prices, EU27, 2011 v1.png
(
file
)
6 KB
1
11:25, 22 August 2012
PRODCOM Evolution of Sold Production constant prices, EU27, 2011.png
(
file
)
6 KB
2
16:35, 21 August 2012
PRODCOM StatisticExplained 2011 TableToPulish CPA v0.xls
(
file
)
134 KB
1
18:07, 7 September 2011
PRODCOM Evolution of Sold Production constant prices, EU27, 2010.png
(
file
)
5 KB
1
18:06, 7 September 2011
PRODCOM Evolution of Sold Production constant price, EU27, 2010.png
(
file
)
5 KB
2
17:57, 7 September 2011
PRODCOM StatisticExplained 2010 TableToPulish CPA v2.xls
(
file
)
101 KB
2
10:20, 2 September 2011
PRODCOM Volume Example, EU27, 2010.png
(
file
)
12 KB
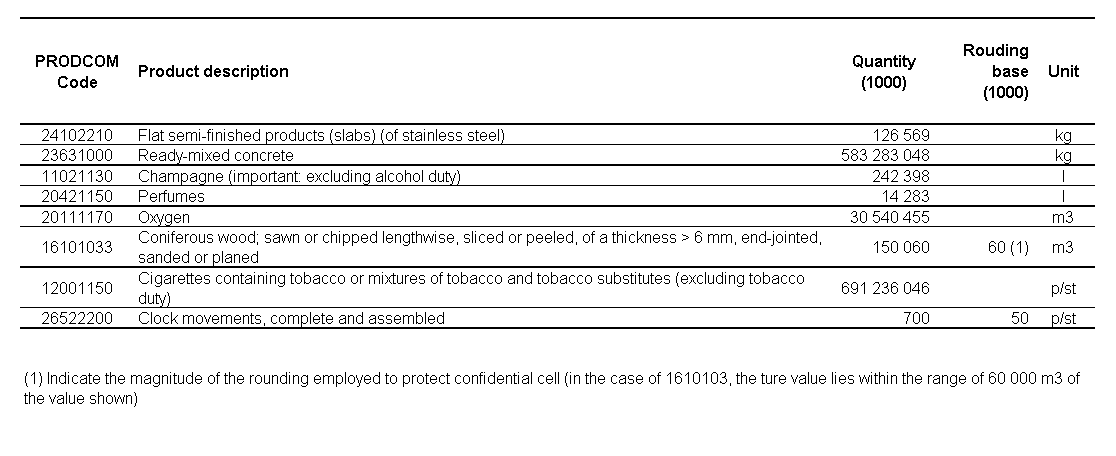
Example of volume with different units in PRODCOM survey 2010
1
09:50, 2 September 2011
PRODCOM High-value product, EU27, 2010.png
(
file
)
13 KB
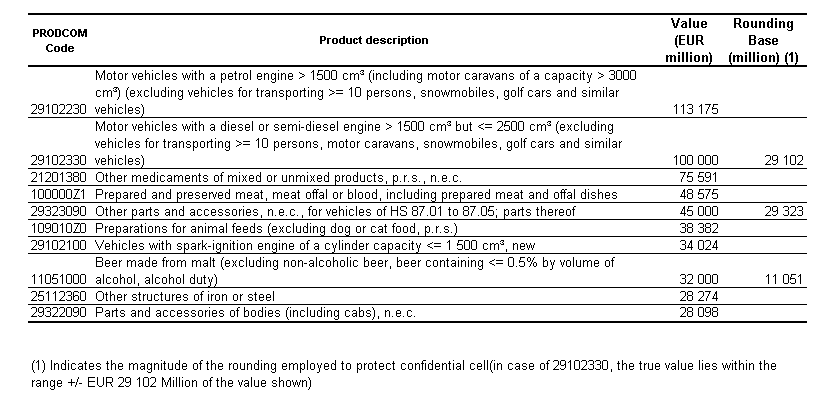
Top 10 product by value of sold production in PRODCOM 2010 survey.
1
16:48, 29 August 2011
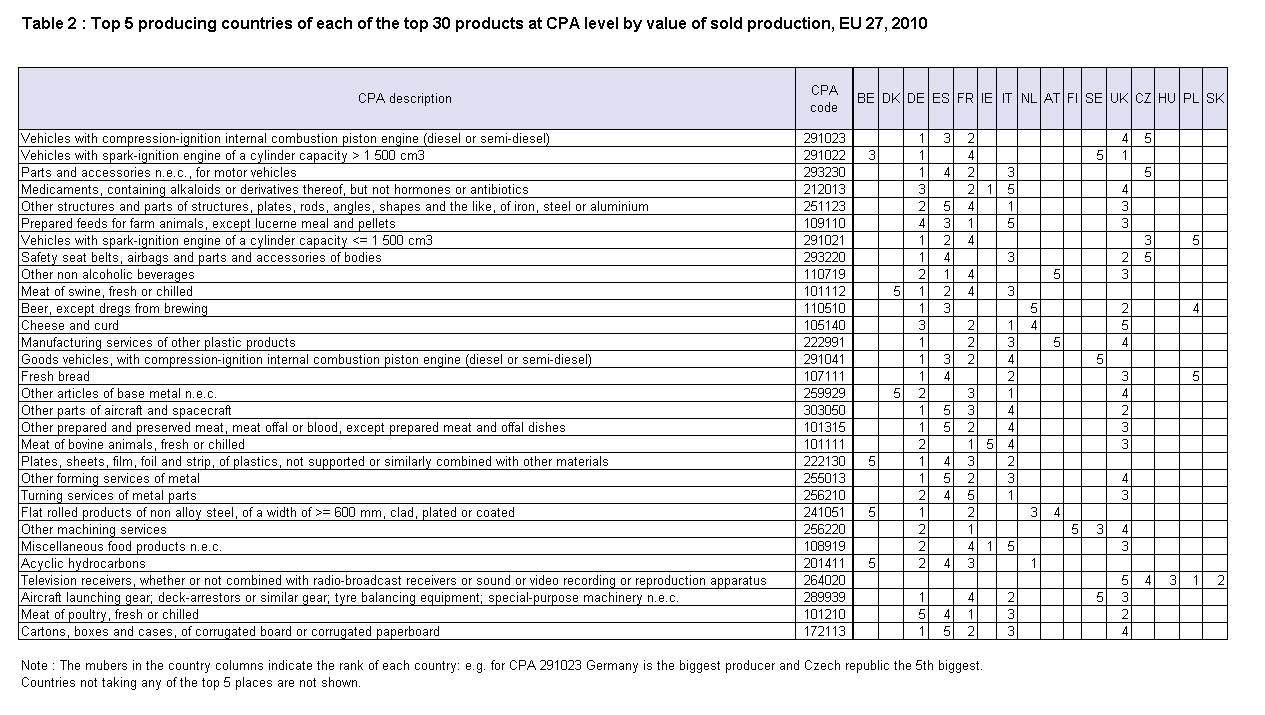
Top 5 producing countries of each of the top 30 products at CPA level by value of sold production, EU 27, 2010.png
(
file
)
31 KB
Top 5 producing countries of each of the top 30 products at CPA level by value of sold production, EU 27, 2010
1
16:38, 29 August 2011
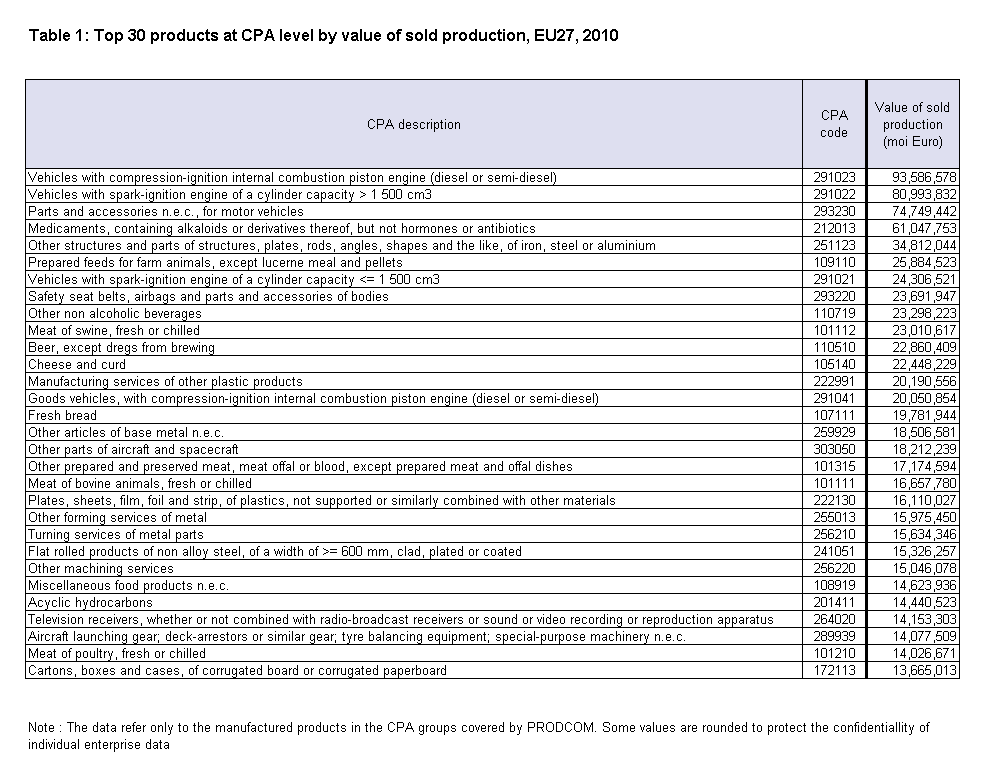
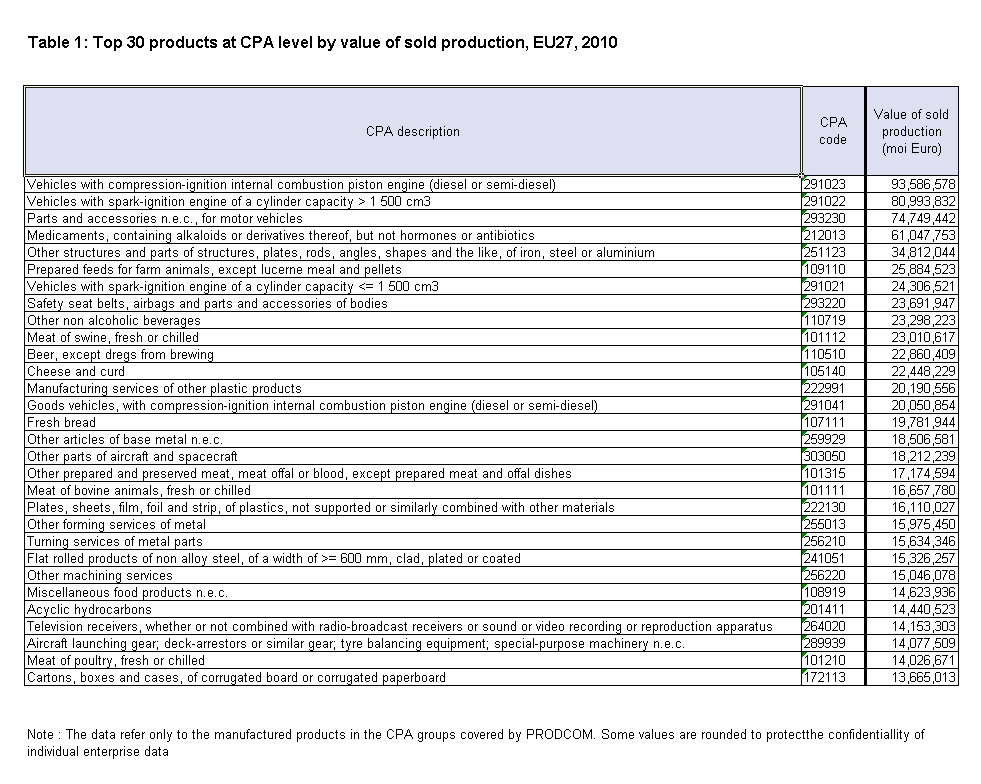
Top 30 Products at CPA level by value of sold production, EU27, 2010.png
(
file
)
27 KB
1
15:21, 29 August 2011
Top 30 Products at CPA level by value of sold production, EU27, 2010.jpg
(
file
)
224 KB
1
16:43, 16 August 2011
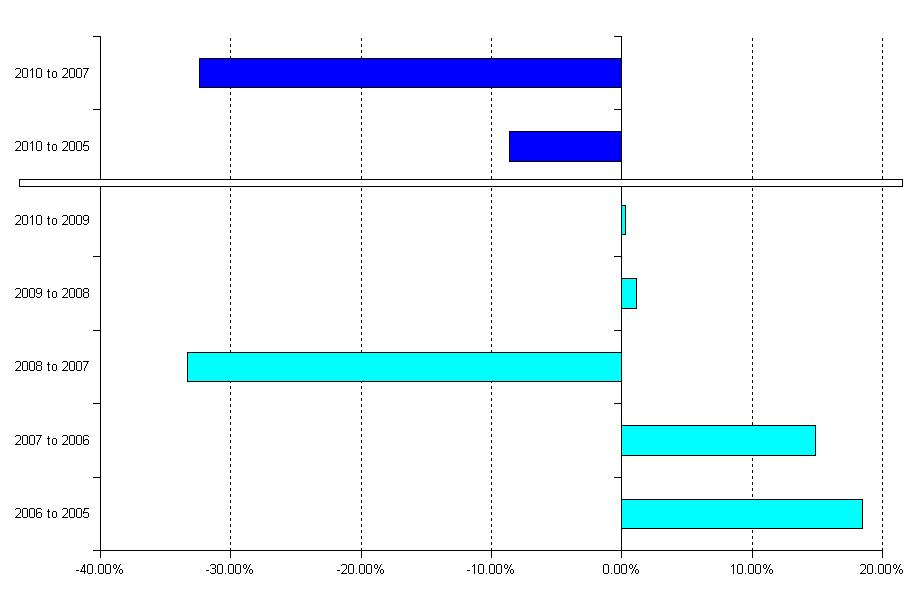
PRODCOM YEARLY EVOLUTION 2005 2010.JPG
(
file
)
42 KB
1
16:36, 16 August 2011
PRODCOM YEARLY EVOLUTION 2005 2010.PNG
(
file
)
42 KB
1
Special page
ISSN 2443-8219


