Tutorials
Log in
Statistics Explained
menu
search
search
Navigation
Main page
Statistical themes
Glossary
Categories
Statistics 4 beginners
Tutorials
Help
Eurostat home
Education corner
Online publications
Regional yearbook
Sustainable development
Full list
Tools
User contributions
Logs
View user groups
Special pages
search
Navigation
Main page
Statistical themes
Glossary
Categories
Statistics 4 beginners
Tutorials
Help
Eurostat home
Education corner
Online publications
Regional yearbook
Sustainable development
Full list
Tools
User contributions
Logs
View user groups
Special pages
Navigation
Main page
Statistical themes
Glossary
Categories
Statistics 4 beginners
Tutorials
Help
Eurostat home
Education corner
Online publications
Regional yearbook
Sustainable development
Full list
Tools
User contributions
Logs
View user groups
Special pages
Uploads by Agafilu
This special page shows all uploaded files.
File list
Items per page:
20
50
100
250
500
Search for media name:
Username:
Include old versions of files
Go
First page
Previous page
Next page
Last page
Date
Name
Thumbnail
Size
Description
Versions
15:33, 5 July 2023
Healthy Life Years Statistics 2021 data.xlsx
(
file
)
67 KB
1
15:17, 5 July 2023
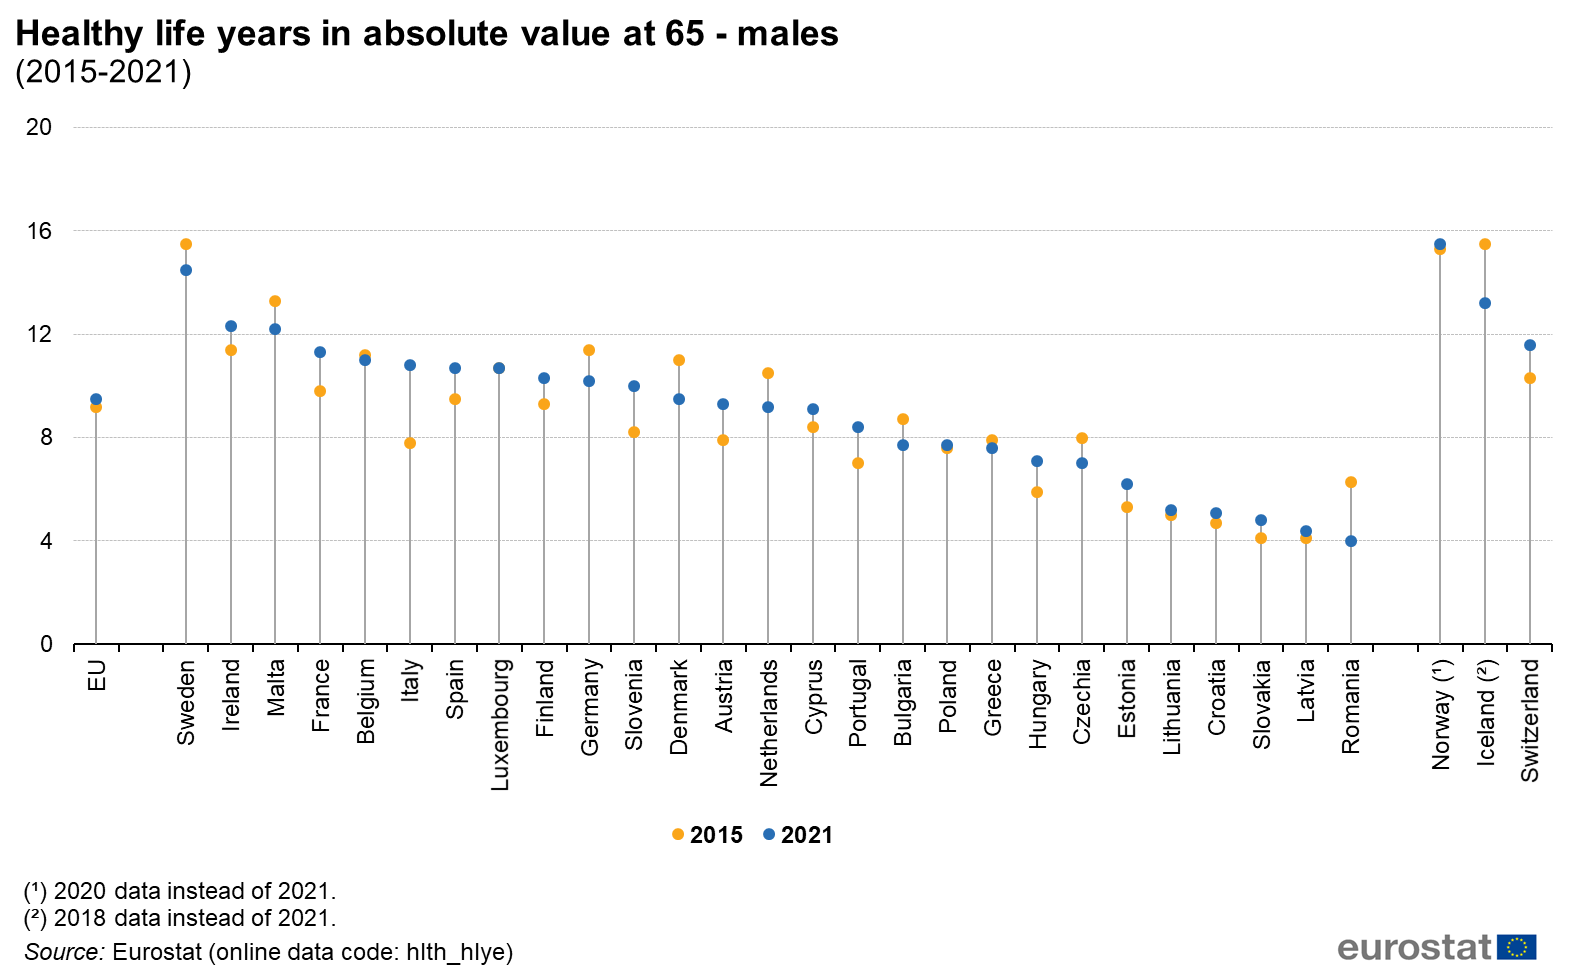
Healthy life years in absolute value at 65 - males (2015-2021).png
(
file
)
106 KB
1
15:16, 5 July 2023
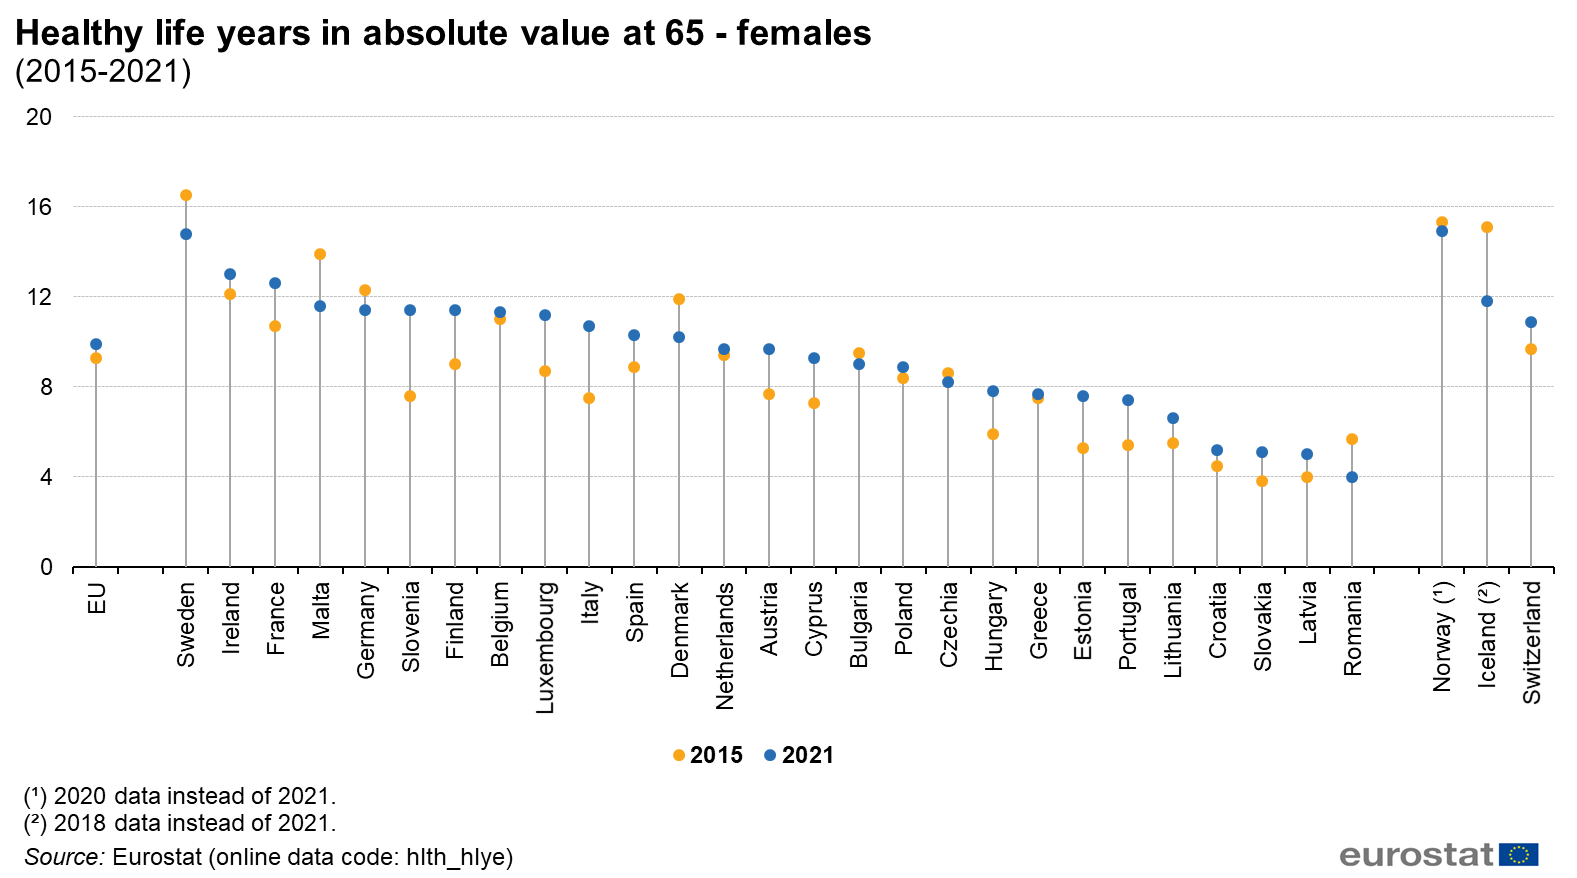
Healthy life years in absolute value at 65 - females (2015-2021).png
(
file
)
104 KB
1
15:15, 5 July 2023
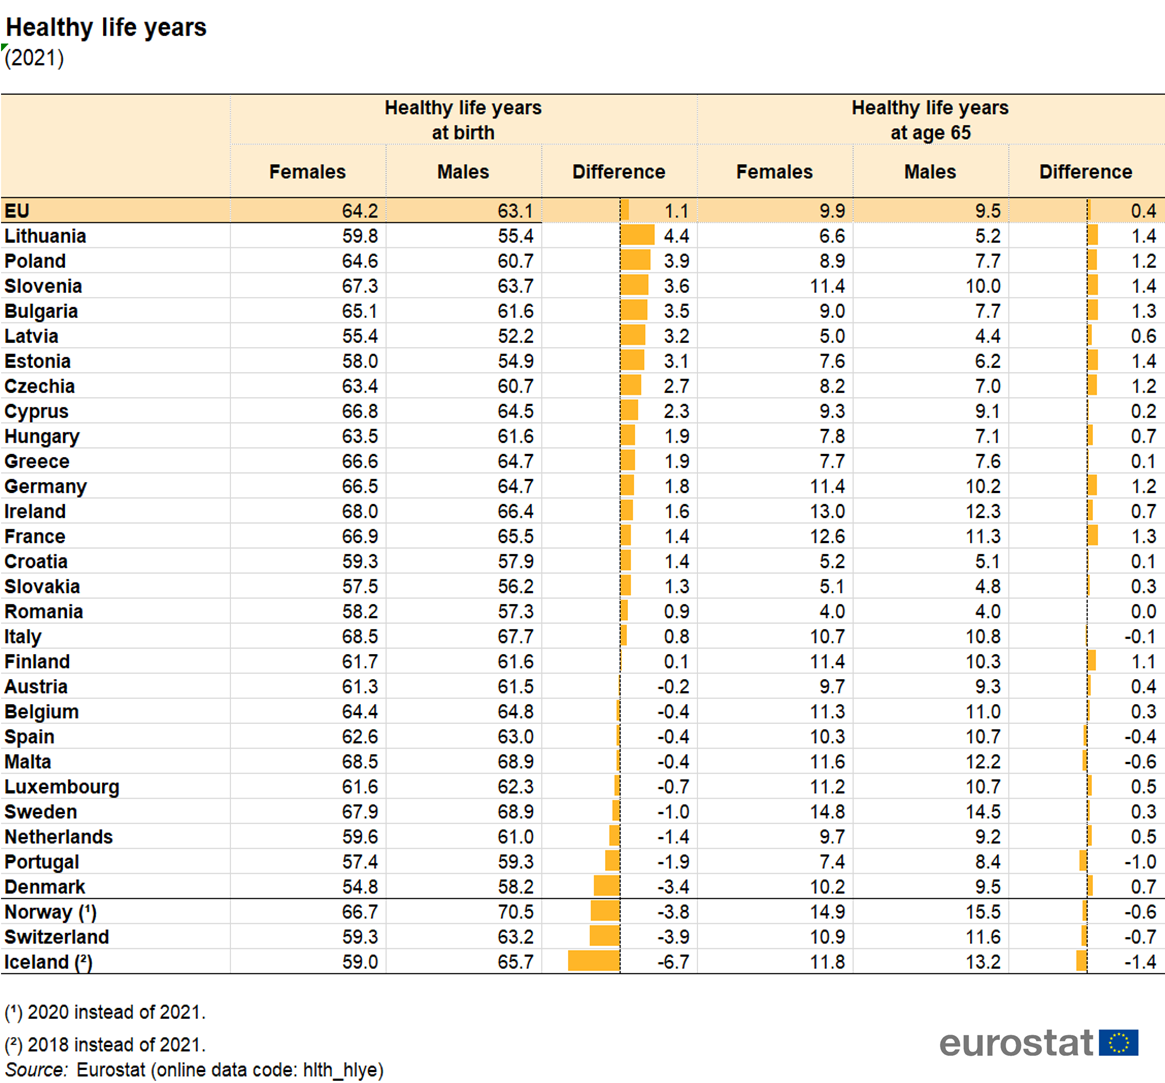
Healthy life years (2021).png
(
file
)
426 KB
1
15:14, 5 July 2023
Healthy life years in absolute value at birth - males (2015-2021).png
(
file
)
104 KB
1
15:12, 5 July 2023
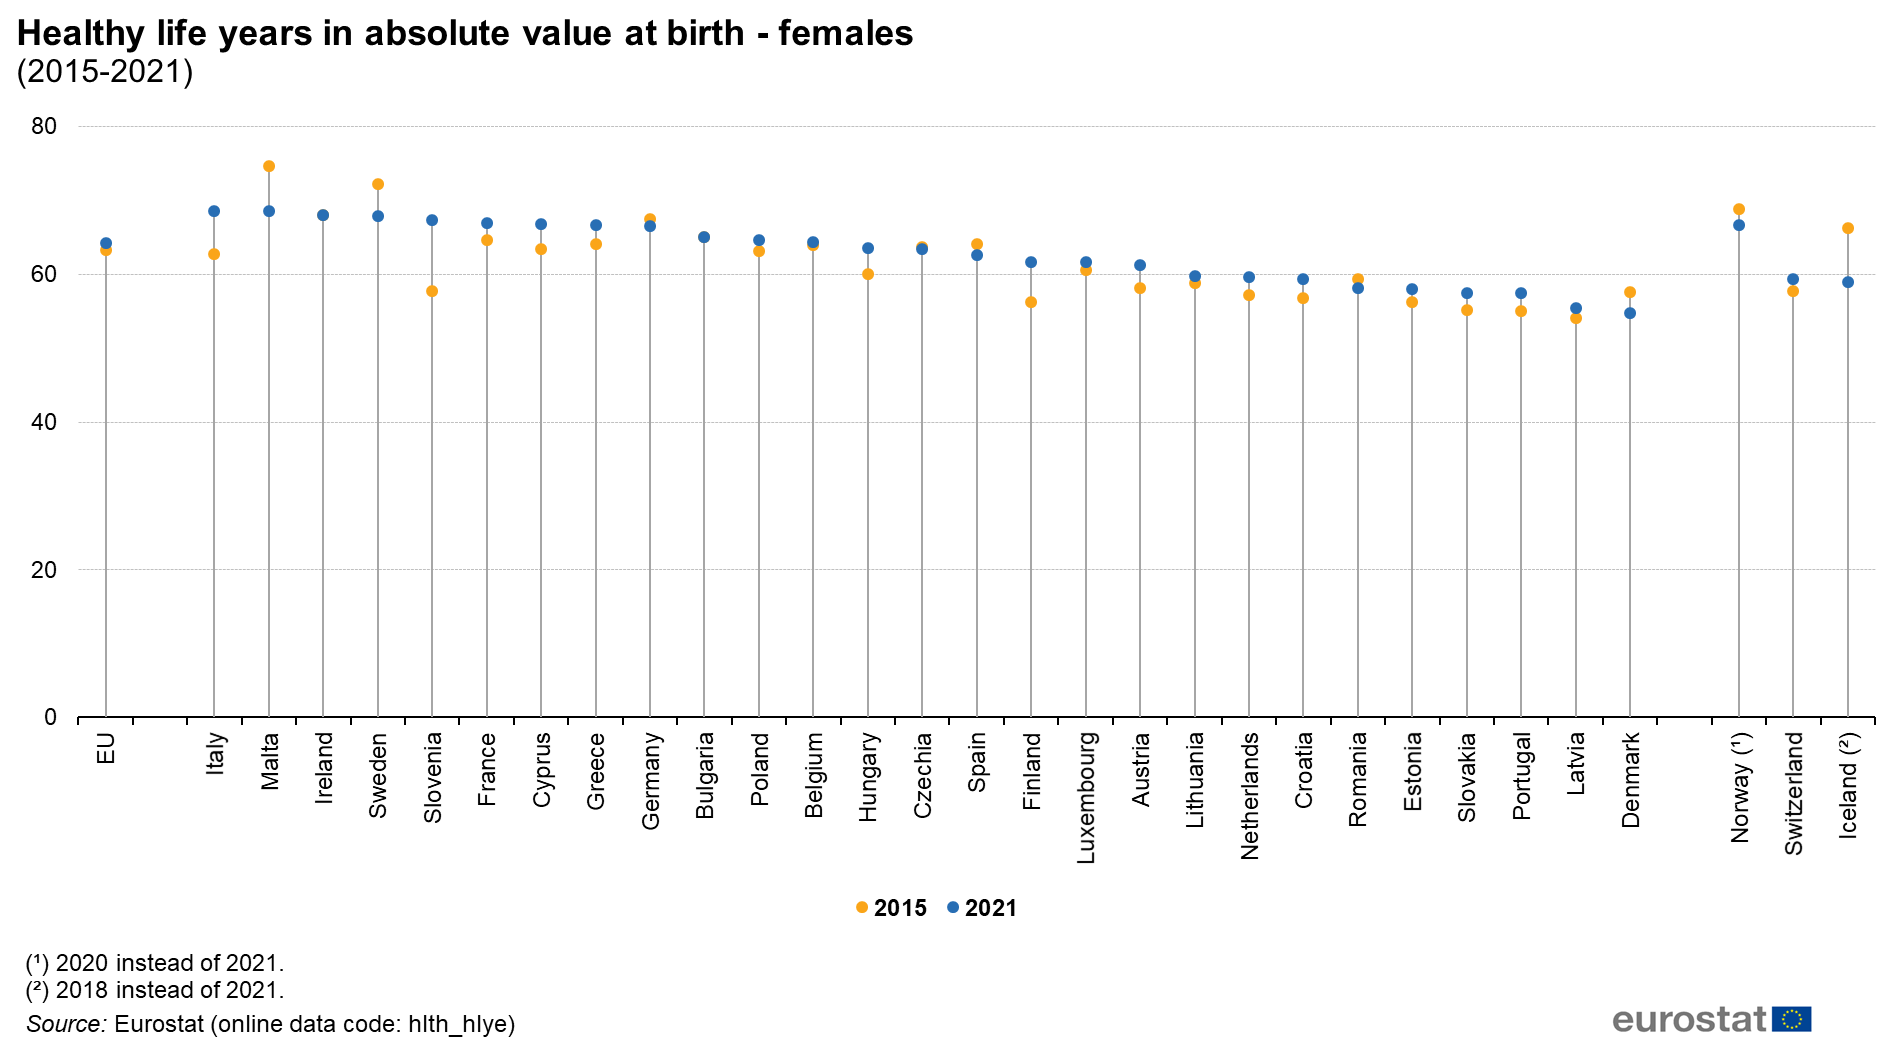
Healthy life years in absolute value at birth - females (2015-2021).png
(
file
)
119 KB
1
17:01, 24 May 2023
Children with unmet needs for dental care, by household composition, 2021 vnew.png
(
file
)
126 KB
1
16:57, 24 May 2023
Children with unmet needs for medical care, by household composition, 2021 v0.png
(
file
)
131 KB
1
16:55, 24 May 2023
Children with unmet needs for dental care, by household income, 2021 v0.png
(
file
)
117 KB
1
16:54, 24 May 2023
Children with unmet needs for medical care, by household income, 2021 v0.png
(
file
)
114 KB
1
16:53, 24 May 2023
Children with 'moderate or severe' disability, by age group, 2021 v0.png
(
file
)
108 KB
1
16:52, 24 May 2023
Children with 'moderate or severe' disability, by household income, 2021 v0.png
(
file
)
97 KB
1
16:50, 24 May 2023
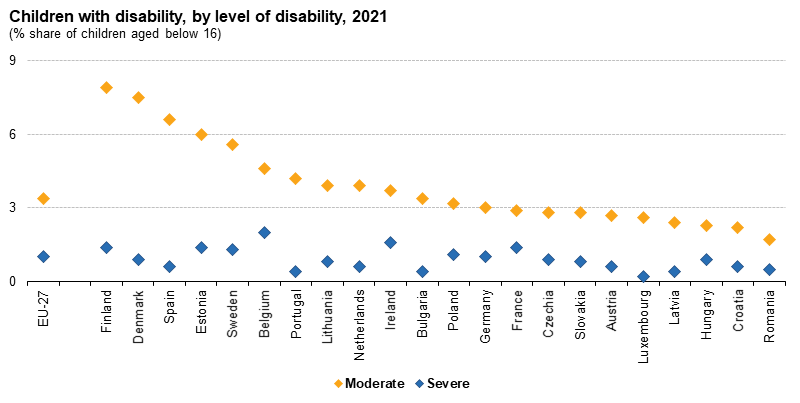
Children with disability, by level of disability, 2021 v0.png
(
file
)
82 KB
1
16:49, 24 May 2023
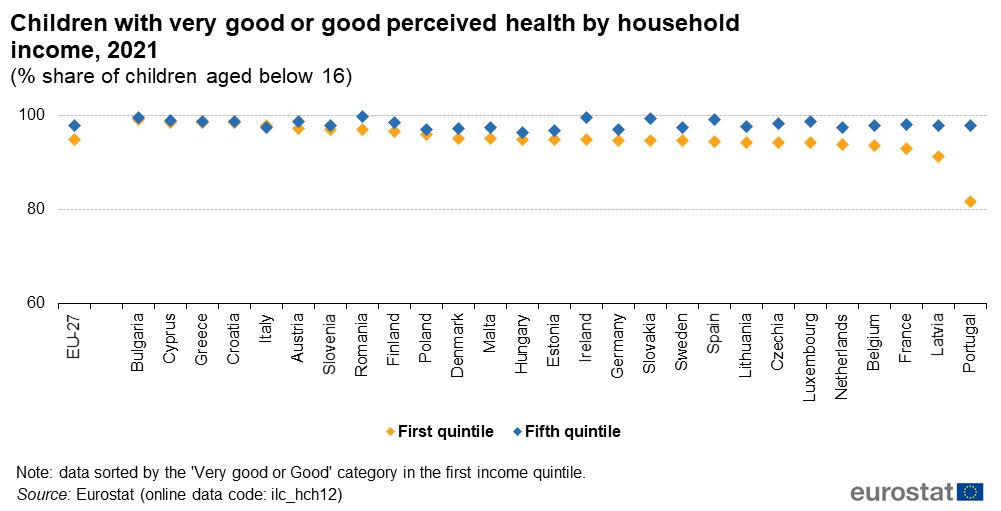
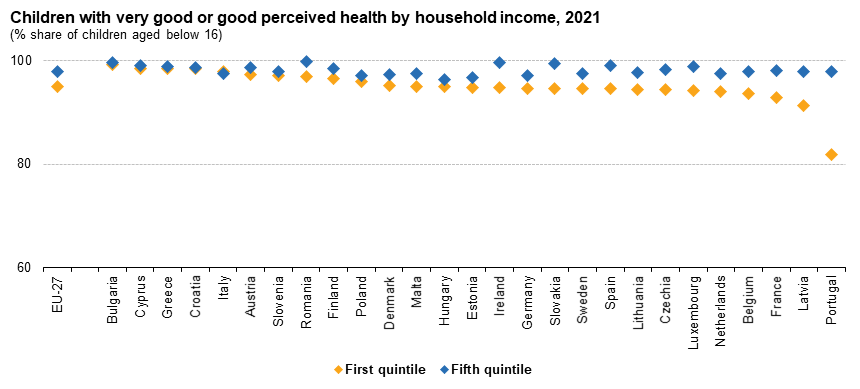
Children with very good or good perceived health by household income, 2021 v0.png
(
file
)
87 KB
1
16:39, 24 May 2023
Children's health statistics indicators 2021data v4.xlsx
(
file
)
215 KB
1
14:16, 23 May 2023
Vis1-childrens-health 260523.png
(
file
)
124 KB
1
09:02, 23 May 2023
Children's health statistics indicators 2021data v3.xlsx
(
file
)
215 KB
1
09:01, 23 May 2023
Children with unmet needs for medical care, by household income, 2021 v2.png
(
file
)
63 KB
1
10:26, 17 May 2023
Children's health statistics indicators 2021data v2.xlsx
(
file
)
103 KB
1
17:35, 16 May 2023
Children with unmet needs for dental care, by household income, 2021 % share of children aged below 16.png
(
file
)
65 KB
1
17:32, 16 May 2023
Children with unmet needs for medical care, by household income, 2021 (% share of children aged below 16).png
(
file
)
62 KB
1
17:27, 16 May 2023
Children with unmet needs for dental care, by household composition, 2021 (% share of children aged below 16).png
(
file
)
67 KB
1
17:03, 16 May 2023
Children with unmet needs for medical care, by household composition, 2021 (% share of children aged below 16).png
(
file
)
71 KB
1
16:20, 16 May 2023
Children with unmet needs for dental care, by household income, 2021 .png
(
file
)
62 KB
1
15:59, 16 May 2023
Children with unmet needs for medical care, by household income, 2021 .png
(
file
)
59 KB
1
15:57, 16 May 2023
Children with unmet needs for medical care, by household income, 2017 (% share of children aged below 16).png
(
file
)
59 KB
1
15:32, 16 May 2023
Children with 'moderate or severe' disability, by age group, 2021 .png
(
file
)
59 KB
1
15:31, 16 May 2023
Children with 'moderate or severe' disability, by household income, 2021 .png
(
file
)
55 KB
1
15:30, 16 May 2023
Children with disability, by level of disability, 2021 .png
(
file
)
44 KB
1
15:29, 16 May 2023
Children with very good or good perceived health by household income, 2021 .png
(
file
)
48 KB
1
11:25, 16 May 2023
Children with 'moderate or severe' disability, by age group, 2021 (% share of children aged below 16).png
(
file
)
35 KB
1
10:55, 16 May 2023
Children with 'moderate or severe' disability, by household income, 2021 (% share of children aged below 16).png
(
file
)
34 KB
1
16:58, 15 May 2023
Children with disability, by level of disability, 2021.png
(
file
)
28 KB
1
16:45, 15 May 2023
Children with disability, by level of disability, 2021 (% share of children aged below 16).png
(
file
)
27 KB
1
10:51, 15 May 2023
Children with very good or good perceived health by household income, 2021 (% share of children aged below 16).png
(
file
)
31 KB
1
19:02, 5 December 2022
Functional and activity limitations statistics Health2022 (1).xlsx
(
file
)
1.4 MB
1
18:58, 5 December 2022
Distribution of persons aged 16 years or over by self-reported long-standing limitations in usual activities due to health problems, by sex, 2021 (%).png
(
file
)
95 KB
1
18:46, 5 December 2022
Share of persons aged 16 years or over with self-reported long-standing limitations in usual activities due to health problems, by sex, 2021 (%).png
(
file
)
76 KB
1
18:31, 5 December 2022
Share of persons aged 16 years or over with self-reported long-standing limitations in usual activities due to health problems, 2021 (%).png
(
file
)
93 KB
1
12:43, 2 December 2022
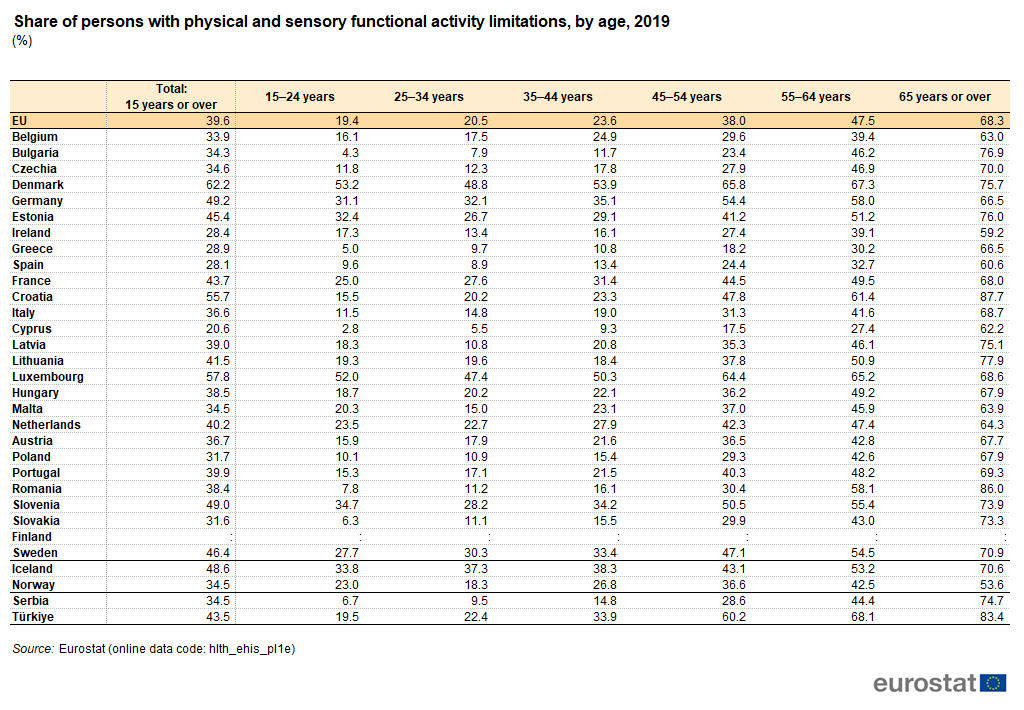
Share of persons with physical and sensory functional activity limitations, by age, 2019 (%).png
(
file
)
71 KB
1
12:41, 2 December 2022
Distribution of persons aged 15 years or over with physical and sensory functional activity limitations, by sex, 2019 (%).png
(
file
)
77 KB
1
12:34, 2 December 2022
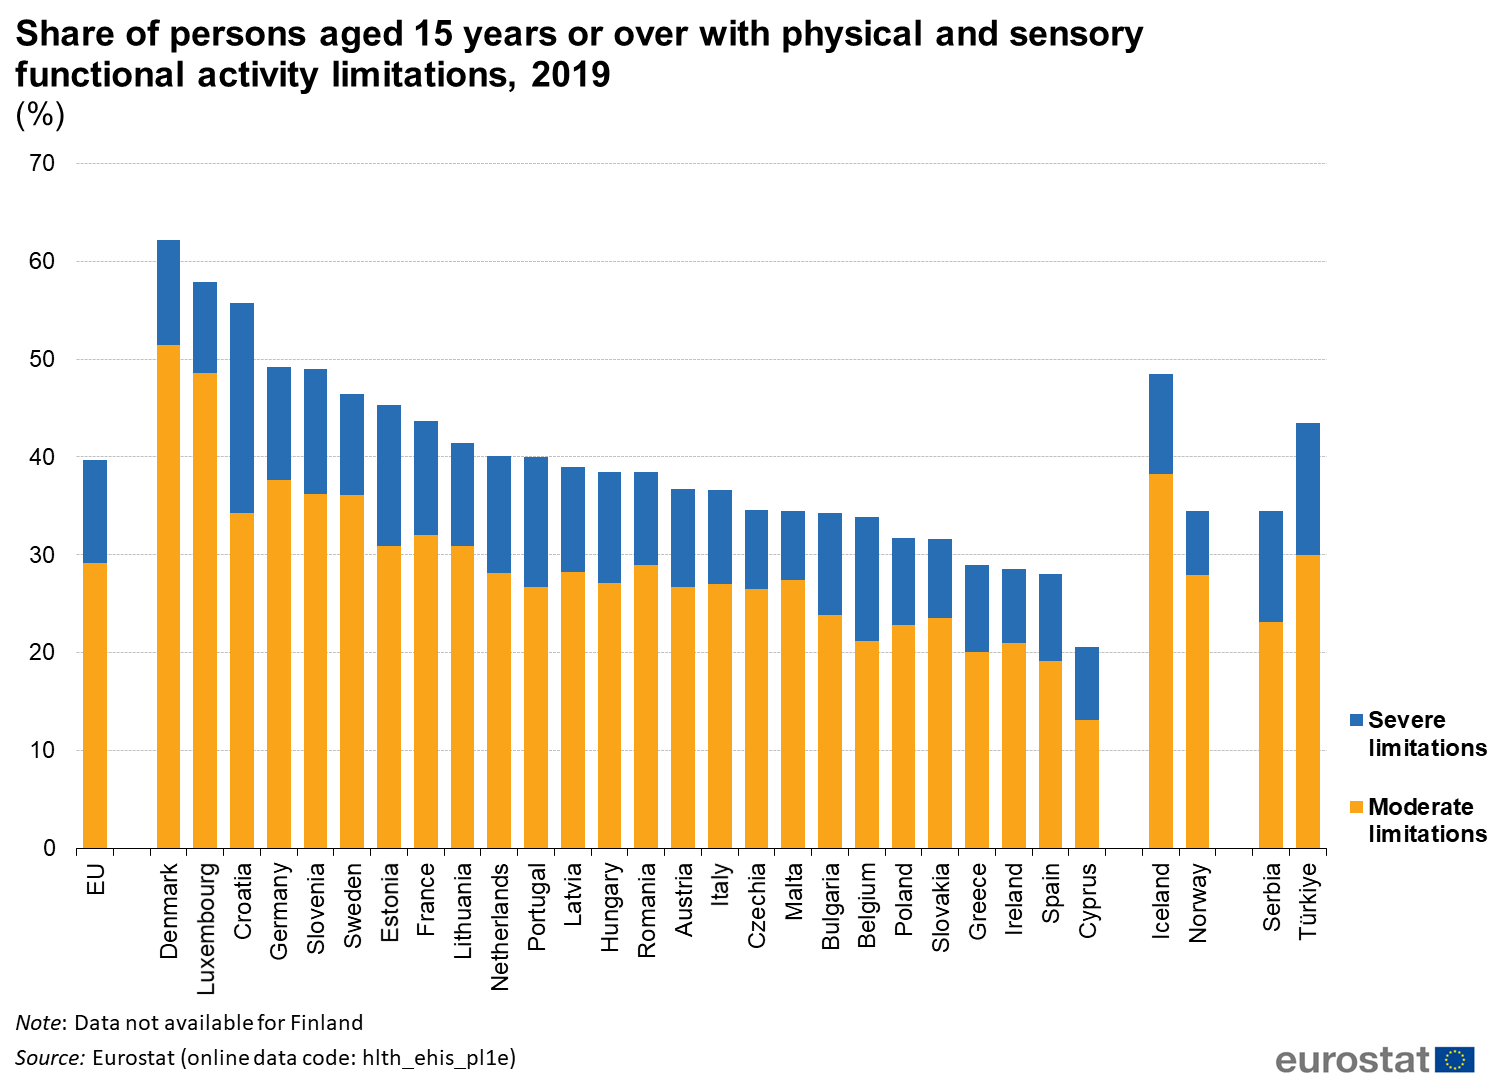
Share of persons aged 15 years or over with physical and sensory functional activity limitations, 2019 (%).png
(
file
)
157 KB
1
18:13, 1 December 2022
Share of persons aged 15 years or over with physical and sensory functional activity limitations, 2019 2022(%).png
(
file
)
155 KB
1
12:54, 24 November 2022
Self-perceived health statistics Health2022 v2.xlsx
(
file
)
535 KB
1
12:49, 24 November 2022
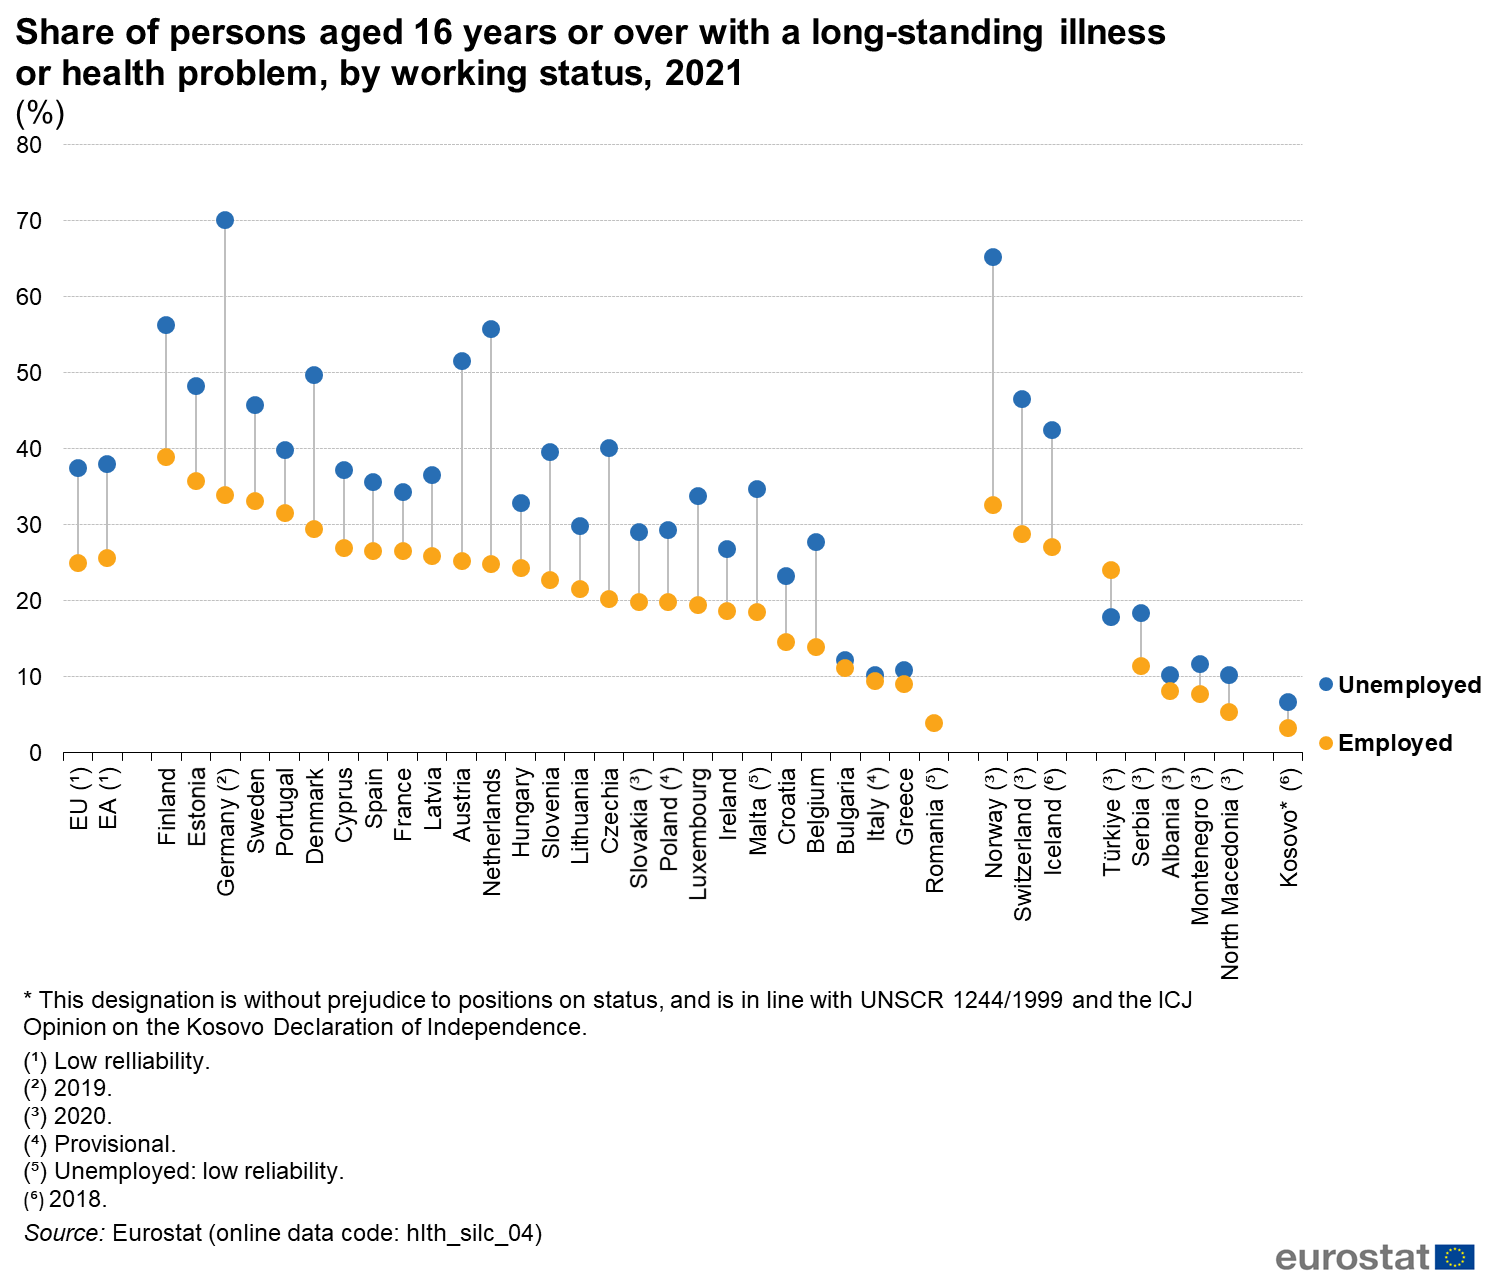
Share of persons aged 16 years or over with a long-standing illness or health problem, by working status, 2021 (%).png
(
file
)
154 KB
1
14:35, 9 August 2022
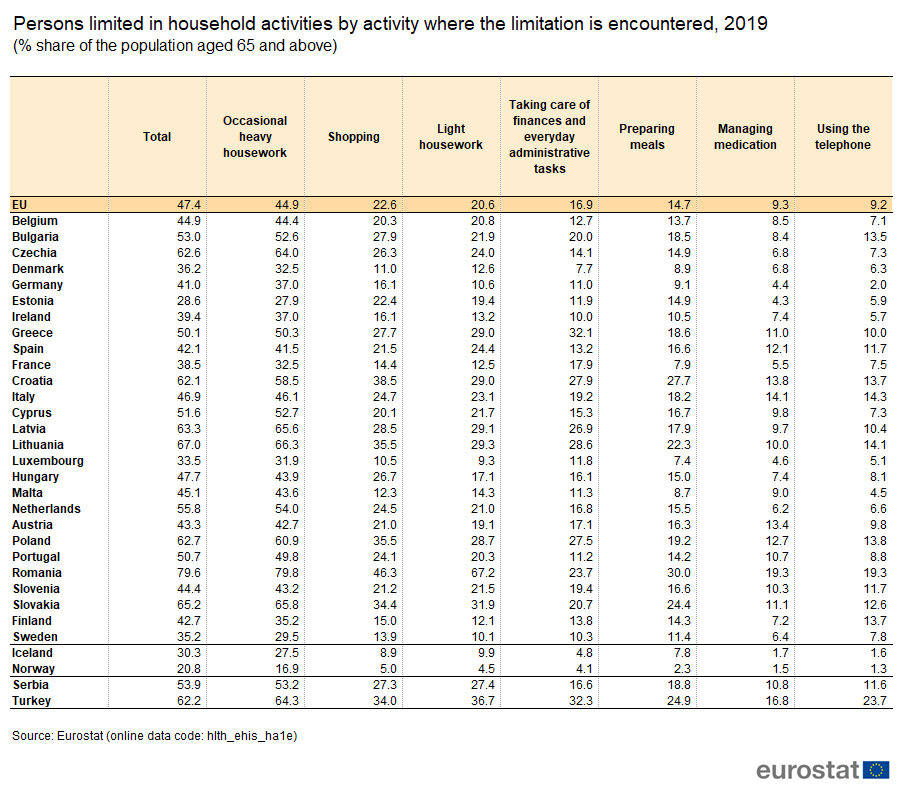
Persons limited in household activities by activity where the limitation is encountered, 2019 v2.png
(
file
)
79 KB
1
15:10, 8 August 2022
Elderly needs for help or assistance 2022.xls
(
file
)
102 KB
1
15:08, 8 August 2022
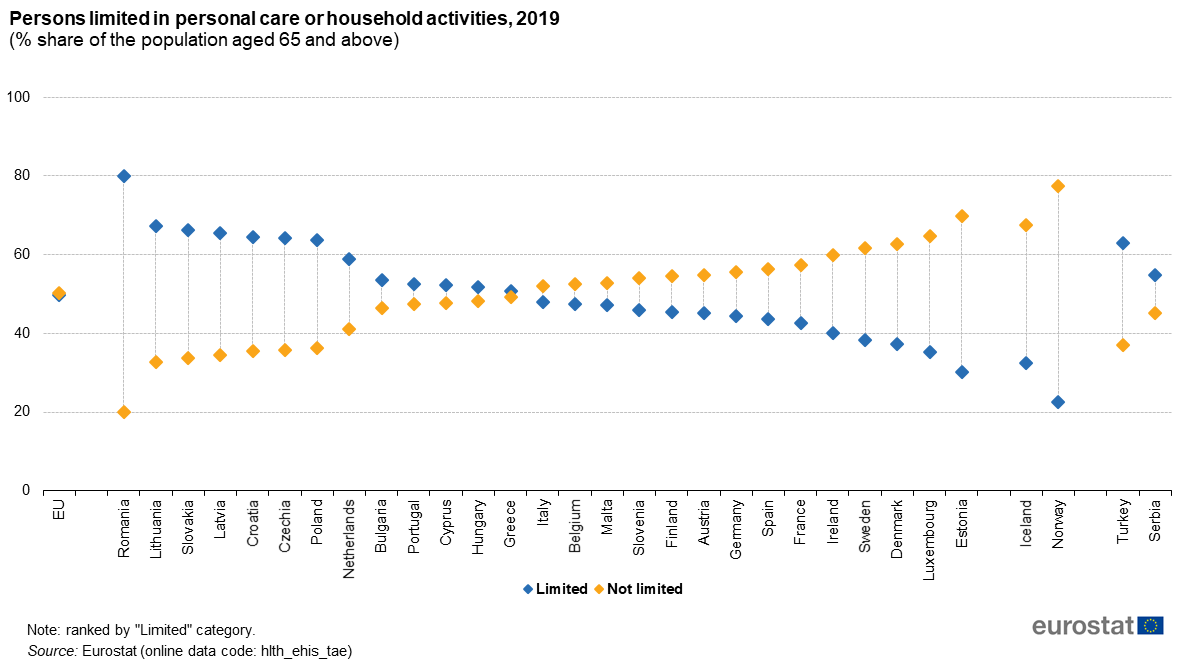
Persons limited in personal care or household activities, 2019 (% share of the population aged 65 and above).png
(
file
)
57 KB
1
14:57, 8 August 2022
Self-reported use of home care services by level of difficulty with personal care or household activities, 2019 (% share of the population aged 65 and above).png
(
file
)
63 KB
1
14:56, 8 August 2022
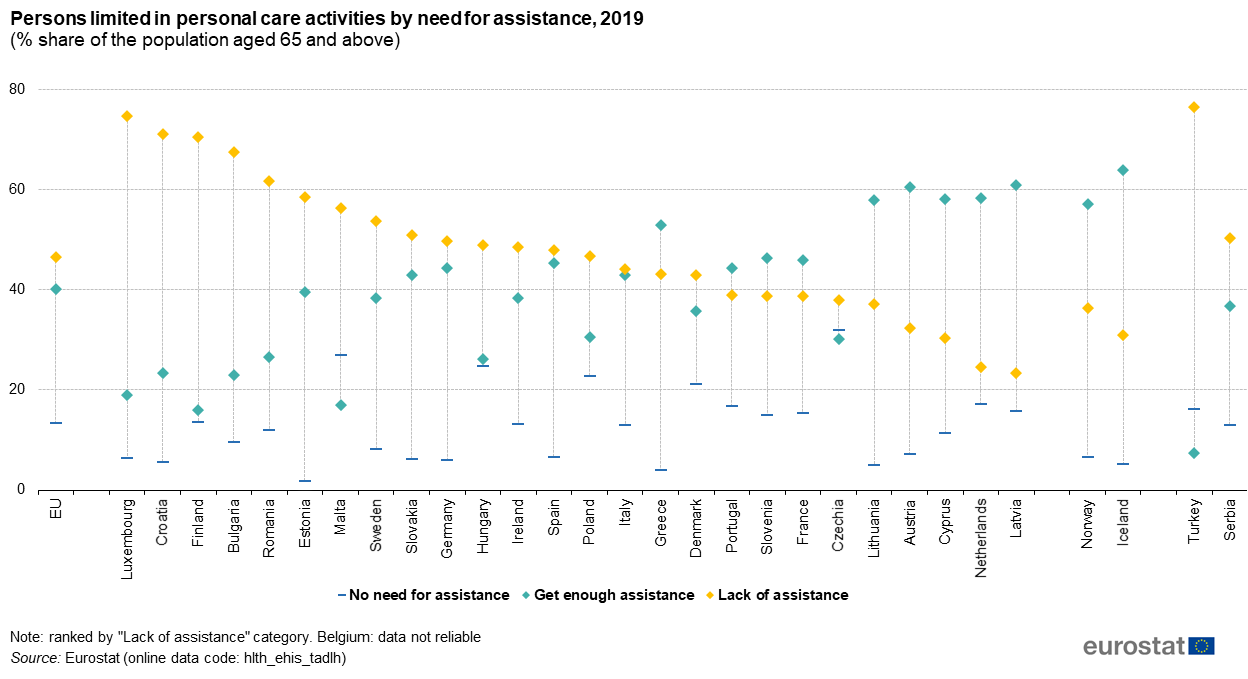
Persons limited in personal care activities by need for assistance, 2019 (% share of the population aged 65 and above).png
(
file
)
64 KB
1
First page
Previous page
Next page
Last page
Special page
ISSN 2443-8219
.png)
.png)
.png)
.png)
.png)


.png)
.png)
.png)


.png)


.png)
.png)

.png)
.png)
.png)
.png)
.png)
.png)
.png)
.png)
.png)
.png)

.png)
.png)
.png)