Tutorials
Log in
Statistics Explained
menu
search
search
Navigation
Main page
Statistical themes
Glossary
Categories
Statistics 4 beginners
Tutorials
Help
Eurostat home
Education corner
Online publications
Regional yearbook
Sustainable development
Full list
Tools
User contributions
Logs
View user groups
Special pages
search
Navigation
Main page
Statistical themes
Glossary
Categories
Statistics 4 beginners
Tutorials
Help
Eurostat home
Education corner
Online publications
Regional yearbook
Sustainable development
Full list
Tools
User contributions
Logs
View user groups
Special pages
Navigation
Main page
Statistical themes
Glossary
Categories
Statistics 4 beginners
Tutorials
Help
Eurostat home
Education corner
Online publications
Regional yearbook
Sustainable development
Full list
Tools
User contributions
Logs
View user groups
Special pages
Uploads by Svennla
This special page shows all uploaded files.
File list
Items per page:
20
50
100
250
500
Search for media name:
Username:
Include old versions of files
Go
Date
Name
Thumbnail
Size
Description
Versions
15:46, 20 January 2011
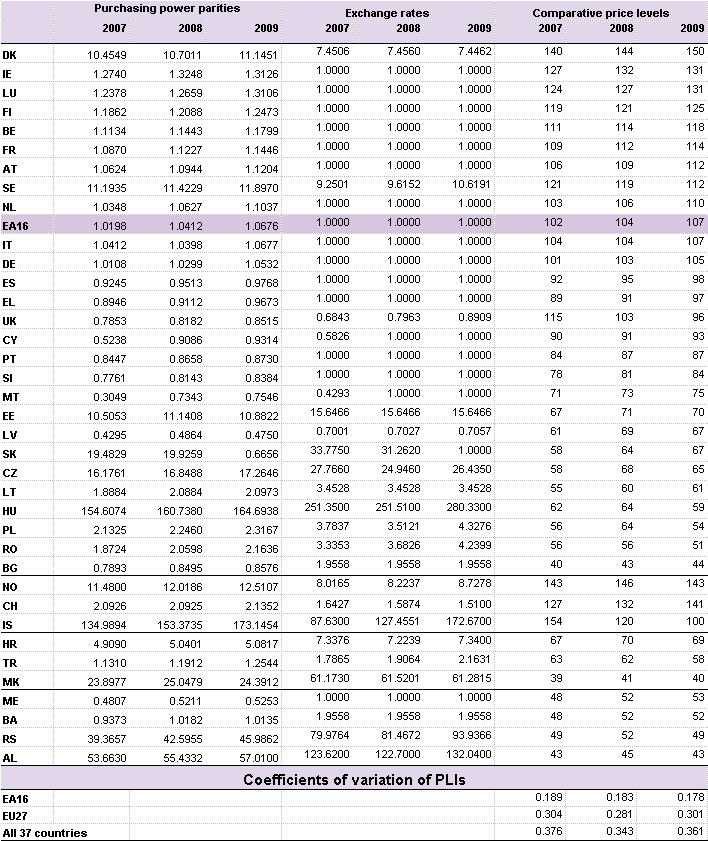
PPPs, exchange rates and comparative price levels for AIC, 2007-2009.PNG
(
file
)
42 KB
1
15:34, 20 January 2011
Volume indices per inhabitant, 2007-2009.PNG
(
file
)
21 KB
1
14:25, 12 January 2011
Volume indices of GDP per inhabitant,2009.PNG
(
file
)
12 KB
1
12:58, 8 January 2010
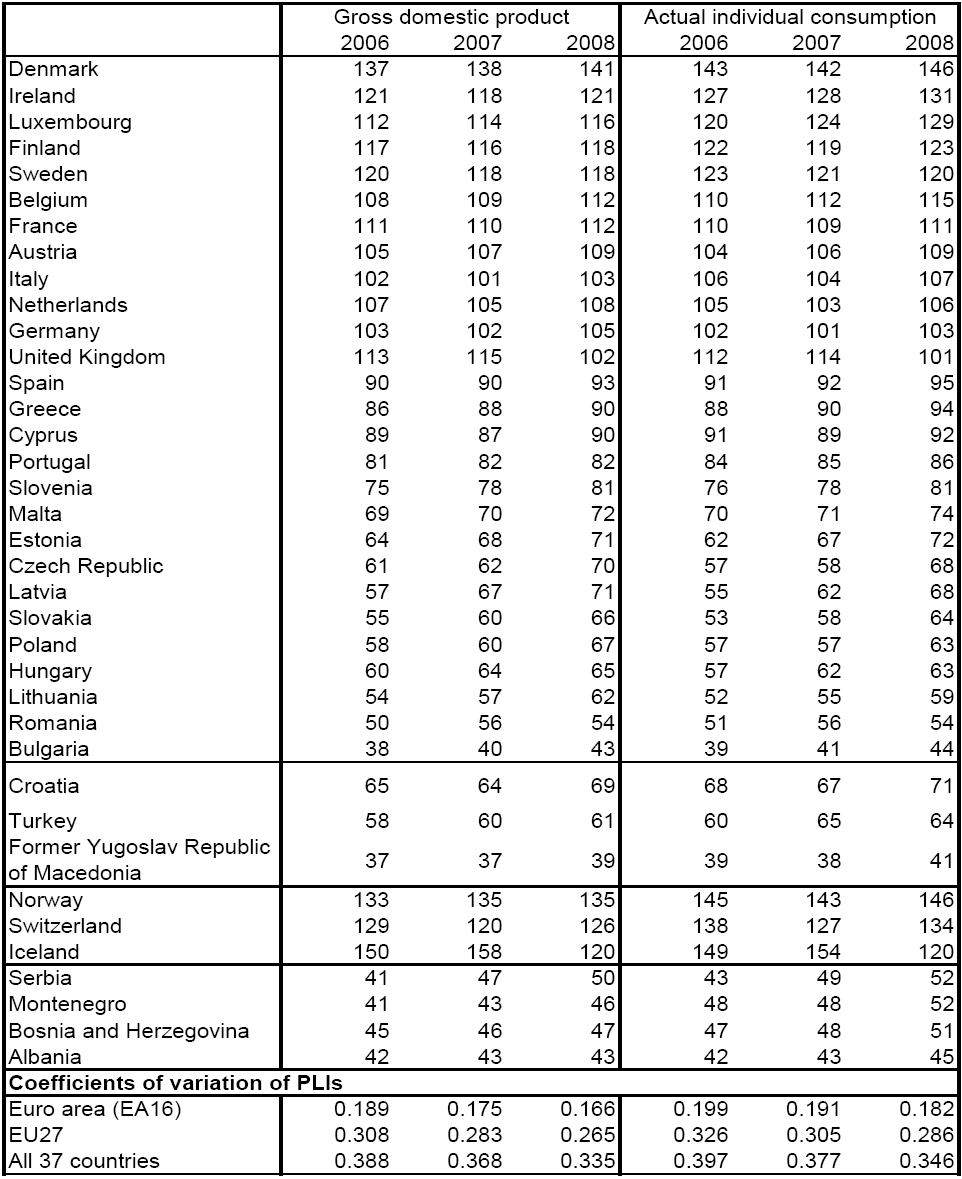
Comparative price level indices 2006-2008.PNG
(
file
)
98 KB
2
12:53, 8 January 2010
Table 2 Comparative price level indices 2006-2008, EU27=100.PNG
(
file
)
98 KB
1
12:32, 8 January 2010
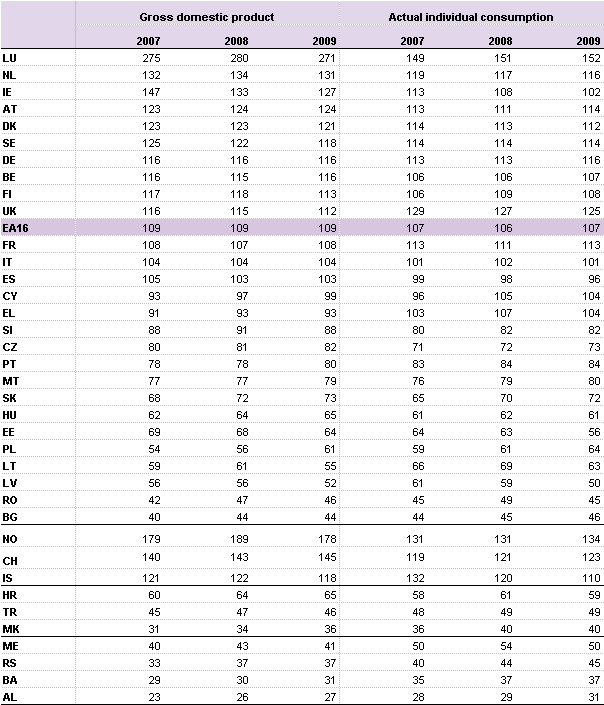
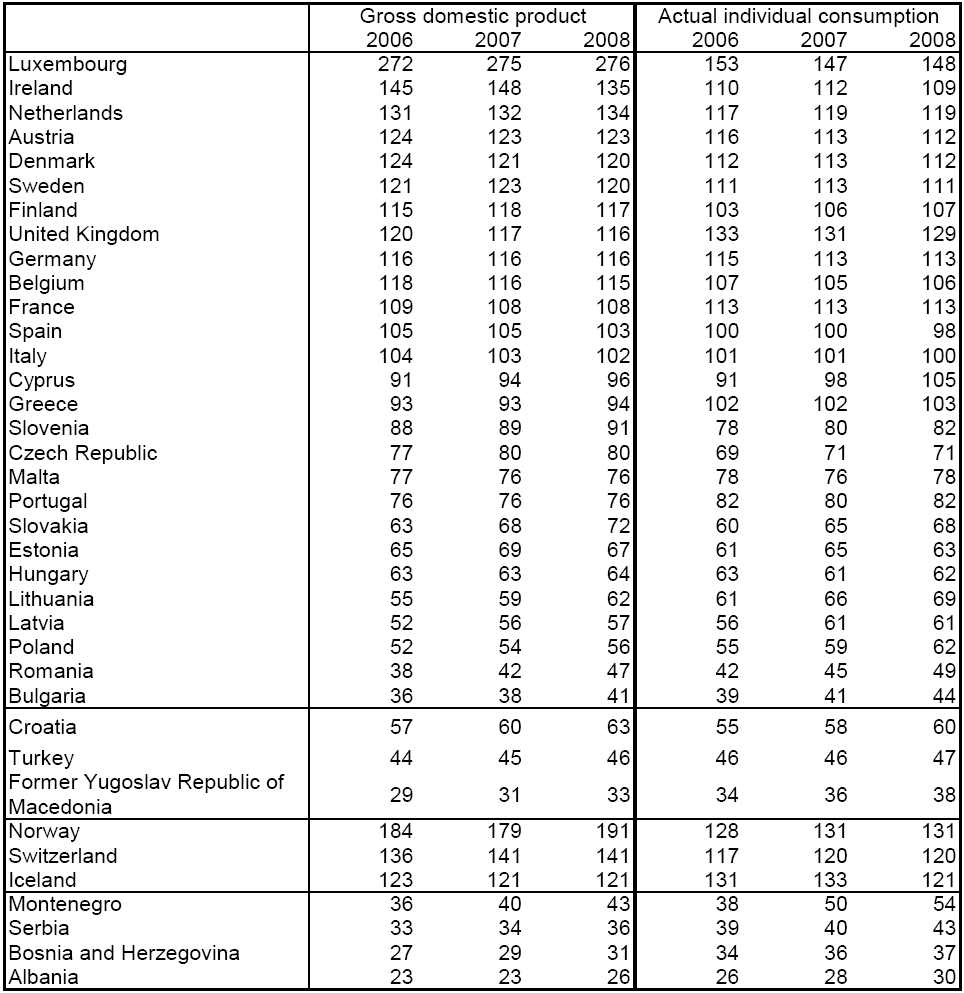
Volume indices of GDP and AIC per inhabitant 2006-2008.PNG
(
file
)
23 KB
1
12:31, 8 January 2010
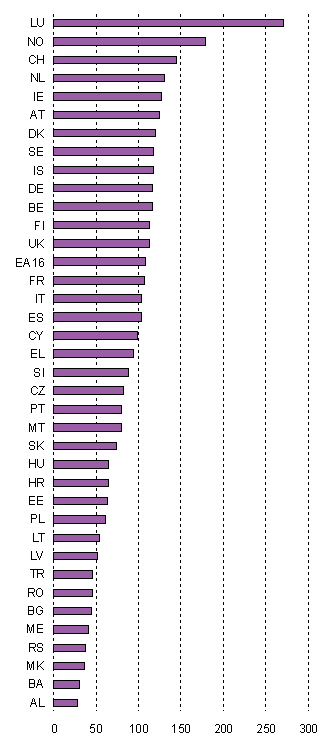
Volume indices of GDP and AIC per inhabitant 2008.PNG
(
file
)
23 KB
1
12:07, 8 January 2010
Volume indices per capita 2006-2008.PNG
(
file
)
92 KB
2
16:23, 20 August 2009
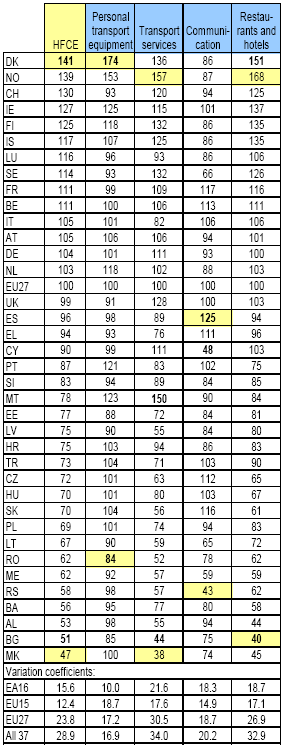
Table 3 PLIs for transport, communication, horeca 2008.PNG
(
file
)
33 KB
1
16:22, 20 August 2009
Table 2 PLIs for energy, furniture, household appliances, electronics 2008.PNG
(
file
)
36 KB
1
16:20, 20 August 2009
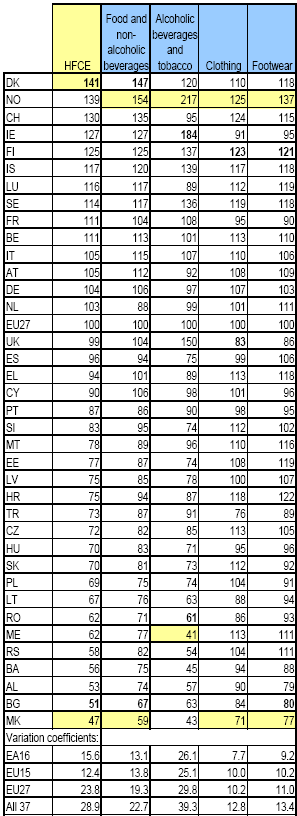
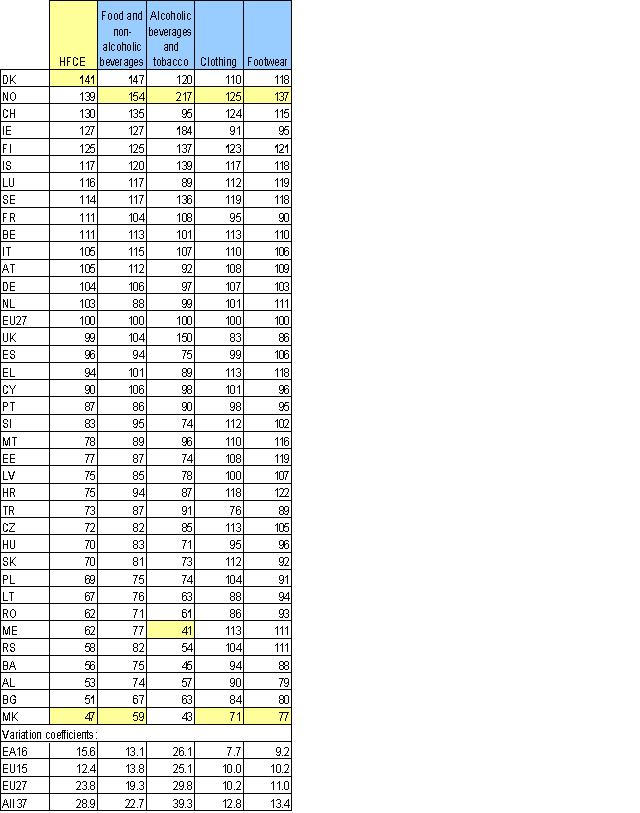
Table 1 PLIs for food, beverages, clothing, footwear 2008.PNG
(
file
)
34 KB
1
16:19, 20 August 2009
Chart 1 PLIs for household consumption 2008.PNG
(
file
)
10 KB
2
16:17, 20 August 2009
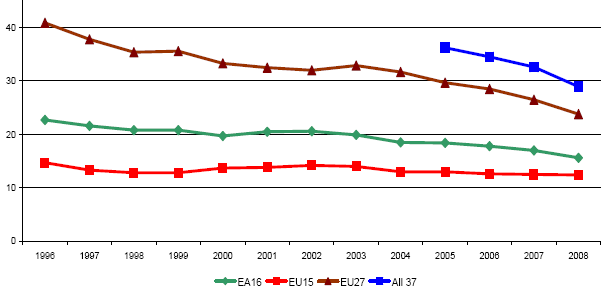
Chart 2 Price convergence 2008.PNG
(
file
)
13 KB
1
15:07, 20 August 2009
Chart 2.PNG
(
file
)
13 KB
2
15:06, 20 August 2009
Chart 1.PNG
(
file
)
10 KB
3
13:48, 20 August 2009
Chart 1- 1 Price level index for four groups of goods and services, 2008. EU27=100.PNG
(
file
)
28 KB
1
13:44, 20 August 2009
1 Price level index for four groups of goods and services, 2008. EU27=100.PNG
(
file
)
28 KB
1
13:39, 20 August 2009
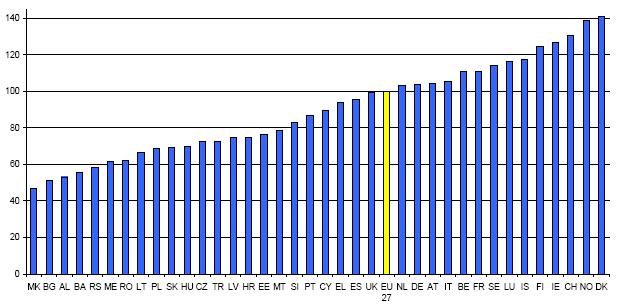
Price level index for household final consumption expenditure (HFCE), 2008.PNG
(
file
)
18 KB
1
16:01, 19 August 2009
Price level index for household final consumption expenditure (HFCE), 2008,.PNG
(
file
)
18 KB
1
Special page
ISSN 2443-8219


,_2008.PNG)
,_2008,.PNG)