Tutorials
Log in
Statistics Explained
menu
search
search
Navigation
Main page
Statistical themes
Glossary
Categories
Statistics 4 beginners
Tutorials
Help
Eurostat home
Education corner
Online publications
Regional yearbook
Sustainable development
Full list
Tools
User contributions
Logs
View user groups
Special pages
search
Navigation
Main page
Statistical themes
Glossary
Categories
Statistics 4 beginners
Tutorials
Help
Eurostat home
Education corner
Online publications
Regional yearbook
Sustainable development
Full list
Tools
User contributions
Logs
View user groups
Special pages
Navigation
Main page
Statistical themes
Glossary
Categories
Statistics 4 beginners
Tutorials
Help
Eurostat home
Education corner
Online publications
Regional yearbook
Sustainable development
Full list
Tools
User contributions
Logs
View user groups
Special pages
Uploads by Slamkfr
This special page shows all uploaded files.
File list
Items per page:
20
50
100
250
500
Search for media name:
Username:
Include old versions of files
Go
First page
Previous page
Next page
Last page
Date
Name
Thumbnail
Size
Description
Versions
07:54, 28 August 2018
FI6ectoral analysis of employment by enterprise size class, Administrative and support service activities (NACE Section N.png
(
file
)
29 KB
2
07:50, 28 August 2018
FI6Sectoral analysis of value added by enterprise size class, Professional, scientific and technical activities (NACE Section M).png
(
file
)
29 KB
1
07:34, 28 August 2018
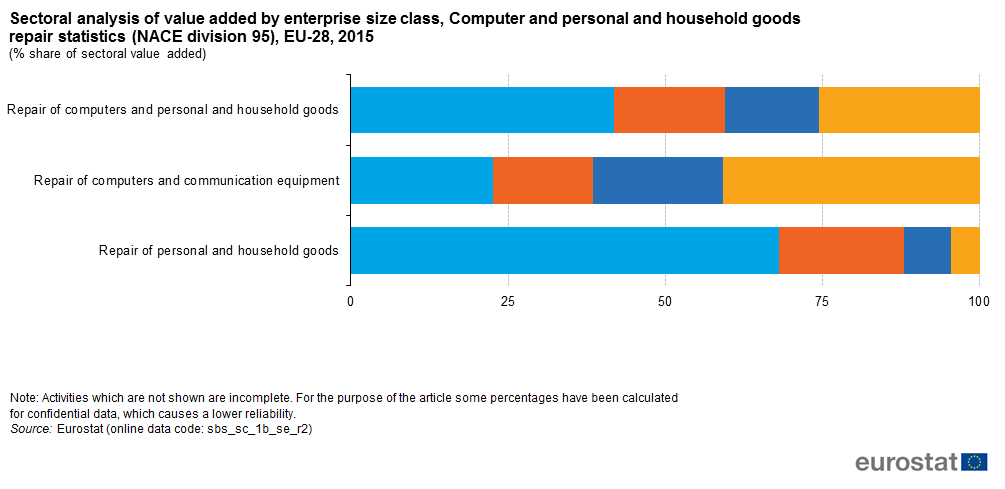
FI6Sectoral analysis of value added by enterprise size class, Computer and personal and household goods repair statistics (NACE division 95).png
(
file
)
26 KB
1
14:31, 23 August 2018
Ten largest NUTS 2 regions in terms of employment, Administrative and support service activities (NACE Section N), 2015.png
(
file
)
26 KB
1
14:31, 23 August 2018
T6bValue added by enterprise size class, Administrative and support service activities (NACE Section N), 2015.png
(
file
)
51 KB
1
14:31, 23 August 2018
T6aNumber of persons employed by enterprise size class, Administrative and support service activities (NACE Section N), 2015.png
(
file
)
50 KB
1
14:30, 23 August 2018
F6Sectoral analysis of value added by enterprise size class, Administrative and support service activities (NACE Section N), EU-28, 2015.png
(
file
)
28 KB
1
14:29, 23 August 2018
F5Sectoral analysis of employment by enterprise size class, Administrative and support service activities (NACE Section N), EU-28, 2015.png
(
file
)
29 KB
1
14:29, 23 August 2018
F4Relative importance of enterprise size classes, Administrative and support service activities (NACE Section N), EU-28, 2015.png
(
file
)
28 KB
1
14:28, 23 August 2018
T5Key size class indicators, Administrative and support service activities (NACE Section N), EU-28, 2015.png
(
file
)
24 KB
1
14:28, 23 August 2018
T4bKey indicators, Administrative and support service activities (NACE Section N), 2015.png
(
file
)
47 KB
1
14:27, 23 August 2018
T4aKey indicators, Administrative and support service activities (NACE Section N), 2015.png
(
file
)
59 KB
1
14:27, 23 August 2018
T3Largest and most specialised Member States in Administrative and support service activities (NACE Section N), EU-28, 2015.png
(
file
)
34 KB
1
14:26, 23 August 2018
F3Concentration of value added and employment, Administrative and support service activities (NACE Section N), 2015.png
(
file
)
29 KB
1
14:26, 23 August 2018
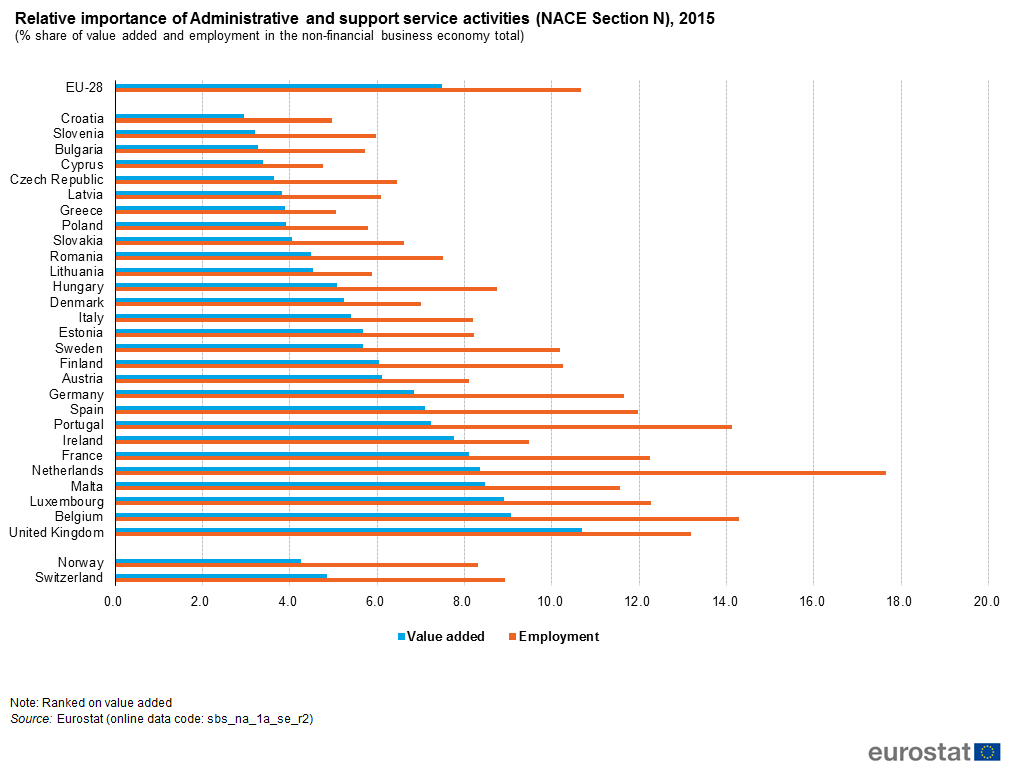
F2Relative importance of Administrative and support service activities (NACE Section N), 2015.png
(
file
)
40 KB
1
14:25, 23 August 2018
T2bSectoral analysis of key indicators, Administrative and support service activities (NACE Section N), EU-28, 2015.png
(
file
)
26 KB
1
14:25, 23 August 2018
T2aSectoral analysis of key indicators, Administrative and support service activities (NACE Section N), EU-28, 2015.png
(
file
)
29 KB
1
14:25, 23 August 2018
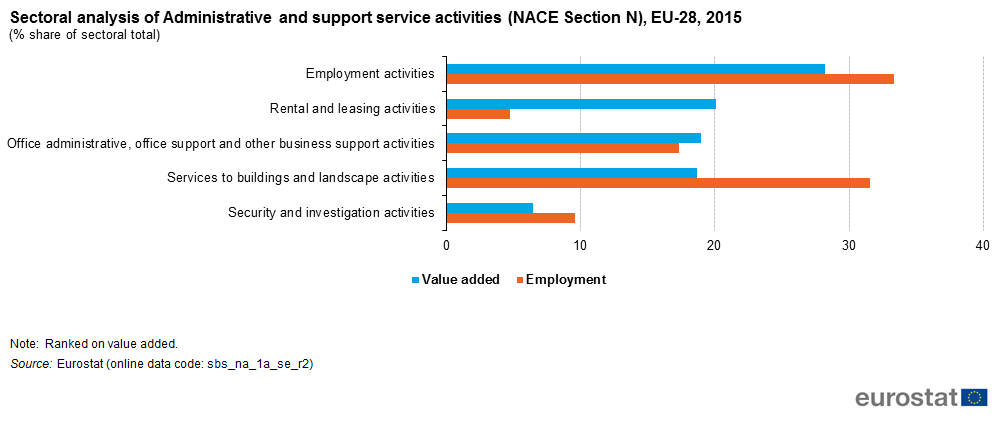
F1Sectoral analysis of Administrative and support service activities (NACE Section N), EU-28, 2015.png
(
file
)
21 KB
1
14:24, 23 August 2018
T1Key indicators, Administrative and support service activities (NACE Section N), EU-28, 2015.png
(
file
)
28 KB
1
13:55, 23 August 2018
F7Ten largest NUTS 2 regions in terms of employment, Computer (NACE division 95), EU-28 and Norway, 2015.png
(
file
)
26 KB
1
13:55, 23 August 2018
T6bValue added by enterprise size class, Computer and personal and household goods repair statistics (NACE division 95), 2015.png
(
file
)
46 KB
1
13:55, 23 August 2018
T6aNumber of persons employed by enterprise size class, Computer and personal and household goods repair statistics (NACE division 95), 2015.png
(
file
)
49 KB
1
13:54, 23 August 2018
F6Sectoral analysis of value added by enterprise size class, Computer(NACE division 95), EU-28, 2015.png
(
file
)
25 KB
1
13:54, 23 August 2018
F5Sectoral analysis of employment by enterprise size class, Computer (NACE division 95), EU-28, 2015.png
(
file
)
26 KB
1
13:53, 23 August 2018
F4Relative importance of enterprise size classes, Computer and personal and household goods repair statistics (NACE division 95), EU-28, 2015.png
(
file
)
30 KB
1
13:53, 23 August 2018
T5Key size class indicators,Computer and personal and household goods repair statistics (NACE division 95), EU-28, 2015.png
(
file
)
25 KB
1
13:52, 23 August 2018
T4bKey indicators, Computer and personal and household goods repair statistics (NACE division 95), 2015.png
(
file
)
46 KB
1
13:52, 23 August 2018
T4aKey indicators, Computer and personal and household goods repair statistics (NACE division 95), 2015.png
(
file
)
56 KB
1
13:51, 23 August 2018
T3Largest and most specialised Member States in Computer and personal and household goods repair statistics (NACE division 95), EU-28, 2015.png
(
file
)
27 KB
1
13:51, 23 August 2018
F3Concentration of value added and employment, Computer and personal and household goods repair statistics (NACE division 95), 2015.png
(
file
)
30 KB
1
13:50, 23 August 2018
F2Relative importance of Computer and personal and household goods repair statistics.png
(
file
)
37 KB
1
13:50, 23 August 2018
T2bSectoral analysis of key indicators, Computer and personal and household goods repair statistics (NACE division 95), EU-28, 2015.png
(
file
)
20 KB
1
13:49, 23 August 2018
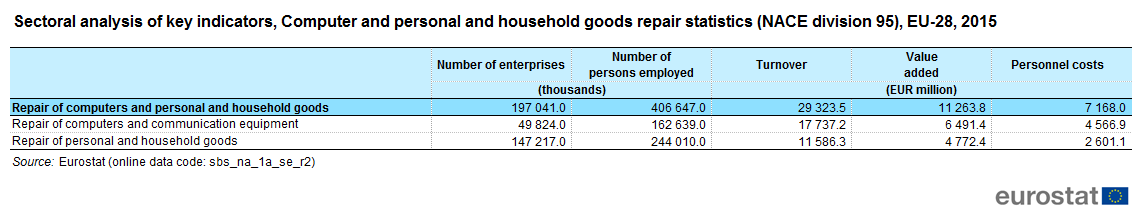
T2aSectoral analysis of key indicators, Computer and personal and household goods repair statistics (NACE division 95), EU-28, 2015.png
(
file
)
21 KB
1
13:49, 23 August 2018
F1Sectoral analysis of Computer and personal and household goods repair statistics (NACE division 95), EU-28, 2015.png
(
file
)
20 KB
1
13:48, 23 August 2018
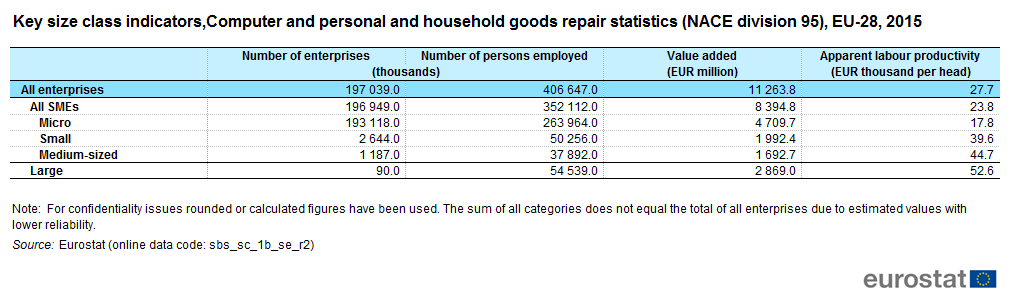
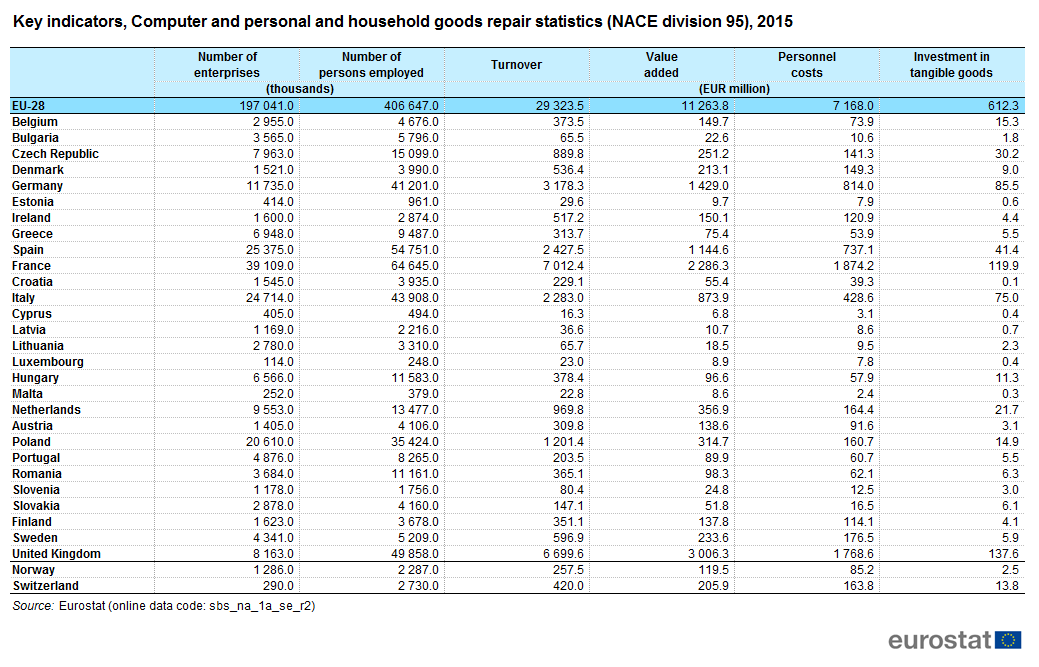
T1Key indicators, Computer and personal and household goods repair statistics (NACE division 95), EU-28, 2015.png
(
file
)
28 KB
1
13:47, 23 August 2018
T2aSectoral analysis of key indicators, Professional, scientific and technical activities (NACE Section M), EU-28, 2015.png
(
file
)
30 KB
2
13:47, 23 August 2018
F1Sectoral analysis of Professional, scientific and technical activities (NACE Section M), EU-28, 2015.png
(
file
)
20 KB
2
13:47, 23 August 2018
T1Key indicators, Professional, scientific and technical activities (NACE Section M), EU-28, 2015.png
(
file
)
30 KB
2
13:40, 23 August 2018
F7Ten largest NUTS 2 regions in terms of employment, Professional, scientific and technical activities (NACE Section M), 2015.png
(
file
)
25 KB
1
13:40, 23 August 2018
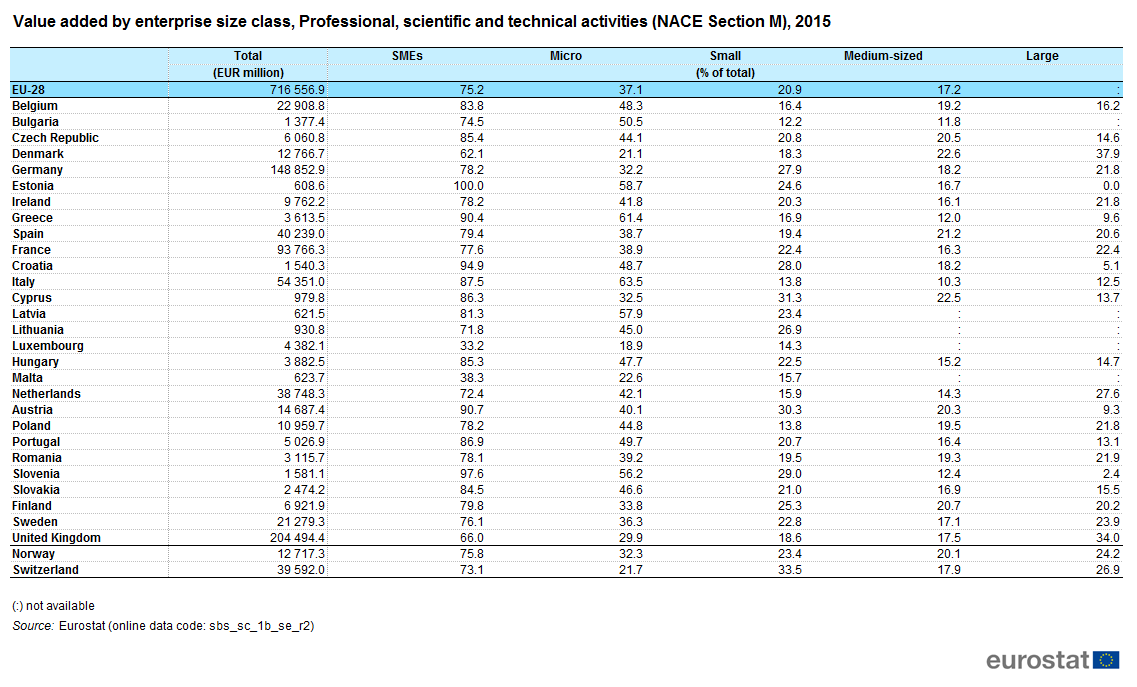
T6bValue added by enterprise size class, Professional, scientific and technical activities (NACE Section M), 2015.png
(
file
)
50 KB
1
13:40, 23 August 2018
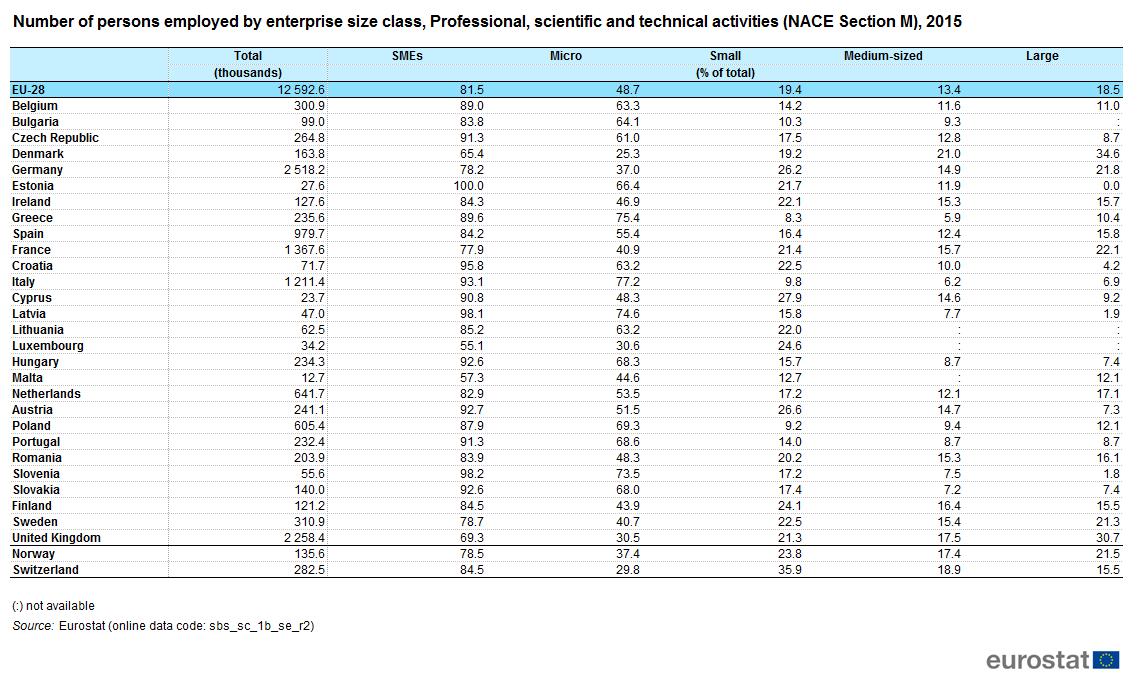
T6aNumber of persons employed by enterprise size class, Professional, scientific and technical activities (NACE Section M), 2015.png
(
file
)
49 KB
1
13:39, 23 August 2018
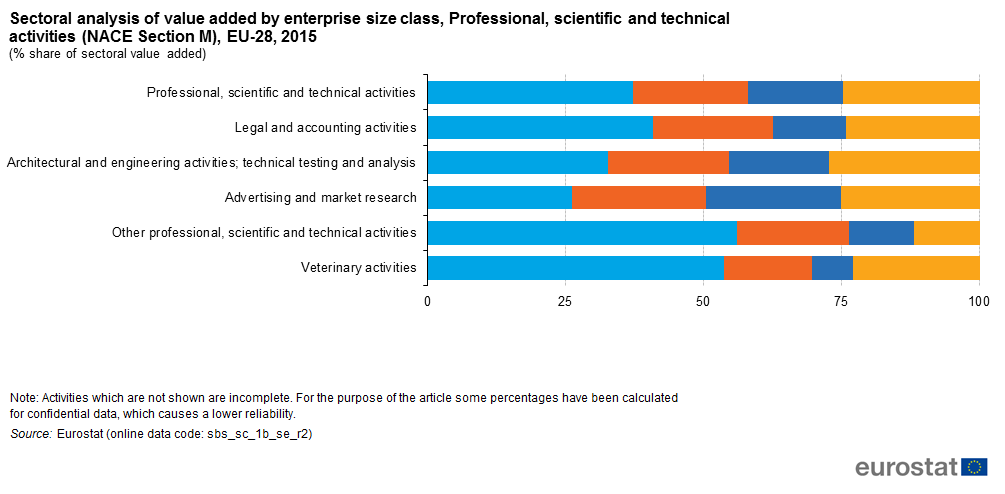
F6Sectoral analysis of value added by enterprise size class, Professional, scientific and technical activities (NACE Section M), EU-28, 2015.png
(
file
)
28 KB
1
13:39, 23 August 2018
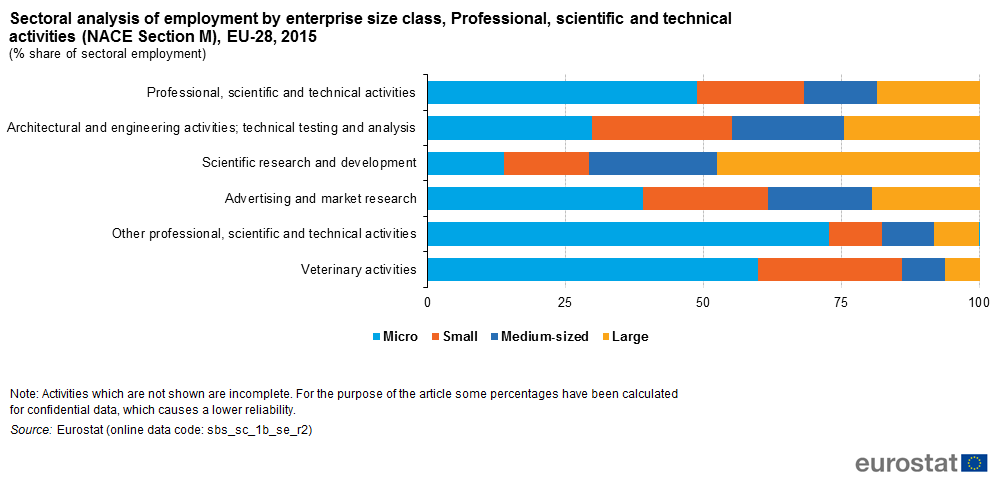
F5Sectoral analysis of employment by enterprise size class, Professional, scientific and technical activities (NACE Section M), EU-28, 2015.png
(
file
)
29 KB
1
13:38, 23 August 2018
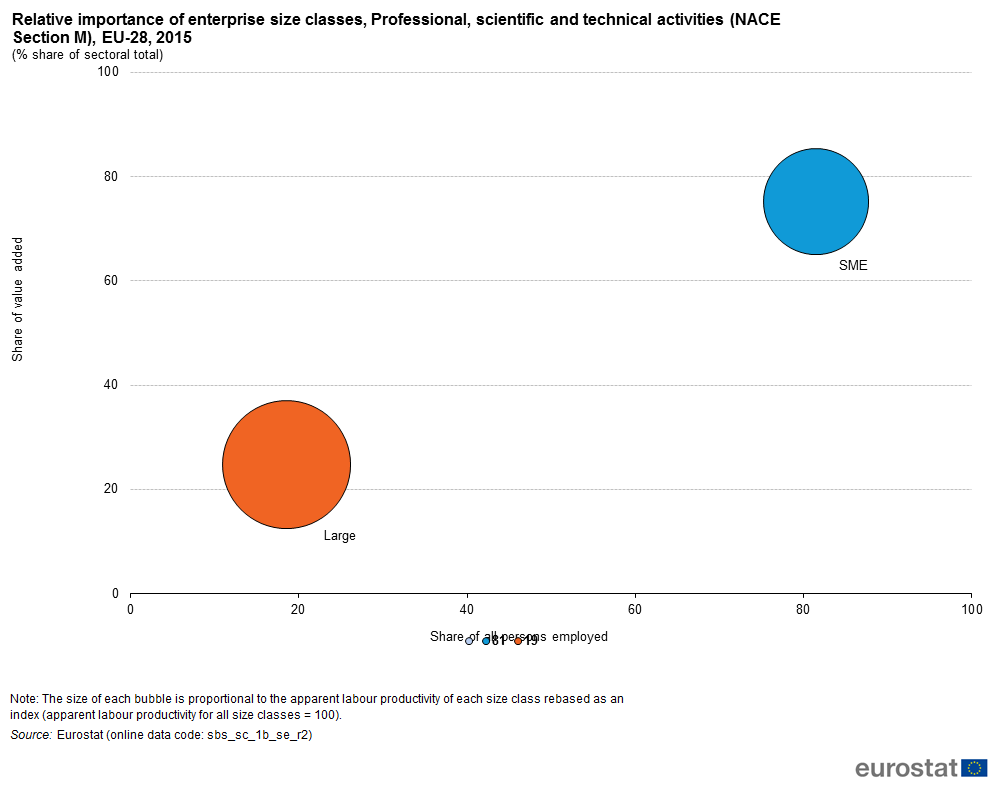
F4Relative importance of enterprise size classes, Professional, scientific and technical activities (NACE Section M), EU-28, 2015.png
(
file
)
29 KB
1
13:37, 23 August 2018
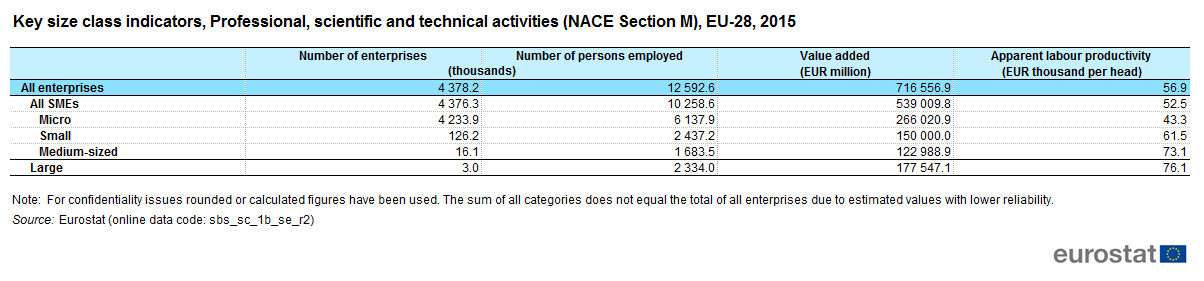
T5Key size class indicators, Professional, scientific and technical activities (NACE Section M), EU-28, 2015.png
(
file
)
25 KB
1
13:37, 23 August 2018
T4bKey indicators, Professional, scientific and technical activities (NACE Section M), 2015.png
(
file
)
48 KB
1
13:37, 23 August 2018
T4aKey indicators, Professional, scientific and technical activities (NACE Section M), 2015.png
(
file
)
60 KB
1
13:36, 23 August 2018
T3Largest and most specialised Member States in Professional, scientific and technical activities (NACE Section M), EU-28, 2015.png
(
file
)
35 KB
1
13:36, 23 August 2018
F3Concentration of value added and employment, Professional, scientific and technical activities (NACE Section M), 2015.png
(
file
)
29 KB
1
13:35, 23 August 2018
F2Relative importance of Professional, scientific and technical activities (NACE Section M), 2015.png
(
file
)
39 KB
1
First page
Previous page
Next page
Last page
Special page
ISSN 2443-8219

.png)
.png)
,_2015.png)
,_2015.png)
,_2015.png)
,_EU-28,_2015.png)
,_EU-28,_2015.png)
,_EU-28,_2015.png)
,_2015.png)
,_2015.png)
,_2015.png)
,_2015.png)
,_EU-28,_2015.png)
,_EU-28,_2015.png)
,_EU-28,_2015.png)
,_EU-28_and_Norway,_2015.png)
,_2015.png)
,_2015.png)
,_EU-28,_2015.png)
,_EU-28,_2015.png)
,_EU-28,_2015.png)
,_EU-28,_2015.png)
,_2015.png)
,_2015.png)
,_2015.png)

,_EU-28,_2015.png)
,_EU-28,_2015.png)
,_EU-28,_2015.png)
,_EU-28,_2015.png)
,_2015.png)
,_2015.png)
,_2015.png)
,_EU-28,_2015.png)
,_EU-28,_2015.png)
,_EU-28,_2015.png)
,_2015.png)
,_2015.png)
,_EU-28,_2015.png)
,_2015.png)
,_2015.png)
,_EU-28,_2015.png)
,_EU-28,_2015.png)
,_EU-28,_2015.png)
,_EU-28,_2015.png)
,_EU-28,_2015.png)
,_EU-28,_2015.png)
,_EU-28,_2015.png)
,_EU-28,_2015.png)