Tutorials
Log in
Statistics Explained
menu
search
search
Navigation
Main page
Statistical themes
Glossary
Categories
Statistics 4 beginners
Tutorials
Help
Eurostat home
Education corner
Online publications
Regional yearbook
Sustainable development
Full list
Tools
User contributions
Logs
View user groups
Special pages
search
Navigation
Main page
Statistical themes
Glossary
Categories
Statistics 4 beginners
Tutorials
Help
Eurostat home
Education corner
Online publications
Regional yearbook
Sustainable development
Full list
Tools
User contributions
Logs
View user groups
Special pages
Navigation
Main page
Statistical themes
Glossary
Categories
Statistics 4 beginners
Tutorials
Help
Eurostat home
Education corner
Online publications
Regional yearbook
Sustainable development
Full list
Tools
User contributions
Logs
View user groups
Special pages
Uploads by Schofja
This special page shows all uploaded files.
File list
Items per page:
20
50
100
250
500
Search for media name:
Username:
Include old versions of files
Go
First page
Previous page
Next page
Last page
Date
Name
Thumbnail
Size
Description
Versions
17:42, 3 July 2024
Figure 7.8 DEGURBA2021.png
(
file
)
124 KB
Reverted to version as of 17:25, 15 July 2022 (CEST)
3
20:33, 2 July 2024
Map 7.2 DEGURBA2024.png
(
file
)
404 KB
1
20:32, 2 July 2024
Map 7.1 DEGURBA2024.png
(
file
)
112 KB
1
20:28, 2 July 2024
Map 6.5 DEGURBA2024.png
(
file
)
1.11 MB
1
20:27, 2 July 2024
Map 6.4 DEGURBA2024.png
(
file
)
1.36 MB
1
20:26, 2 July 2024
Map 6.3 DEGURBA2024.png
(
file
)
132 KB
1
20:25, 2 July 2024
Map 6.2 DEGURBA2024.png
(
file
)
89 KB
1
20:24, 2 July 2024
Map 6.1 DEGURBA2024.png
(
file
)
155 KB
1
20:23, 2 July 2024
Figure 6.10 DEGURBA2024.png
(
file
)
415 KB
1
20:22, 2 July 2024
Figure 6.9 DEGURBA2024.png
(
file
)
83 KB
1
20:11, 2 July 2024
Figure 7.11 DEGURBA2024.png
(
file
)
131 KB
1
20:10, 2 July 2024
Figure 7.10 DEGURBA2024.png
(
file
)
124 KB
1
20:09, 2 July 2024
Figure 7.9 DEGURBA2024.png
(
file
)
96 KB
1
20:08, 2 July 2024
Figure 7.8 DEGURBA2024.png
(
file
)
113 KB
1
20:07, 2 July 2024
Figure 7.7 DEGURBA2024.png
(
file
)
214 KB
1
20:06, 2 July 2024
Figure 7.6 DEGURBA2024.png
(
file
)
143 KB
1
20:05, 2 July 2024
Figure 7.5 DEGURBA2024.png
(
file
)
152 KB
1
20:03, 2 July 2024
Figure 7.4 DEGURBA2024.png
(
file
)
120 KB
1
20:02, 2 July 2024
Figure 7.3 DEGURBA2024.png
(
file
)
154 KB
1
20:01, 2 July 2024
Figure 7.2 DEGURBA2024.png
(
file
)
91 KB
1
19:56, 2 July 2024
Figure 7.1 DEGURBA2024.png
(
file
)
81 KB
1
16:33, 23 February 2023
Table 7.2 DEGURBA2021.png
(
file
)
16 KB
2
18:27, 10 November 2022
PAG source data for map and graphs.xlsx
(
file
)
28.53 MB
2
18:26, 10 November 2022
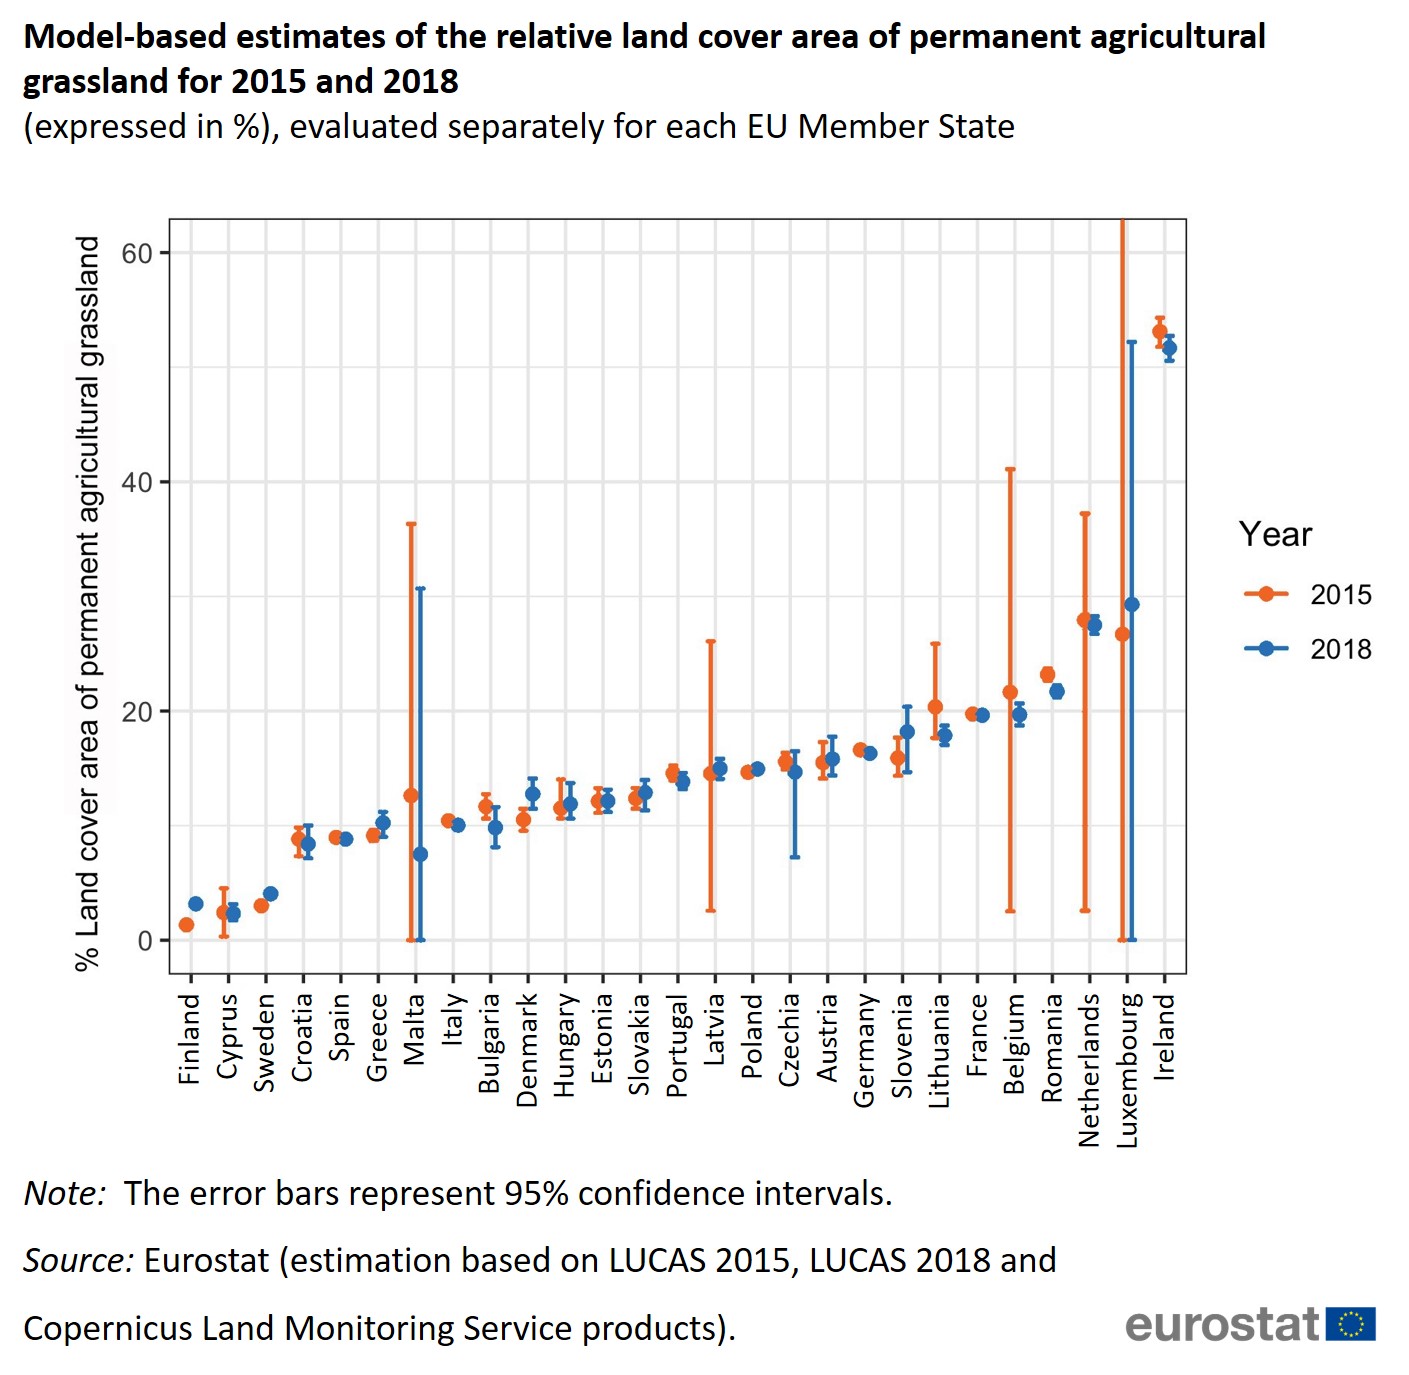
Figure 2 - Relative LCA of PAG.jpg
(
file
)
278 KB
2
18:26, 10 November 2022
Figure 1 - Total PAG.jpg
(
file
)
281 KB
2
15:37, 24 October 2022
Map 1 - Probability of permanent agricultural grassland - 2018.png
(
file
)
3.74 MB
1
15:32, 24 October 2022
Map 1 - Probability of permanent agricultural grassland - 2018.pdf
(
file
)
4.01 MB
1
13:31, 26 April 2021
Unemployment in the regions of the EU EFTA and CC 2020.xlsx
(
file
)
39 KB
1
13:06, 26 April 2021
Regions with lowest and highest youth unemployment rates in 2020, %.png
(
file
)
35 KB
1
12:51, 26 April 2021
Regions with lowest and highest long-term unemployment shares in 2020, %.png
(
file
)
35 KB
1
12:44, 26 April 2021
Regions with highest decrease and increase in youth unemployment rates between 2019 and 2020, in percentage points.png
(
file
)
37 KB
1
12:12, 26 April 2021
Map for SE Youth unemployment rate 2020.png
(
file
)
347 KB
1
12:06, 26 April 2021
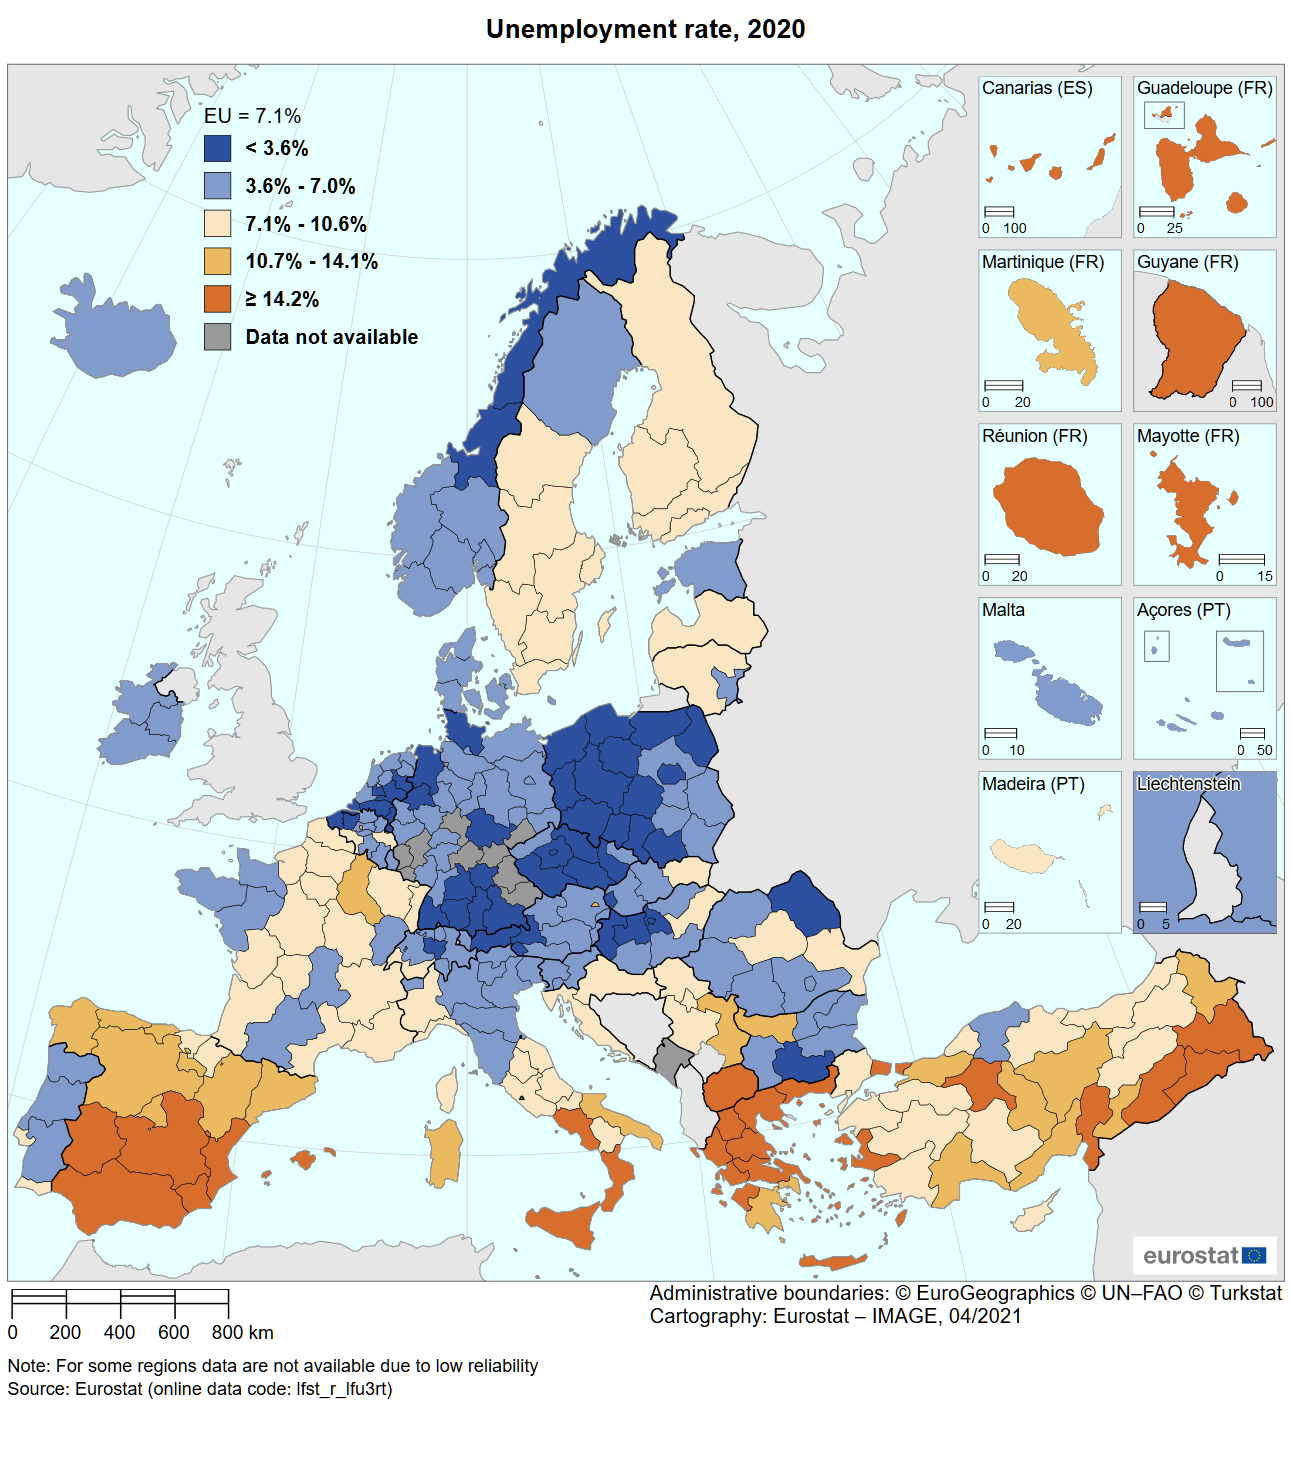
Map for SE Unemployment rate 2020.png
(
file
)
348 KB
1
16:59, 15 July 2020
Ch8-art-2571027 1920.jpg
(
file
)
791 KB
1
16:47, 15 July 2020
Ch8-art-2571027 960 720.jpg
(
file
)
190 KB
1
16:38, 27 May 2020
Ch9-Tbl1-tourism.png
(
file
)
15 KB
1
16:37, 27 May 2020
Ch9-village-4158038 1920.jpg
(
file
)
1.09 MB
1
16:12, 27 May 2020
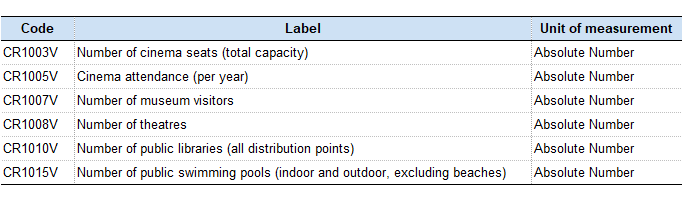
Table 1 - Cultural facilities and cultural participation in cities.png
(
file
)
11 KB
1
16:11, 27 May 2020
Ch8-books-1655783 1920.jpg
(
file
)
924 KB
1
15:34, 27 May 2020
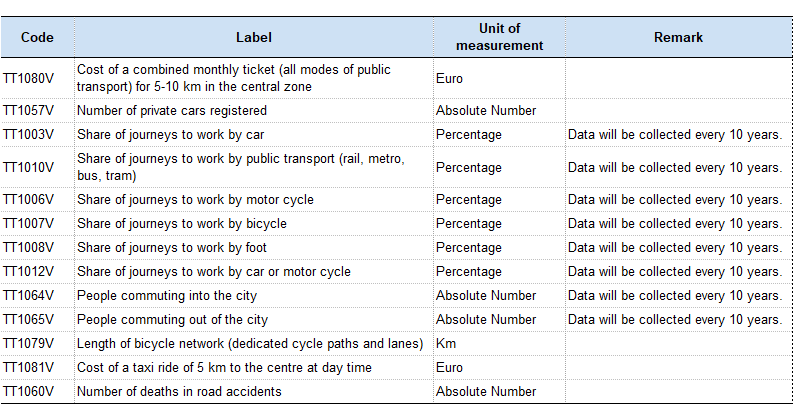
Table 1 Transport and travel patterns in cities.png
(
file
)
29 KB
1
15:32, 27 May 2020
Ch7-mtrain-936081 1920.jpg
(
file
)
647 KB
1
15:16, 27 May 2020
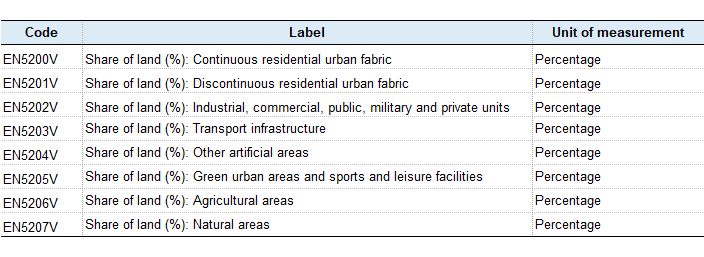
Table 3 - Land Use.png
(
file
)
15 KB
1
15:15, 27 May 2020
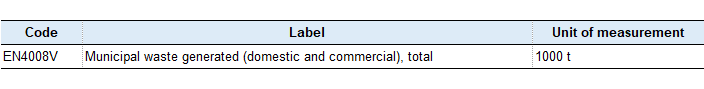
Table 2 - Waste.png
(
file
)
3 KB
2
15:14, 27 May 2020
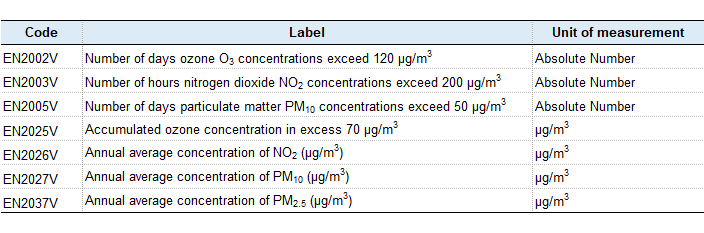
Table 1 - Air Quality.png
(
file
)
14 KB
2
20:43, 25 May 2020
Ch6-forest-1245951 1920.jpg
(
file
)
1.72 MB
1
18:01, 25 May 2020
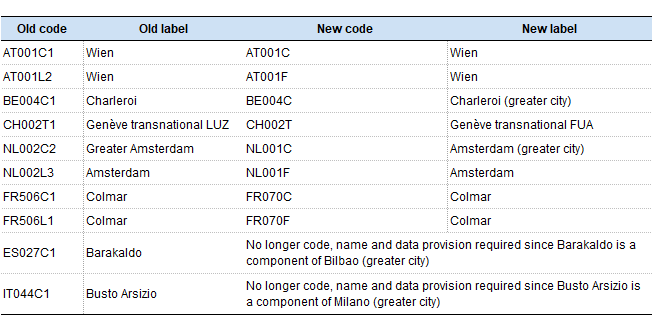
Table 1 Examples of new and old codes in the classification.png
(
file
)
14 KB
1
19:59, 26 November 2019
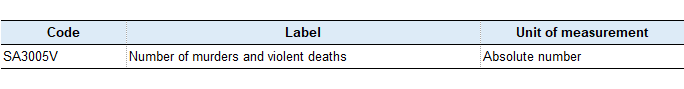
Table 3 - Crime.png
(
file
)
3 KB
1
19:57, 26 November 2019
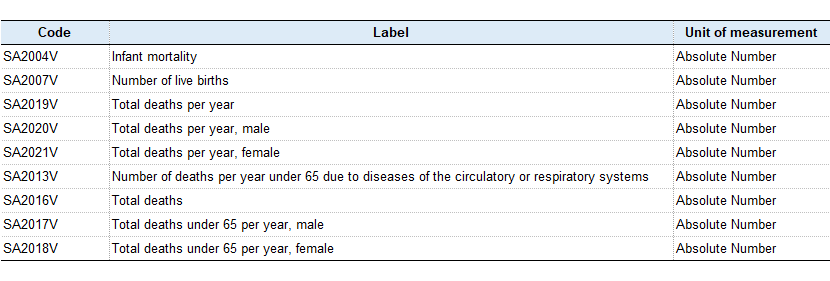
Table 2 - Health.png
(
file
)
15 KB
2
19:34, 26 November 2019
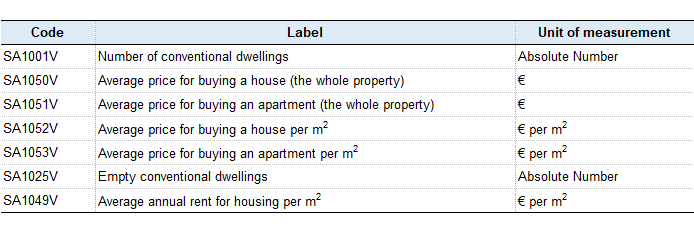
Table 1 - Housing.png
(
file
)
12 KB
1
19:28, 26 November 2019
Ch3 house-22527 1920.jpg
(
file
)
766 KB
1
First page
Previous page
Next page
Last page
Special page
ISSN 2443-8219


