Uploads by Pleytjo
This special page shows all uploaded files.
| Date | Name | Thumbnail | Size | Description | Versions |
|---|---|---|---|---|---|
| 18:11, 13 March 2017 | Figure 1.The use of SO and SGM coefficients in Farm Structure Surveys in the period 1990-2016.png (file) |  |
98 KB | 4 | |
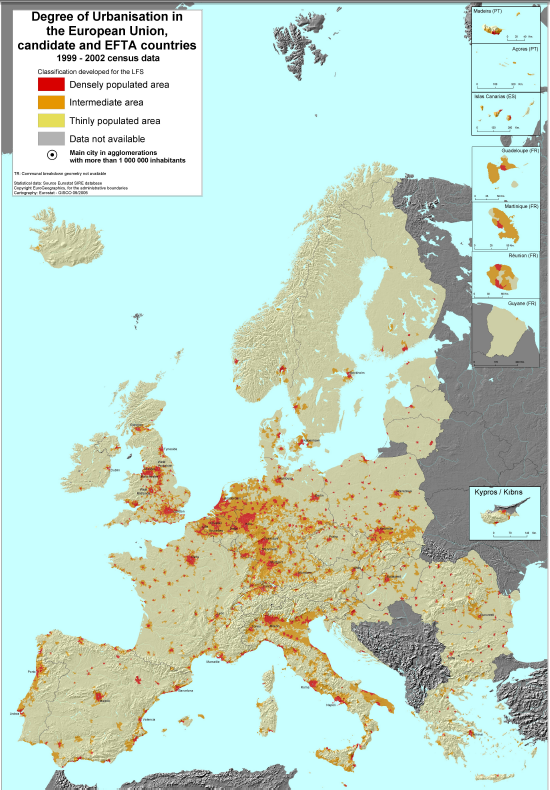
| 18:51, 6 December 2011 | Degree of Urbanisation in the European Union.png (file) |  |
414 KB | 1 | |
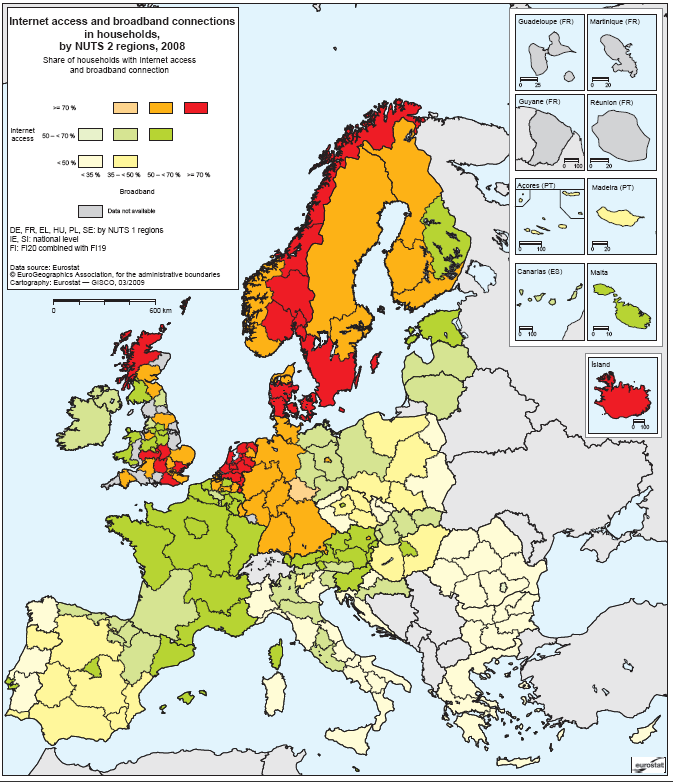
| 18:45, 6 December 2011 | Internet access and broadband connections in households by NUTS2 regions in 2008.png (file) |  |
143 KB | 1 | |
| 18:44, 6 December 2011 | The NUTS classification in the European Union.png (file) |  |
170 KB | 1 | |
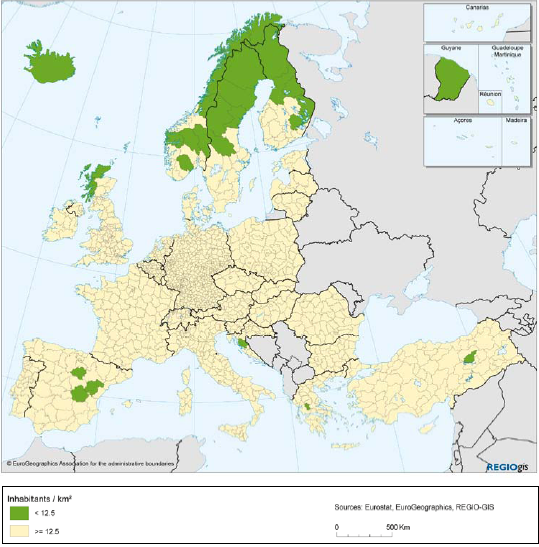
| 12:42, 26 October 2011 | Sparsely populated regions.png (file) |  |
324 KB | Sparsely populated NUTS3 regions | 1 |
| 12:37, 26 October 2011 | Typology mountain regions NUTS3.png (file) |  |
327 KB | Typology of mountain regions at NUTS3 level | 1 |
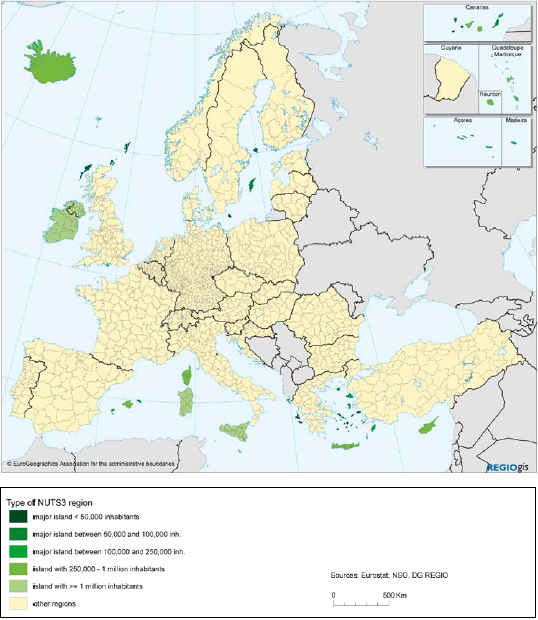
| 12:37, 26 October 2011 | Typology island regions.png (file) |  |
327 KB | Typology of island regions | 1 |
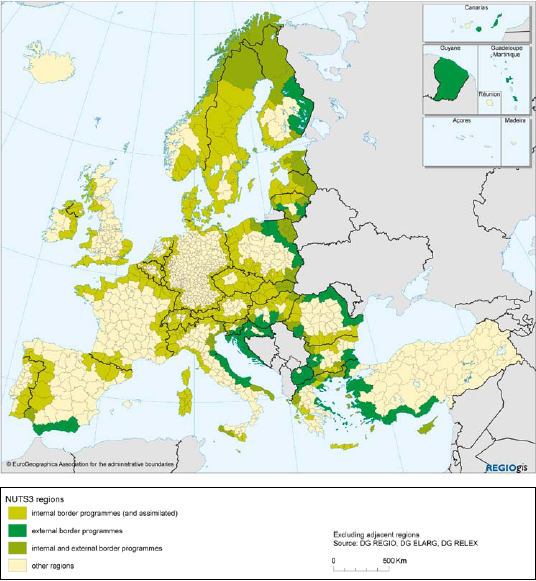
| 12:22, 26 October 2011 | Crossborder cooperation programme areas.png (file) |  |
353 KB | Cross-border cooperation programme areas (ERDF, IPA and ENPI), 2007-2013 | 1 |
| 11:56, 26 October 2011 | Typology of metro regions.PNG (file) |  |
338 KB | map 2 Typology of metro regions | 1 |
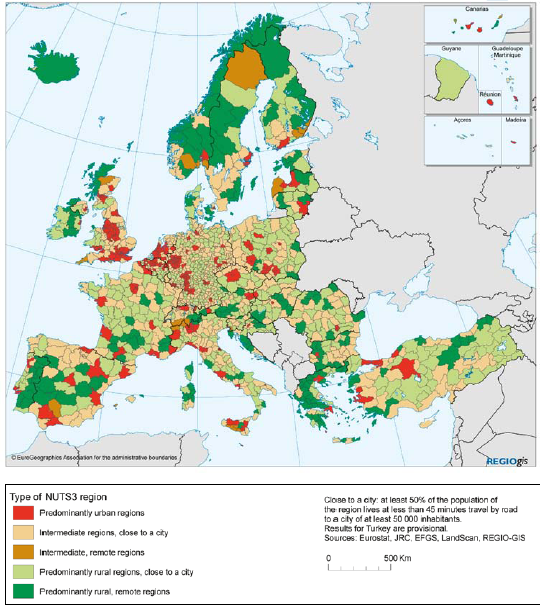
| 11:46, 26 October 2011 | Urban-rural typology of NUTS3 regions including remoteness.PNG (file) |  |
390 KB | Map 1: Urban-rural typology of NUTS3 regions including remoteness | 1 |