Tutorials
Log in
Statistics Explained
menu
search
search
Navigation
Main page
Statistical themes
Glossary
Categories
Statistics 4 beginners
Tutorials
Help
Eurostat home
Education corner
Online publications
Regional yearbook
Sustainable development
Full list
Tools
User contributions
Logs
View user groups
Special pages
search
Navigation
Main page
Statistical themes
Glossary
Categories
Statistics 4 beginners
Tutorials
Help
Eurostat home
Education corner
Online publications
Regional yearbook
Sustainable development
Full list
Tools
User contributions
Logs
View user groups
Special pages
Navigation
Main page
Statistical themes
Glossary
Categories
Statistics 4 beginners
Tutorials
Help
Eurostat home
Education corner
Online publications
Regional yearbook
Sustainable development
Full list
Tools
User contributions
Logs
View user groups
Special pages
Uploads by Pavlosv
This special page shows all uploaded files.
File list
Items per page:
20
50
100
250
500
Search for media name:
Username:
Include old versions of files
Go
First page
Previous page
Next page
Last page
Date
Name
Thumbnail
Size
Description
Versions
17:32, 8 March 2023
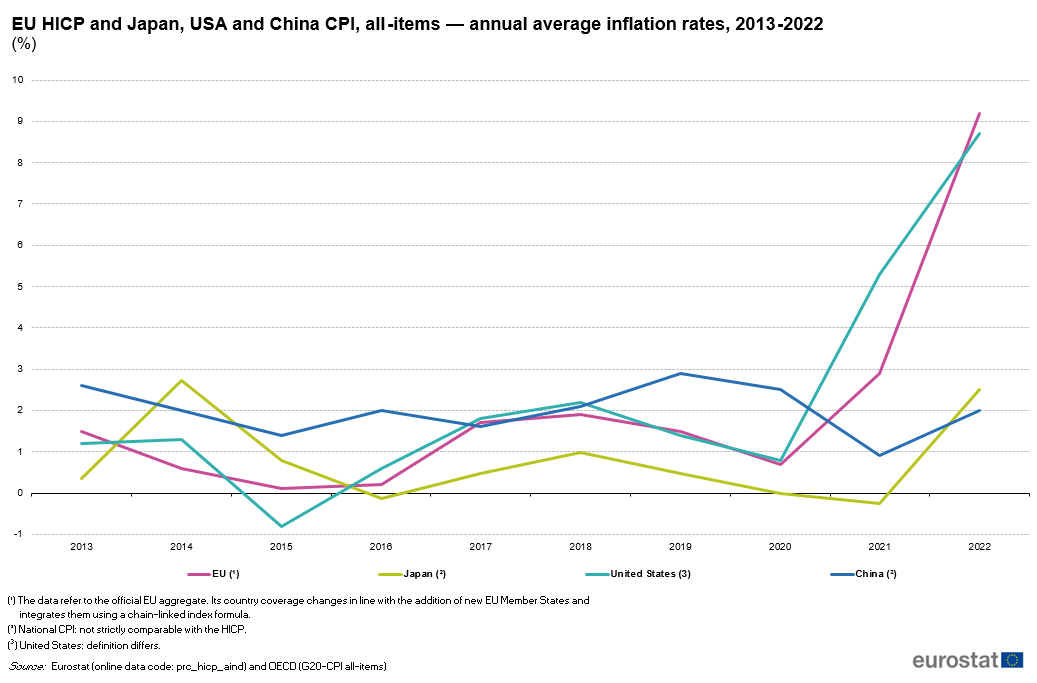
EU HICP and Japan, USA and China CPI - annual average all-items inflation rates, 2013-2022(%).png
(
file
)
38 KB
1
20:57, 26 February 2021
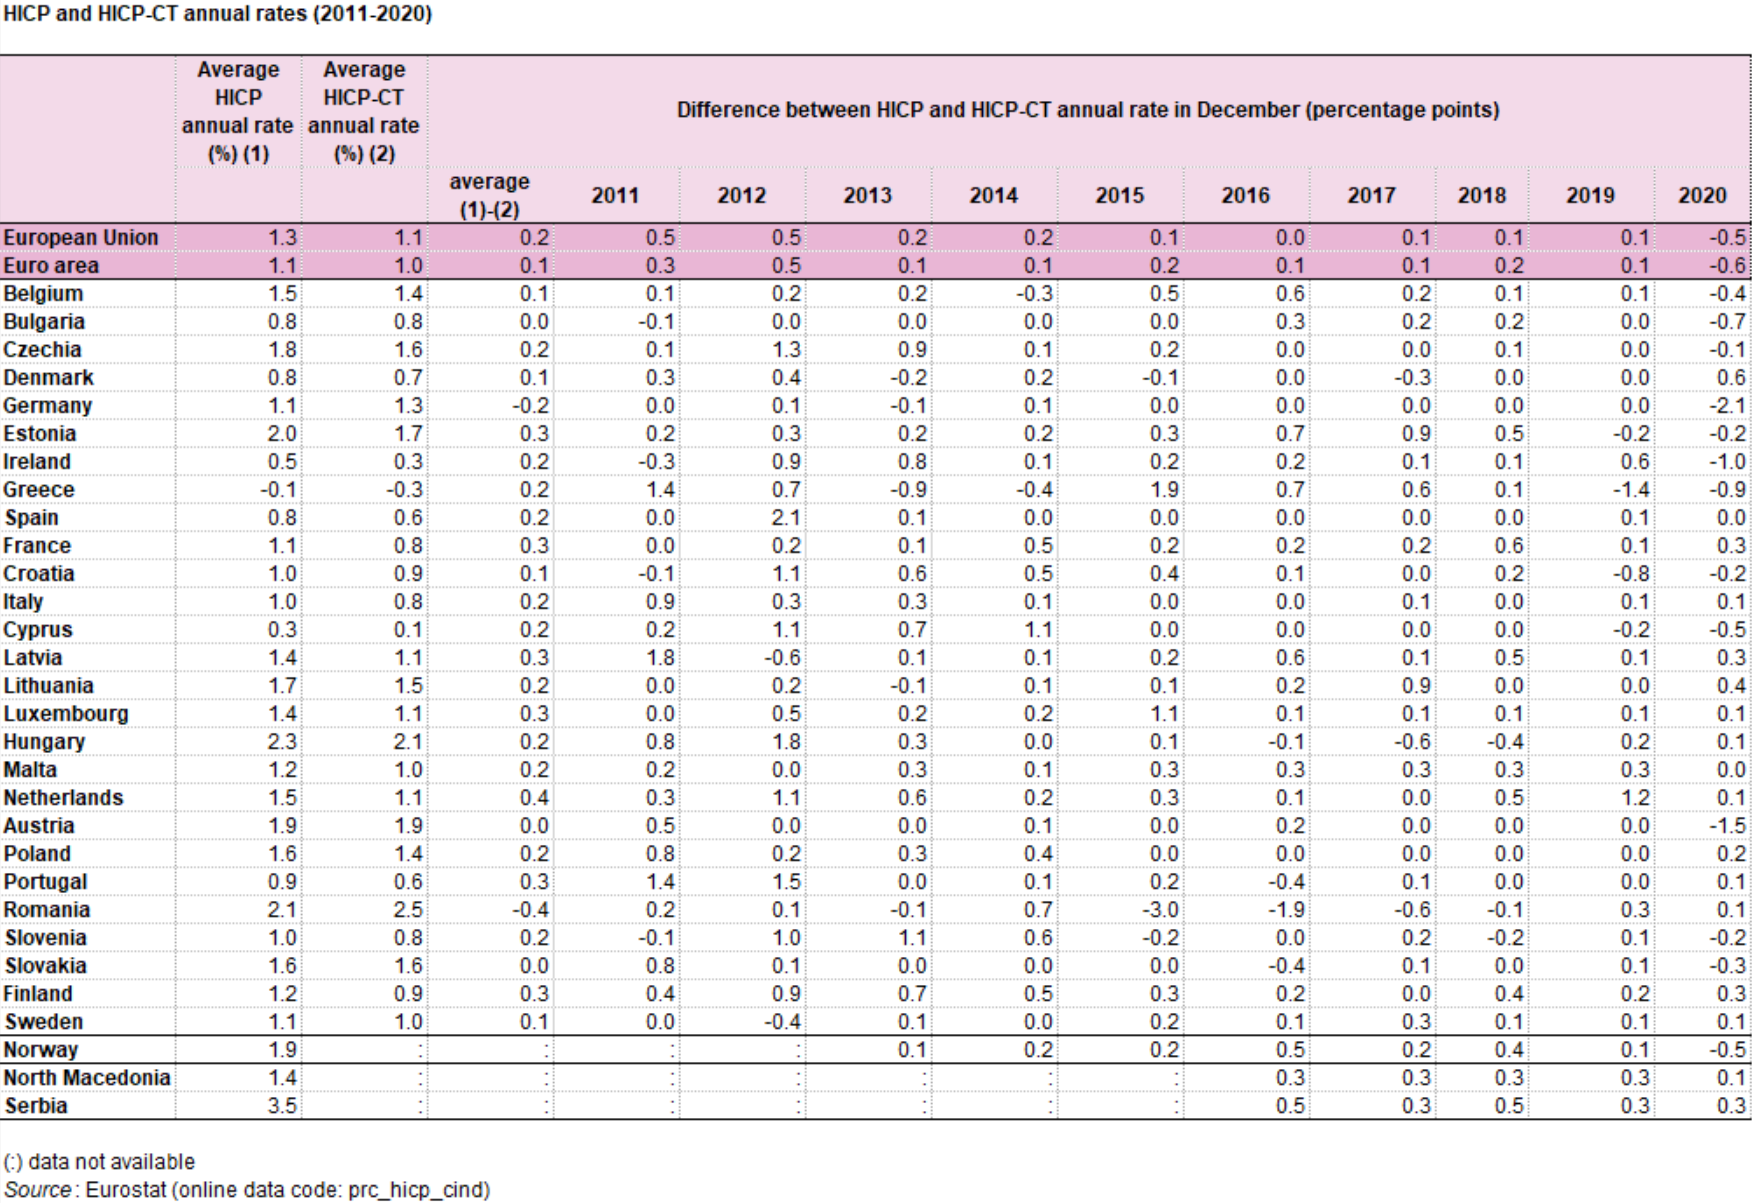
HICP and HICP-CT annual rates (2011-2020).png
(
file
)
782 KB
1
20:56, 26 February 2021
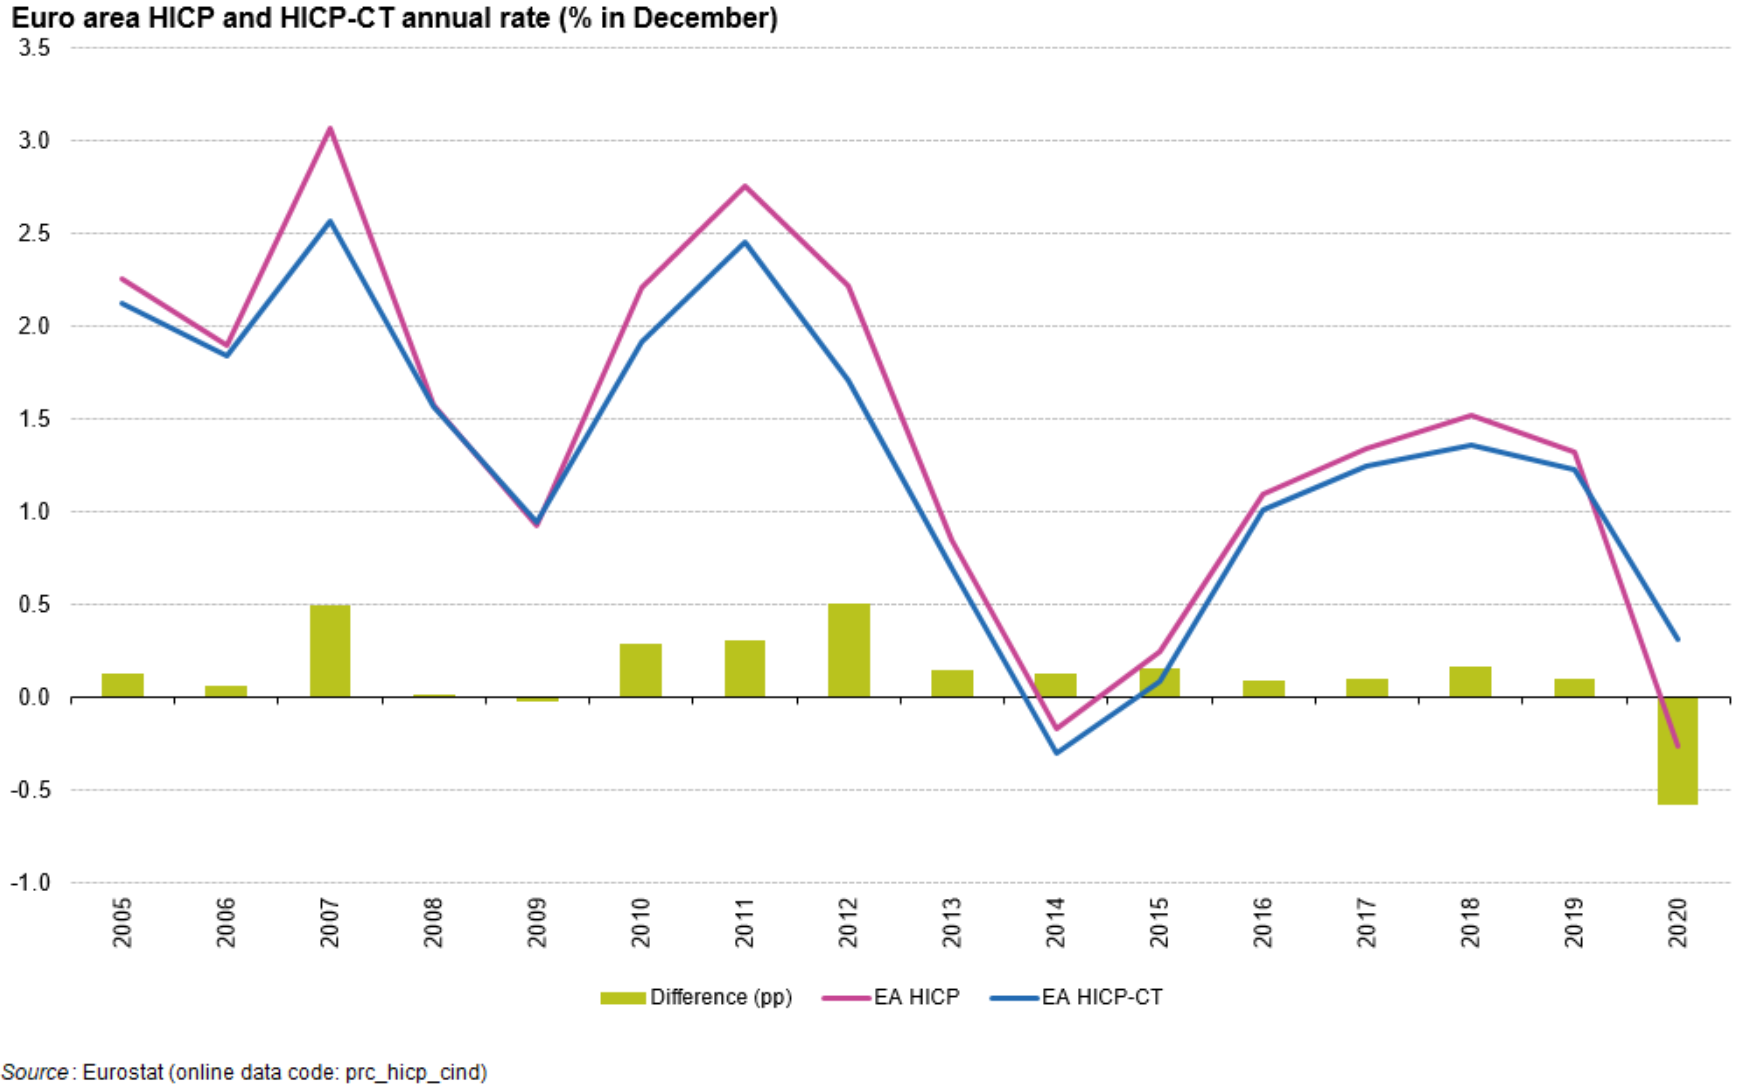
Euro area HICP and HICP-CT annual rate (% in December) 2020.png
(
file
)
236 KB
1
19:30, 8 October 2020
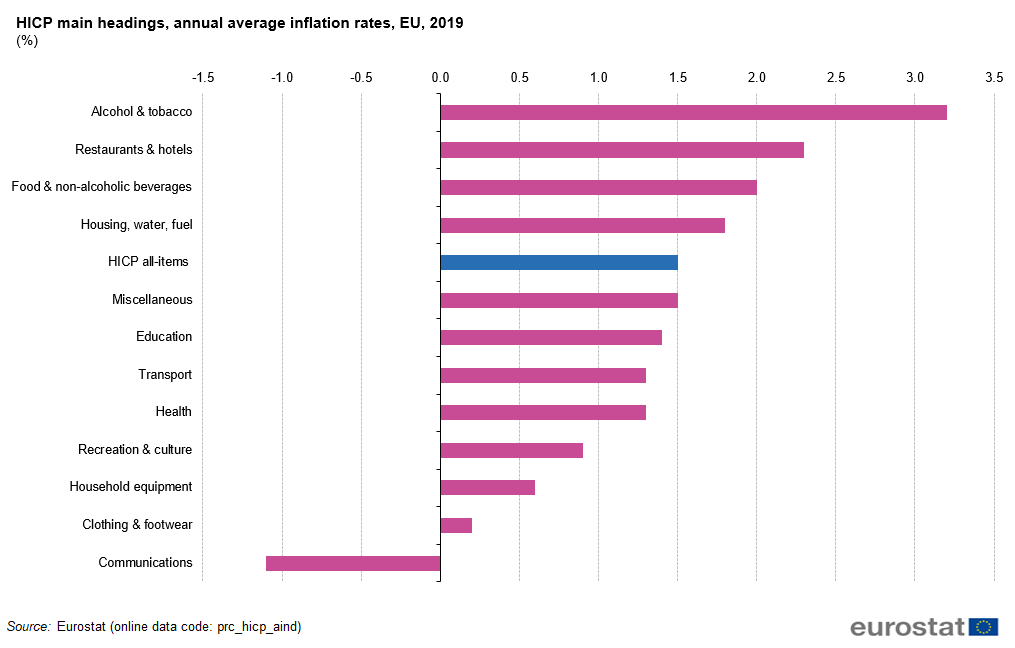
HICP main headings, annual average inflation rates, EU, 2019.png
(
file
)
22 KB
1
19:04, 8 October 2020
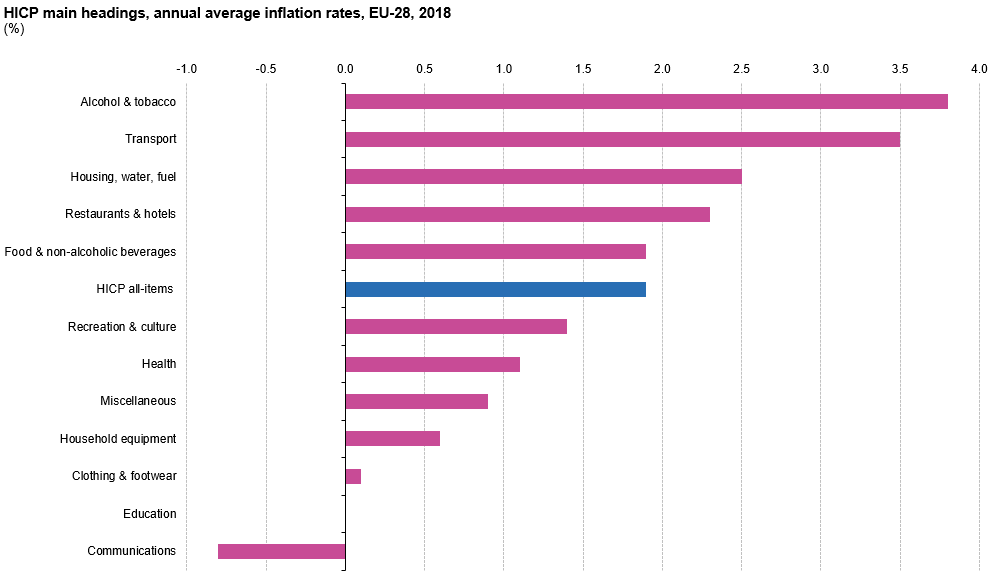
HICP main headings, annual average inflation rates, EU-28, 2019.png
(
file
)
22 KB
3
19:00, 8 October 2020
HICP all-items, development of the annual average inflation rates, 2009-2019.png
(
file
)
45 KB
2
12:20, 17 January 2020
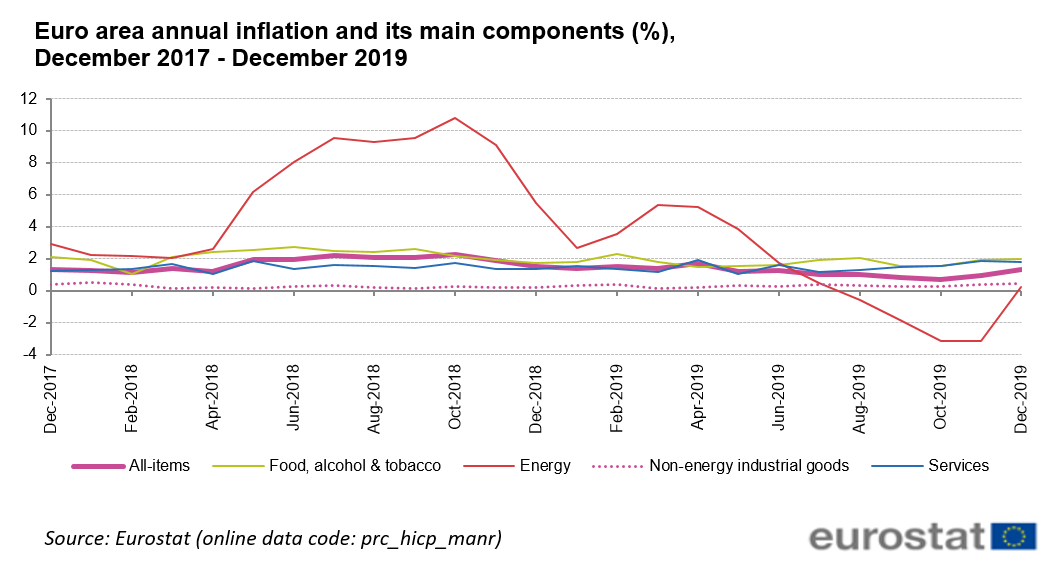
Euro area annual inflation and its main components (%), December 2017 - December 2019.png
(
file
)
48 KB
1
12:20, 17 January 2020
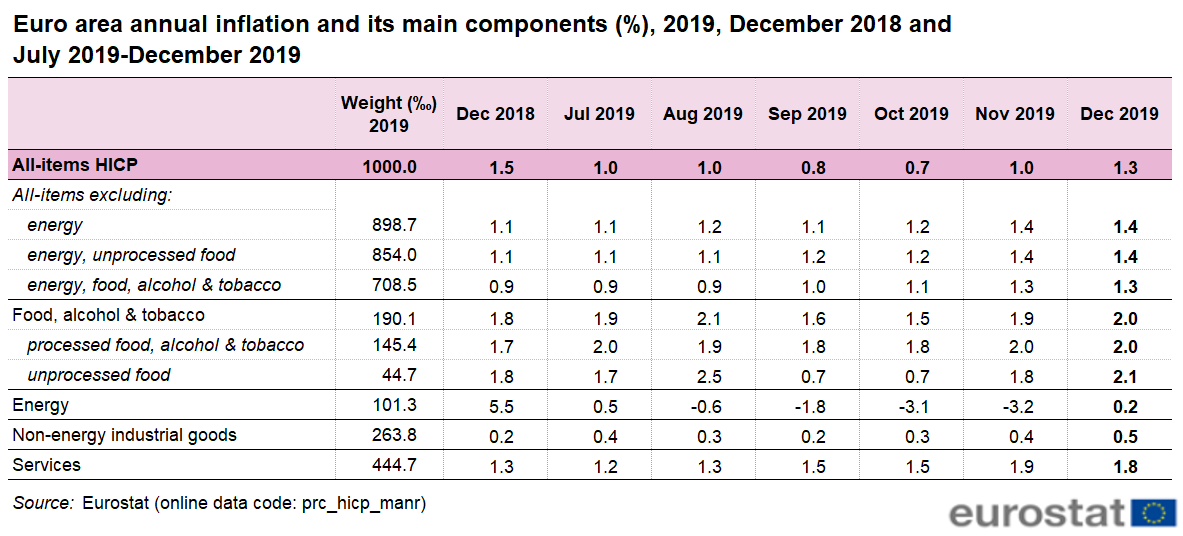
Euro area annual inflation and its main components (%), 2019, December 2018 and July 2019-December 2019.png
(
file
)
38 KB
1
12:20, 17 January 2020
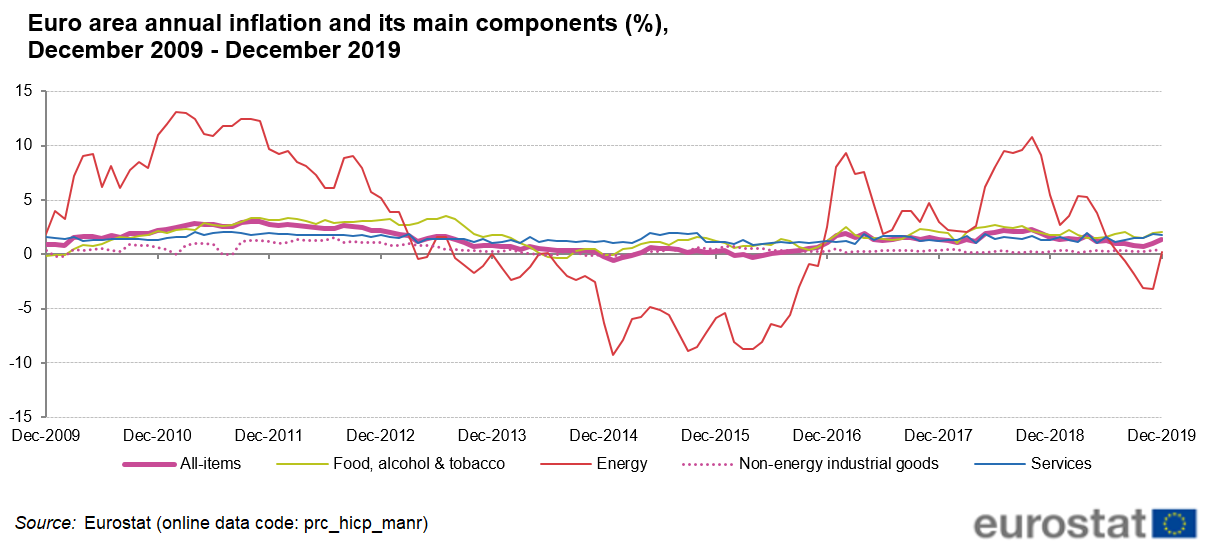
Euro area annual inflation and its main components (%), December 2009 - December 2019.png
(
file
)
54 KB
1
12:57, 3 October 2019
Consumer prices - inflation FP2019.xlsx
(
file
)
34 KB
1
15:40, 1 October 2019
HICP main headings, annual average inflation rates, EU-28, 2018 (%) FP19.png
(
file
)
25 KB
1
14:34, 1 October 2019
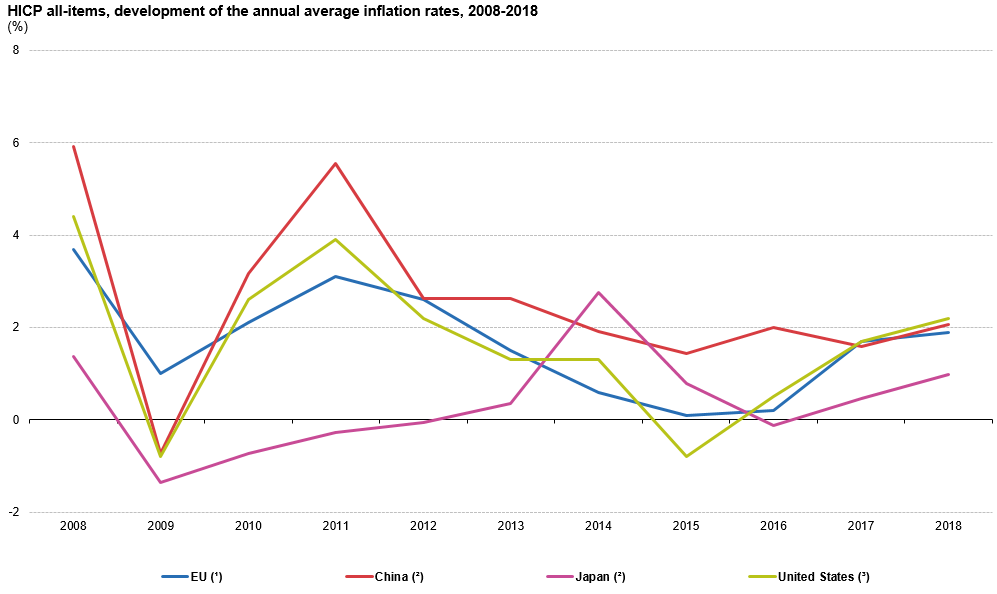
HICP all-items, development of the annual average inflation rates, 2008-2018 (%) FP19.png
(
file
)
44 KB
1
14:05, 1 October 2019
HICP all-items, development of the annual average inflation rates, 2008-2018 (%) FP18.png
(
file
)
44 KB
2
11:08, 17 July 2019
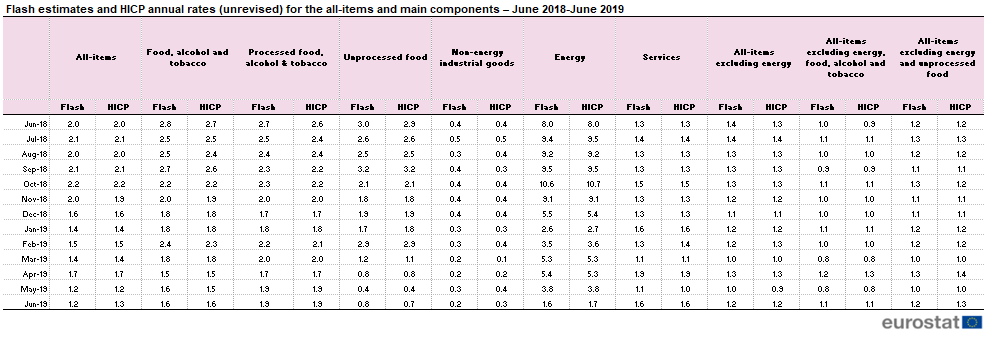
Flash estimates and HICP annual rates for the all-items and main components – June 2018-June 2019 (unrevised).png
(
file
)
21 KB
3
11:03, 17 July 2019
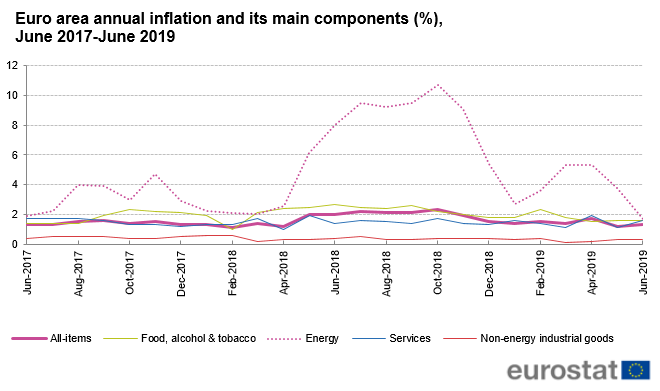
Euro area annual inflation and its main components (%), June 2017-June 2019.png
(
file
)
28 KB
1
11:03, 17 July 2019
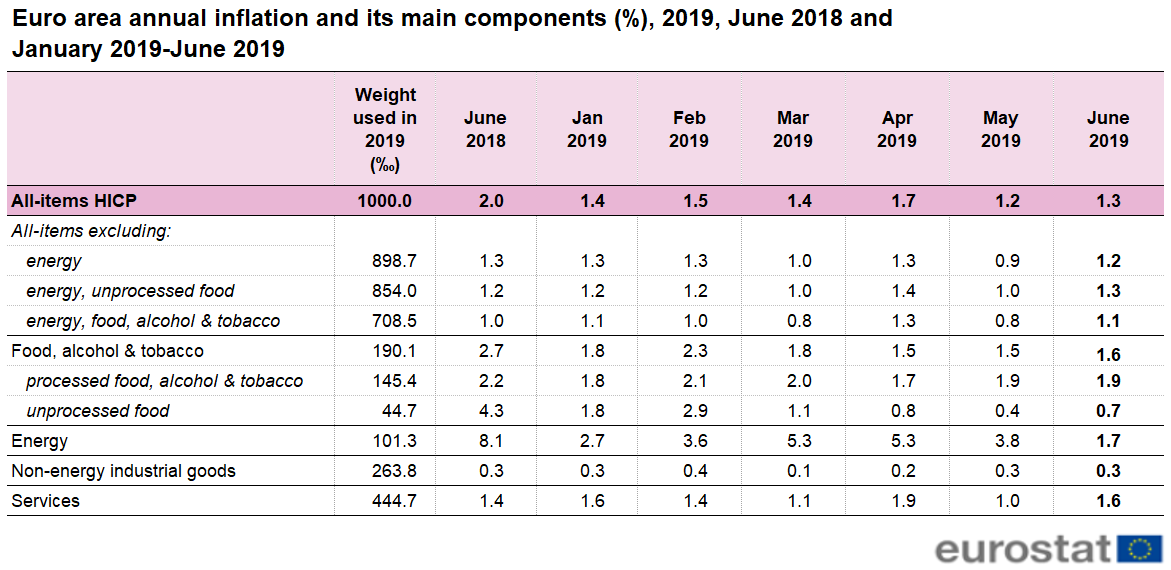
Euro area annual inflation and its main components (%), 2019, June 2018 and January 2019-June 2019.png
(
file
)
37 KB
1
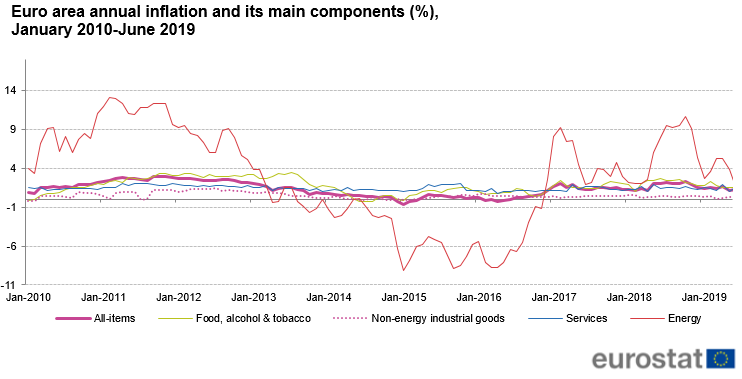
11:01, 17 July 2019
Euro area annual inflation and its main components (%), January 2010-June 2019.png
(
file
)
31 KB
1
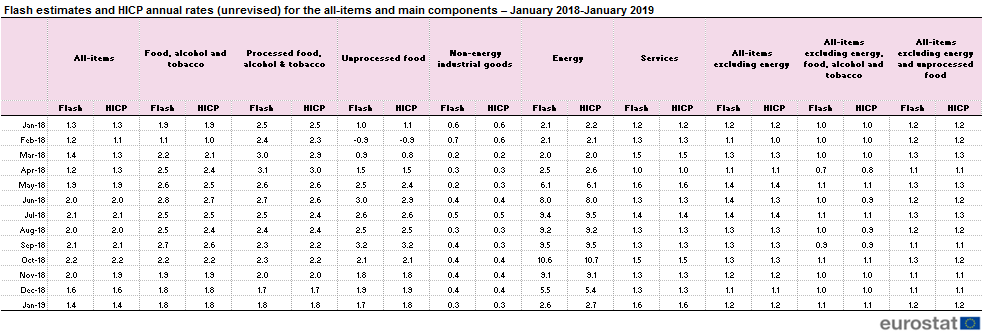
13:46, 22 February 2019
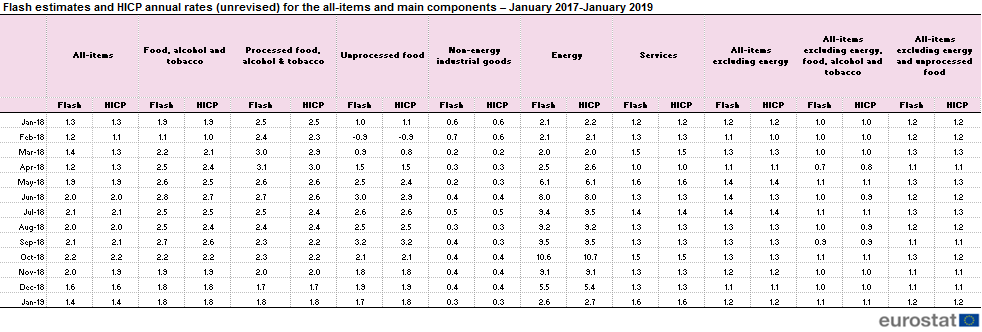
Flash estimates and HICP annual rates for the all-items and main components – January 2018-January 2019 (unrevised).png
(
file
)
21 KB
2
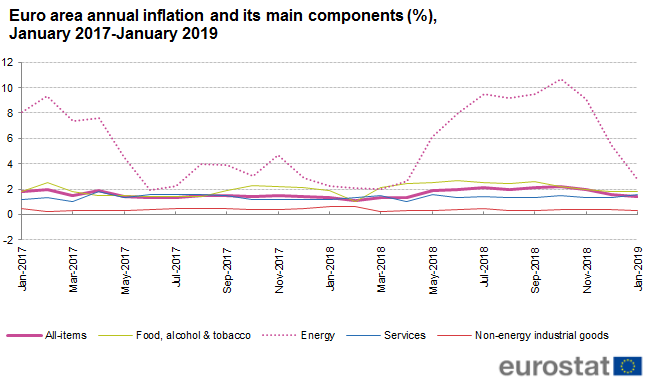
13:42, 22 February 2019
Euro area annual inflation and its main components (%), January 2017-January 2019.png
(
file
)
22 KB
1
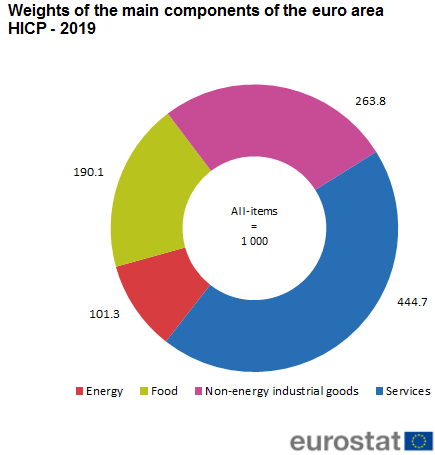
13:35, 22 February 2019
Weights of the main components of the euro area HICP - 2019.png
(
file
)
17 KB
3
13:13, 22 February 2019
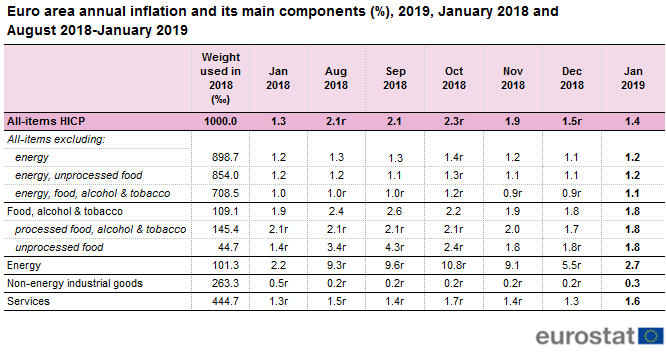
Euro area annual inflation and its main components (%), 2019, January 2018 and August 2018-January 2019.png
(
file
)
24 KB
1
13:13, 22 February 2019
Euro area annual inflation and its main components (%), January 2009-January 2019.png
(
file
)
26 KB
1
13:04, 22 February 2019
Flash estimates and HICP annual rates (unrevised) for the all-items and main components – December 2017-December 2018 (unrevised).png
(
file
)
21 KB
2
13:04, 22 February 2019
Euro area annual inflation and its main components (%), December 2016-December 2018.png
(
file
)
21 KB
2
13:02, 22 February 2019
Euro area annual inflation and its main components (%), January 2008-December 2018.png
(
file
)
21 KB
2
13:00, 22 February 2019
Euro area annual inflation and its main components (%), 2018, December 2017 and July-December 2018.png
(
file
)
24 KB
2
13:49, 17 December 2018
Euro area annual inflation and its main components (%), January 2008-November 2018.png
(
file
)
34 KB
Reverted to version as of 11:38, 17 December 2018
4
13:45, 17 December 2018
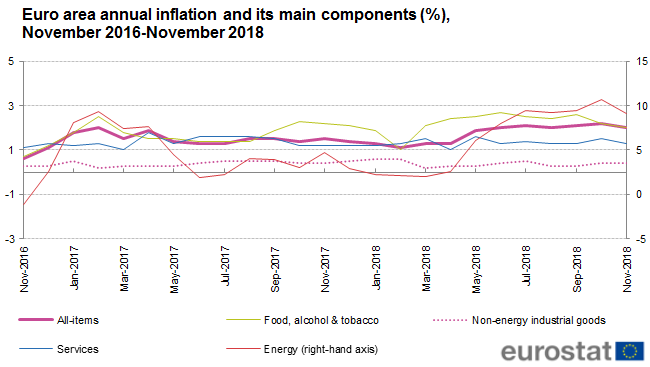
Euro area annual inflation and its main components (%), November 2016-November 2018.png
(
file
)
24 KB
2
10:52, 31 July 2018
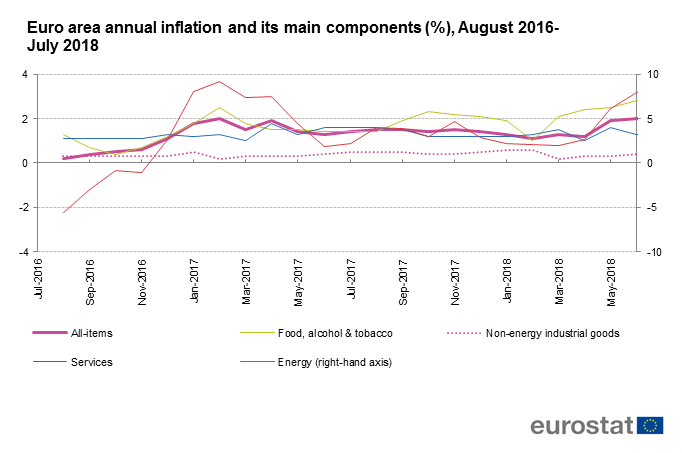
Euro area annual inflation and its main components (%), August 2016-July 2018 (estimated).png
(
file
)
24 KB
1
10:51, 31 July 2018
Euro area annual inflation and its main components (%), 2018, July 2017 and February-July 2018 (estimated).png
(
file
)
26 KB
1
10:50, 31 July 2018
Euro area annual inflation and its main components (%), January 2008-July 2018 (estimated).png
(
file
)
34 KB
1
12:05, 18 July 2018
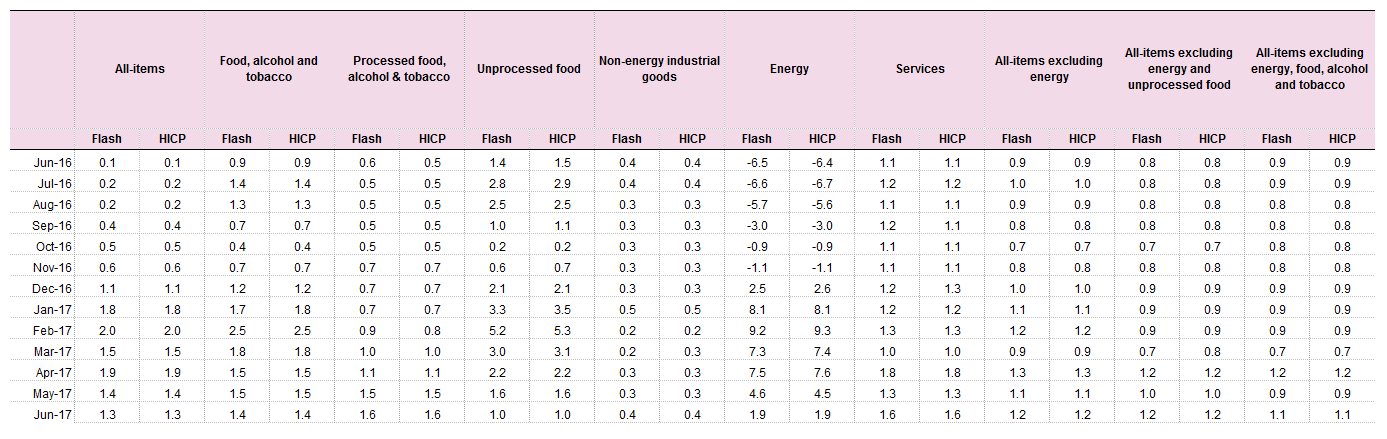
Flash estimates and HICP annual rates for the all-items and main components – June 2017-June 2018 (unrevised).png
(
file
)
43 KB
1
12:03, 18 July 2018
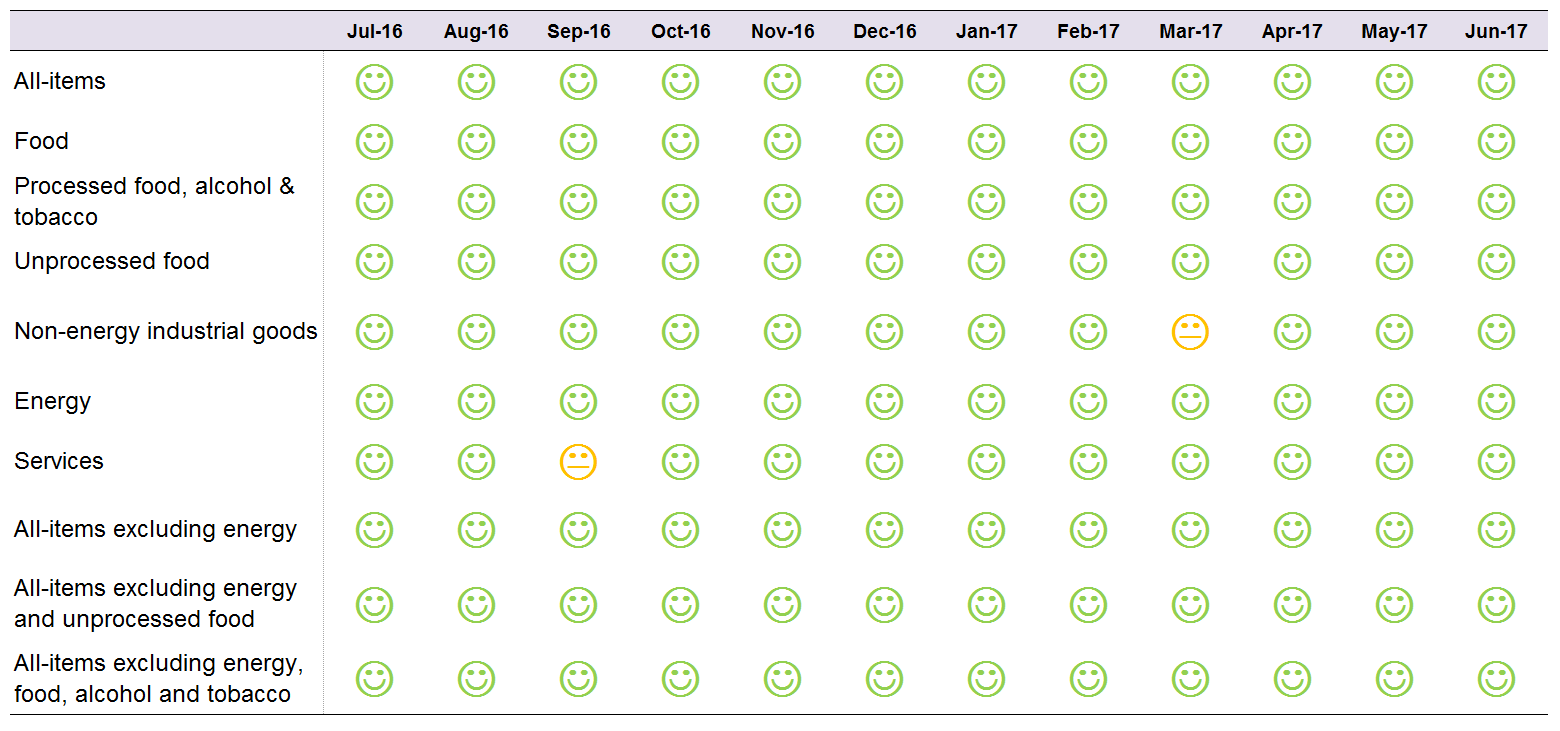
Inflation's direction analysis – July 2017-June 2018.png
(
file
)
48 KB
1
12:02, 18 July 2018
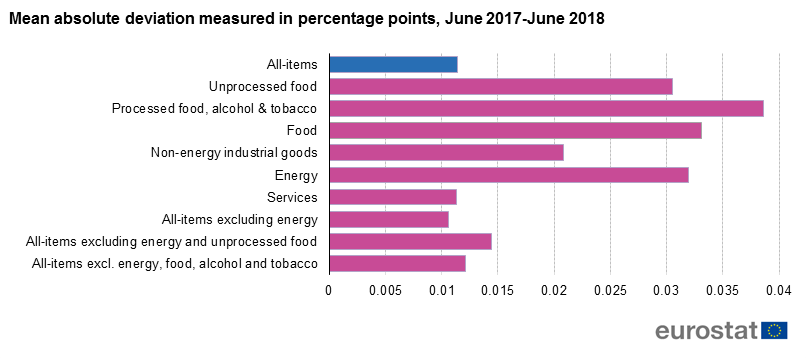
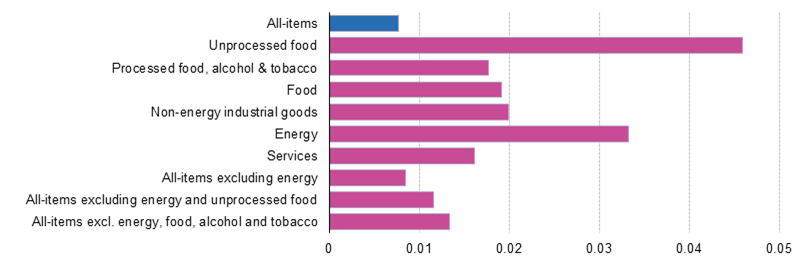
Mean absolute deviation measured in percentage points, June 2017-June 2018.png
(
file
)
19 KB
1
11:41, 18 July 2018
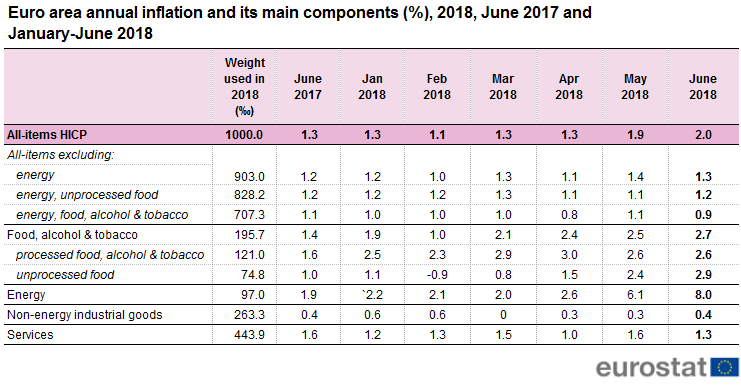
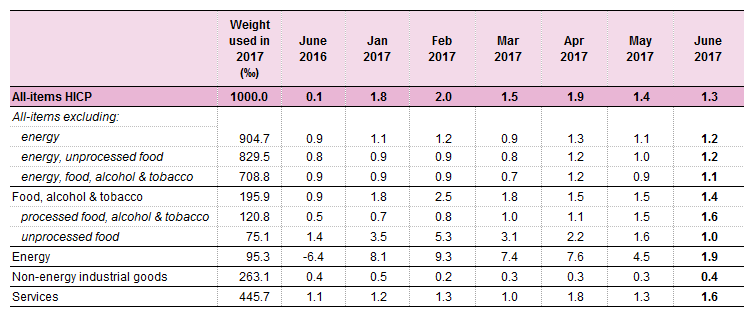
Euro area annual inflation and its main components (%), 2018, June 2017 and January-June 2018.png
(
file
)
34 KB
4
11:35, 18 July 2018
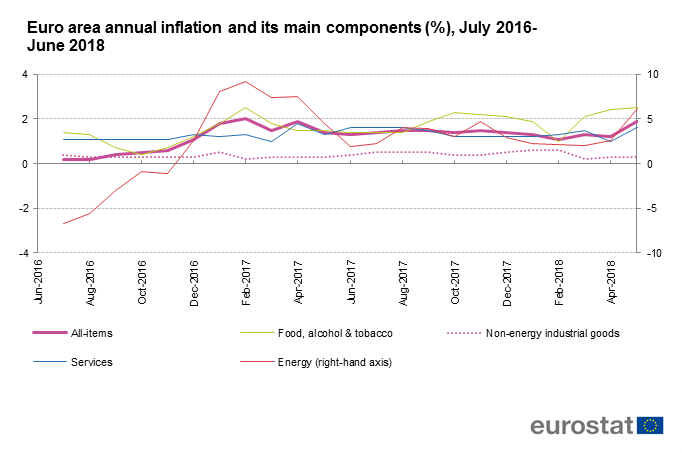
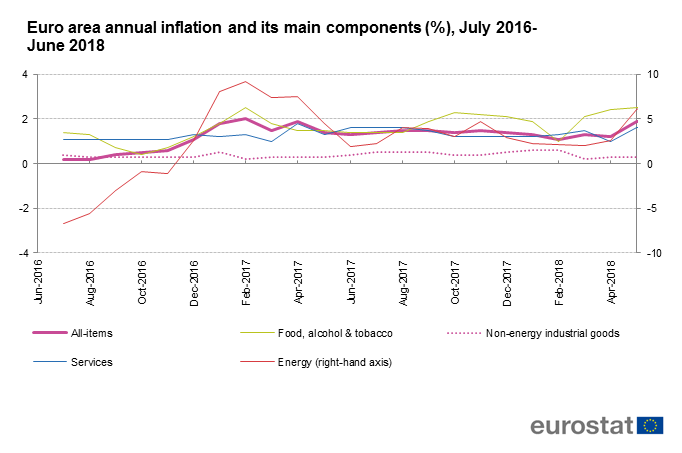
Euro area annual inflation and its main components (%), July 2016-June 2018.png
(
file
)
24 KB
1
11:34, 18 July 2018
Euro area annual inflation and its main components (%), January 2008-June 2018.png
(
file
)
34 KB
1
11:32, 18 July 2018
Euro area annual inflation and its main components (%), July 2016-June 2018 (estimated).png
(
file
)
24 KB
2
11:31, 18 July 2018
Euro area annual inflation and its main components (%), January 2008-June 2018 (estimated).png
(
file
)
34 KB
2
12:24, 31 January 2018
Euro area annual inflation and its main components (%), 2018, January 2017 and August 2017-January 2018-e.png
(
file
)
20 KB
1
12:19, 31 January 2018
Weights of the main components of the euro area HICP - 2018-e.png
(
file
)
11 KB
1
12:12, 31 January 2018
Euro area annual inflation and its main components (%), February 2016-January 2018-e.png
(
file
)
46 KB
1
12:11, 31 January 2018
Euro area annual inflation and its main components, January 2008-January 2018-e.png
(
file
)
26 KB
1
11:53, 31 July 2017
Euro area annual inflation and its main components (%), August 2015-July 2017-e.png
(
file
)
47 KB
1
11:53, 31 July 2017
Euro area annual inflation and its main components, January 2007-July 2017-e.png
(
file
)
27 KB
1
11:52, 31 July 2017
Euro area annual inflation and its main components (%), 2017, July 2016 and February-July 2017-e.png
(
file
)
20 KB
1
11:59, 17 July 2017
Mean absolute deviation measured in percentage points 2017-06.png
(
file
)
28 KB
1
11:55, 17 July 2017
Inflation direction analysis over 12 months 2017-05.png
(
file
)
40 KB
1
11:50, 17 July 2017
Flash estimate and HICP annual rates for the all-items and main components 2017-06.png
(
file
)
34 KB
1
11:40, 17 July 2017
Euro area annual inflation and its main components (%), 2017, June 2016 and January-June 2017.png
(
file
)
20 KB
5
First page
Previous page
Next page
Last page
Special page
ISSN 2443-8219
.png)
.png)
_2020.png)


,_December_2017_-_December_2019.png)
,_2019,_December_2018_and_July_2019-December_2019.png)
,_December_2009_-_December_2019.png)
_FP19.png)
_FP19.png)
_FP18.png)
.png)
,_June_2017-June_2019.png)
,_2019,_June_2018_and_January_2019-June_2019.png)
,_January_2010-June_2019.png)
.png)
,_January_2017-January_2019.png)

,_2019,_January_2018_and_August_2018-January_2019.png)
,_January_2009-January_2019.png)
_for_the_all-items_and_main_components_%E2%80%93_December_2017-December_2018_(unrevised).png)
,_December_2016-December_2018.png)
,_January_2008-December_2018.png)
,_2018,_December_2017_and_July-December_2018.png)
,_January_2008-November_2018.png)
,_November_2016-November_2018.png)
,_August_2016-July_2018_(estimated).png)
,_2018,_July_2017_and_February-July_2018_(estimated).png)
,_January_2008-July_2018_(estimated).png)
.png)


,_2018,_June_2017_and_January-June_2018.png)
,_July_2016-June_2018.png)
,_January_2008-June_2018.png)
,_July_2016-June_2018_(estimated).png)
,_January_2008-June_2018_(estimated).png)
,_2018,_January_2017_and_August_2017-January_2018-e.png)

,_February_2016-January_2018-e.png)

,_August_2015-July_2017-e.png)

,_2017,_July_2016_and_February-July_2017-e.png)


,_2017,_June_2016_and_January-June_2017.png)