Tutorials
Log in
Statistics Explained
menu
search
search
Navigation
Main page
Statistical themes
Glossary
Categories
Statistics 4 beginners
Tutorials
Help
Eurostat home
Education corner
Online publications
Regional yearbook
Sustainable development
Full list
Tools
User contributions
Logs
View user groups
Special pages
search
Navigation
Main page
Statistical themes
Glossary
Categories
Statistics 4 beginners
Tutorials
Help
Eurostat home
Education corner
Online publications
Regional yearbook
Sustainable development
Full list
Tools
User contributions
Logs
View user groups
Special pages
Navigation
Main page
Statistical themes
Glossary
Categories
Statistics 4 beginners
Tutorials
Help
Eurostat home
Education corner
Online publications
Regional yearbook
Sustainable development
Full list
Tools
User contributions
Logs
View user groups
Special pages
Uploads by Martcal
This special page shows all uploaded files.
File list
Items per page:
20
50
100
250
500
Search for media name:
Username:
Include old versions of files
Go
Date
Name
Thumbnail
Size
Description
Versions
15:56, 5 September 2013
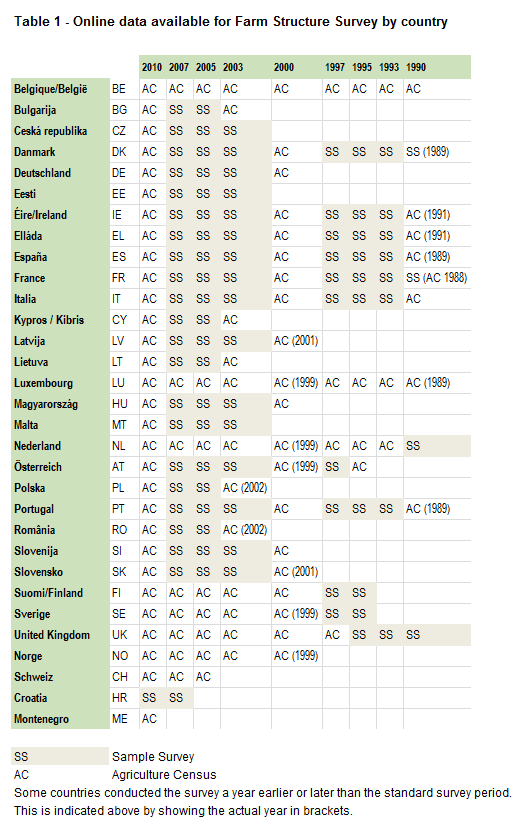
Table 1 - Online data available for Farm Structure Survey by country.PNG
(
file
)
46 KB
2
11:48, 27 August 2013
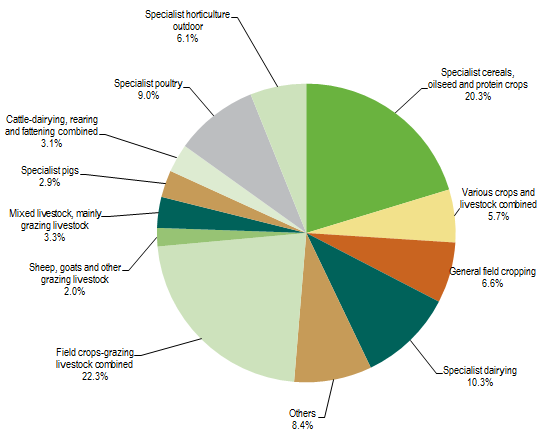
Figure Standard output by main type of farming SK 2010.PNG
(
file
)
25 KB
1
11:45, 27 August 2013
Figure Number of holdings by main type of farming SK 2010.PNG
(
file
)
26 KB
4
12:04, 9 July 2012
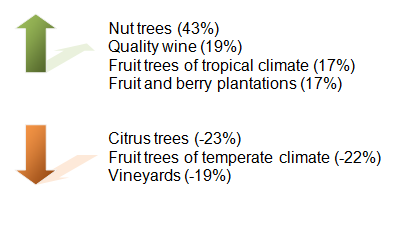
Permanent Crops pt.png
(
file
)
9 KB
1
11:02, 9 July 2012
Thresholds PT.png
(
file
)
32 KB
1
10:52, 9 July 2012
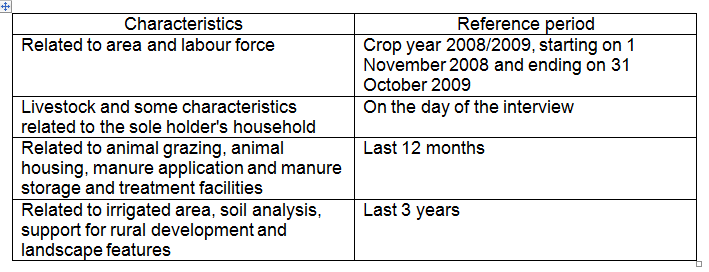
Reference period pt.png
(
file
)
13 KB
1
17:39, 1 June 2012
Figure 2- Land use, FSS, Portugal 1999, 2009.png
(
file
)
46 KB
1
11:44, 1 June 2012
Table 4- Land Use, FSS, Portugal, 1999-2009.jpg
(
file
)
49 KB
1
12:49, 25 May 2012
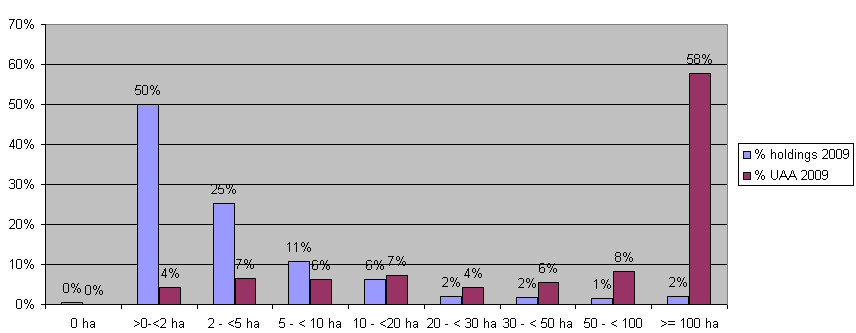
Percentage of holdings and UAA by Size of UAA in Portugal , FSS 2009.jpg
(
file
)
35 KB
1
17:12, 24 May 2012
UAA per IHN (ha), 2003.PNG
(
file
)
46 KB
1
16:26, 24 May 2012
T1 Key PT Nuts2.jpg
(
file
)
149 KB
1
16:14, 24 May 2012
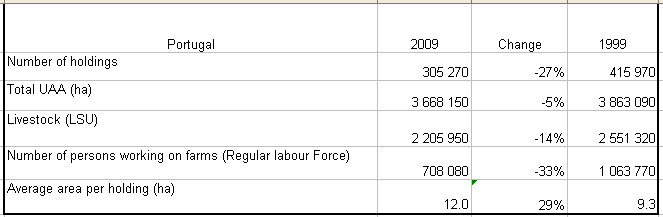
T1 key indicatores, FSS, PT, 1999-2009, .png
(
file
)
23 KB
2
17:18, 23 May 2012
UAA per IHN (ha), 2000.PNG
(
file
)
34 KB
3
17:13, 23 May 2012
T1 key indicatores, FSS, PT, 1999-2009, .jpg
(
file
)
28 KB
1
12:54, 15 July 2011
Cattle (bovine animals) (1000 heads), 2000-2010.png
(
file
)
26 KB
1
12:53, 15 July 2011
Utilised agricultural area (1000 ha), 2000-2010.png
(
file
)
26 KB
1
12:52, 15 July 2011
Number of Agricultural Holdings, 2000-2010.png
(
file
)
24 KB
1
11:18, 5 July 2011
Cattle (bovine animals) (1000 heads), 2000-2010 new version.PNG
(
file
)
49 KB
1
11:02, 5 July 2011
Number of Agricultural Holdings, 2000-2010, new version.PNG
(
file
)
44 KB
1
Special page
ISSN 2443-8219


,_2003.PNG)


,_2000.PNG)

_(1000_heads),_2000-2010.png)
,_2000-2010.png)

_(1000_heads),_2000-2010_new_version.PNG)
