Tutorials
Log in
Statistics Explained
menu
search
search
Navigation
Main page
Statistical themes
Glossary
Categories
Statistics 4 beginners
Tutorials
Help
Eurostat home
Education corner
Online publications
Regional yearbook
Sustainable development
Full list
Tools
User contributions
Logs
View user groups
Special pages
search
Navigation
Main page
Statistical themes
Glossary
Categories
Statistics 4 beginners
Tutorials
Help
Eurostat home
Education corner
Online publications
Regional yearbook
Sustainable development
Full list
Tools
User contributions
Logs
View user groups
Special pages
Navigation
Main page
Statistical themes
Glossary
Categories
Statistics 4 beginners
Tutorials
Help
Eurostat home
Education corner
Online publications
Regional yearbook
Sustainable development
Full list
Tools
User contributions
Logs
View user groups
Special pages
Uploads by Kleingyext
This special page shows all uploaded files.
File list
Items per page:
20
50
100
250
500
Search for media name:
Username:
Include old versions of files
Go
First page
Previous page
Next page
Last page
Date
Name
Thumbnail
Size
Description
Versions
19:57, 19 September 2022
Migrant integ stat healthTable2.png
(
file
)
564 KB
1
13:02, 5 April 2022
Tweet accessibility2.png
(
file
)
39 KB
1
16:27, 4 April 2022
Test xlsx.xlsx
(
file
)
5 KB
1
16:24, 4 April 2022
Tweet accessibility.png
(
file
)
40 KB
1
18:21, 6 December 2021
UKAFTERBREXIT Healthcare expenditure statistics HL Dec-2021.xlsx
(
file
)
9 KB
1
18:52, 15 November 2021
Excess mortality September 2021.gif
(
file
)
154 KB
1
10:59, 22 July 2021
Country-specific metadata 2021Q1.pdf
(
file
)
530 KB
1
10:59, 22 July 2021
Country notes on seasonal and calendar adjustment 2021Q1.pdf
(
file
)
326 KB
1
15:43, 17 June 2021
GDP per capita brexit 2021 V2.xlsx
(
file
)
9 KB
2
15:02, 15 June 2021
01-one.png
(
file
)
152 KB
12
09:45, 11 May 2021
Imgtestgkn.png
(
file
)
1 KB
8
09:03, 7 May 2021
Microsoft Excel 2010 Logo.png
(
file
)
2 KB
5
11:26, 8 March 2021
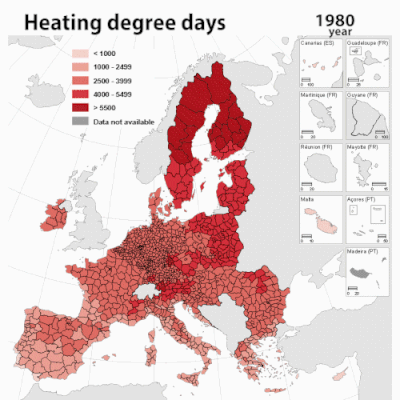
Heating degree days 400.gif
(
file
)
422 KB
1
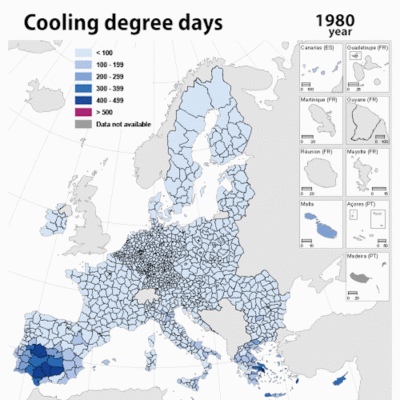
11:23, 8 March 2021
Cooling degree days 400.gif
(
file
)
954 KB
1
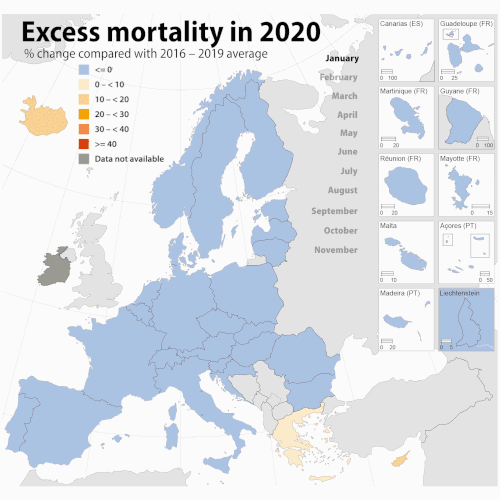
15:30, 5 February 2021
Excessive deaths in 2020 November data.gif
(
file
)
471 KB
4
12:26, 20 January 2021
Anim.gif
(
file
)
13.69 MB
1
11:10, 20 January 2021
Excessive deaths in 2020 November data V2.gif
(
file
)
457 KB
2
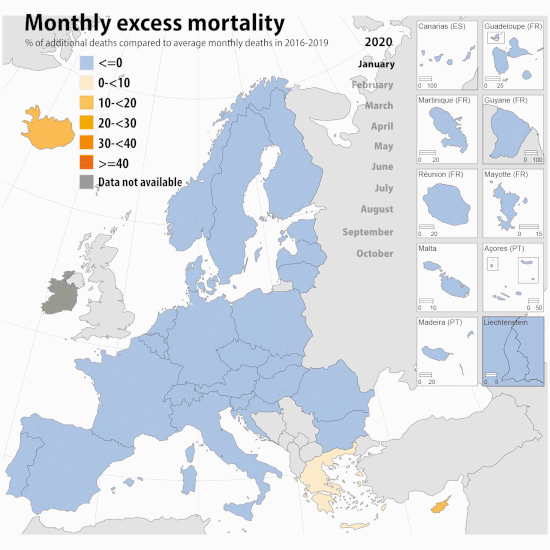
10:58, 14 December 2020
Monthly excess mortality.gif
(
file
)
656 KB
4
15:22, 7 December 2020
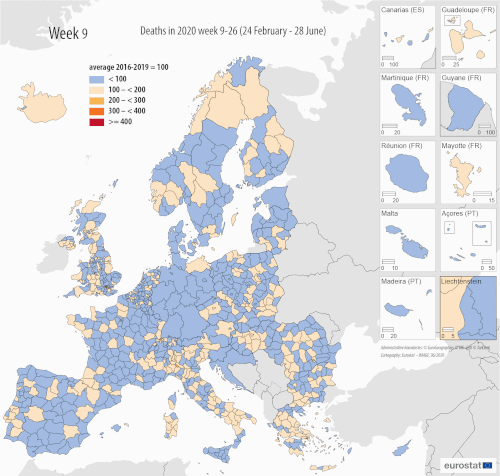
Weekly deaths w9-w26 2020 19-10-2020 500px.gif
(
file
)
1 MB
1
14:57, 7 December 2020
Test animated image.gif
(
file
)
118 KB
1
11:35, 26 November 2020
Header.png
(
file
)
9 KB
1
09:27, 25 June 2020
Wages and labour costs EU-27.xlsx
(
file
)
8 KB
2
17:41, 4 June 2020
0-zero.png
(
file
)
193 KB
1
16:27, 19 May 2020
SIF Main Page.png
(
file
)
228 KB
1
11:36, 12 February 2020
Wmi2019 2.xlsx
(
file
)
8 KB
1
15:29, 12 September 2019
SEMU DEUX.jpg
(
file
)
1.56 MB
3
13:02, 12 September 2019
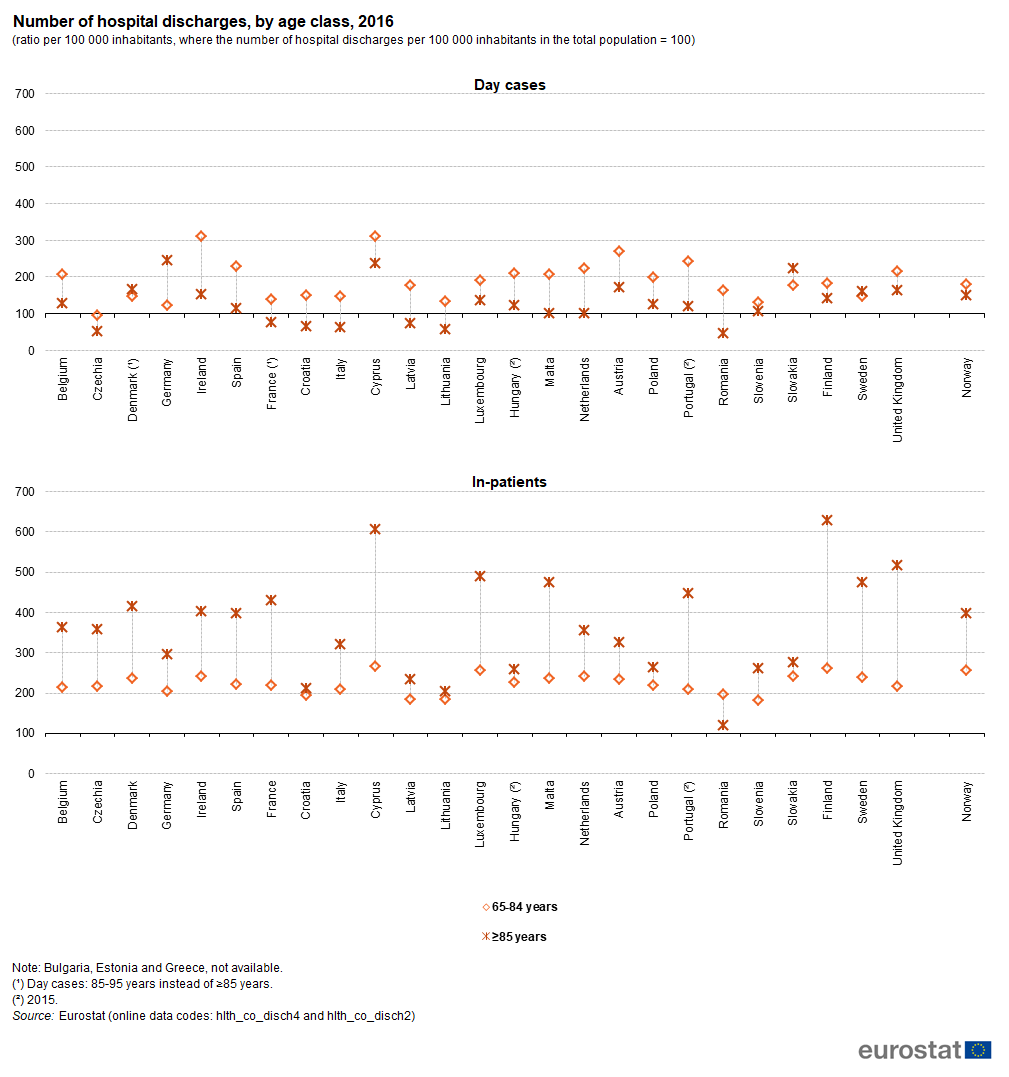
Number of hospital discharges, by age class, 2016 (ratio per 100 000 inhabitants, where the number of hospital discharges per 100ÿ000 inhabitants in the total population = 100) AE2019.png
(
file
)
48 KB
1
10:04, 12 September 2019
SEMU CINQ.jpg
(
file
)
1.08 MB
4
10:00, 12 September 2019
SEMU UN.jpg
(
file
)
1.4 MB
3
10:00, 12 September 2019
SEMU TROIS.jpg
(
file
)
1.65 MB
3
10:00, 12 September 2019
SEMU SIX.jpg
(
file
)
1.53 MB
3
10:00, 12 September 2019
SEMU SEPT.jpg
(
file
)
1.07 MB
2
10:00, 12 September 2019
SEMU QUATRE.jpg
(
file
)
1.6 MB
2
10:00, 12 September 2019
SEMU ONZE.jpg
(
file
)
1.16 MB
2
10:00, 12 September 2019
SEMU NEUF.jpg
(
file
)
1.33 MB
2
10:00, 12 September 2019
SEMU HUIT.jpg
(
file
)
1.38 MB
2
10:00, 12 September 2019
SEMU DOUZE.jpg
(
file
)
1.73 MB
2
10:00, 12 September 2019
SEMU DIX.jpg
(
file
)
1.12 MB
2
16:37, 20 August 2019
Gender pay gap 2017data-02.jpg
(
file
)
1.1 MB
2
16:37, 20 August 2019
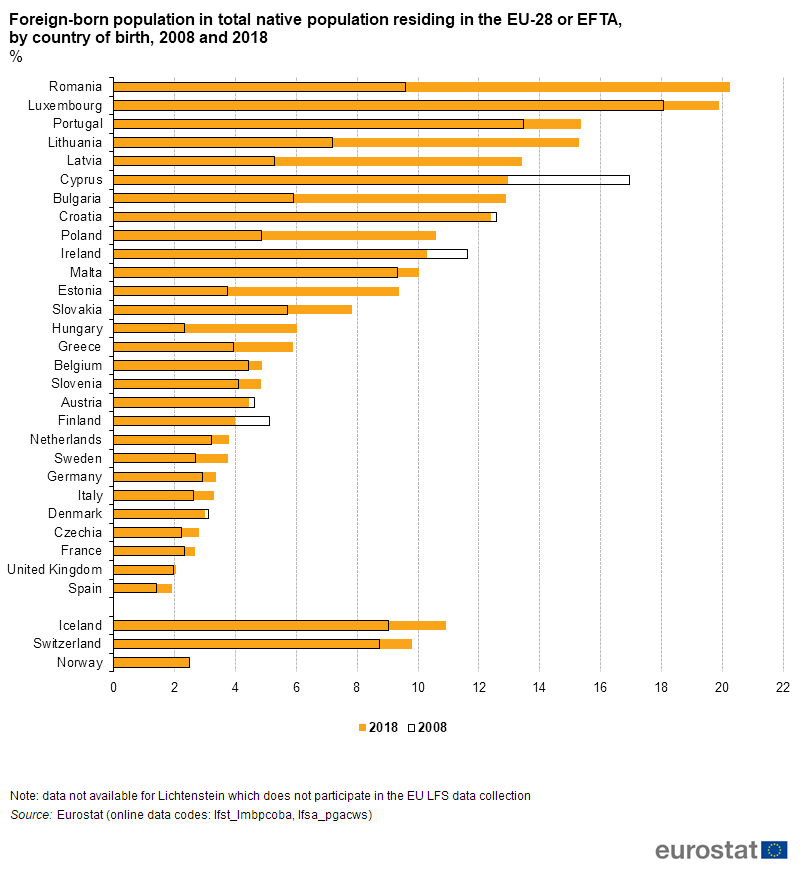
Foreign-born population in total native population residing in the EU-28 or EFTA, by country of birth, 2008 and 2018 %.png
(
file
)
49 KB
3
16:37, 20 August 2019
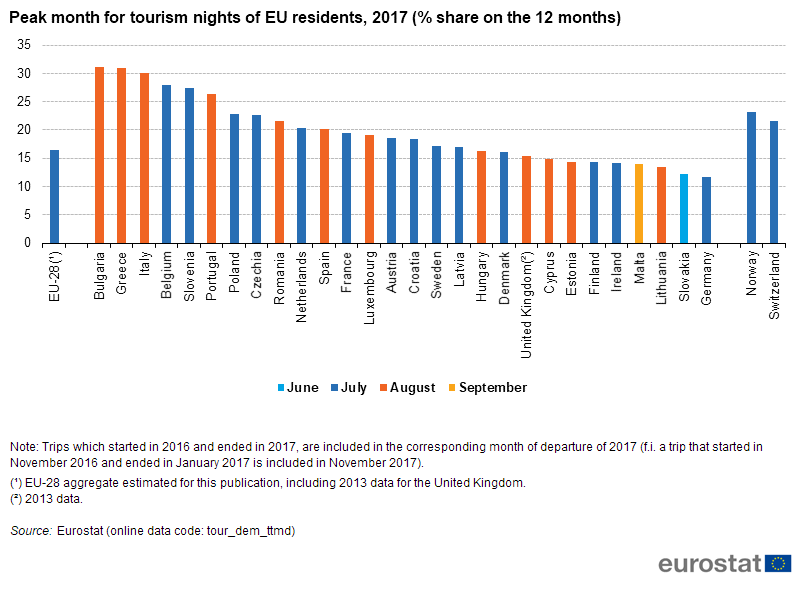
Peak month for tourism nights of EU residents, 2017 (% share on the 12 months.png
(
file
)
54 KB
1
13:54, 7 May 2019
Tourism statistics - nights spent at tourist accommodation establishments April 19 V2.xlsx
(
file
)
10 KB
2
11:40, 26 February 2019
Testpiechart.xlsx
(
file
)
8 KB
1
16:30, 13 November 2018
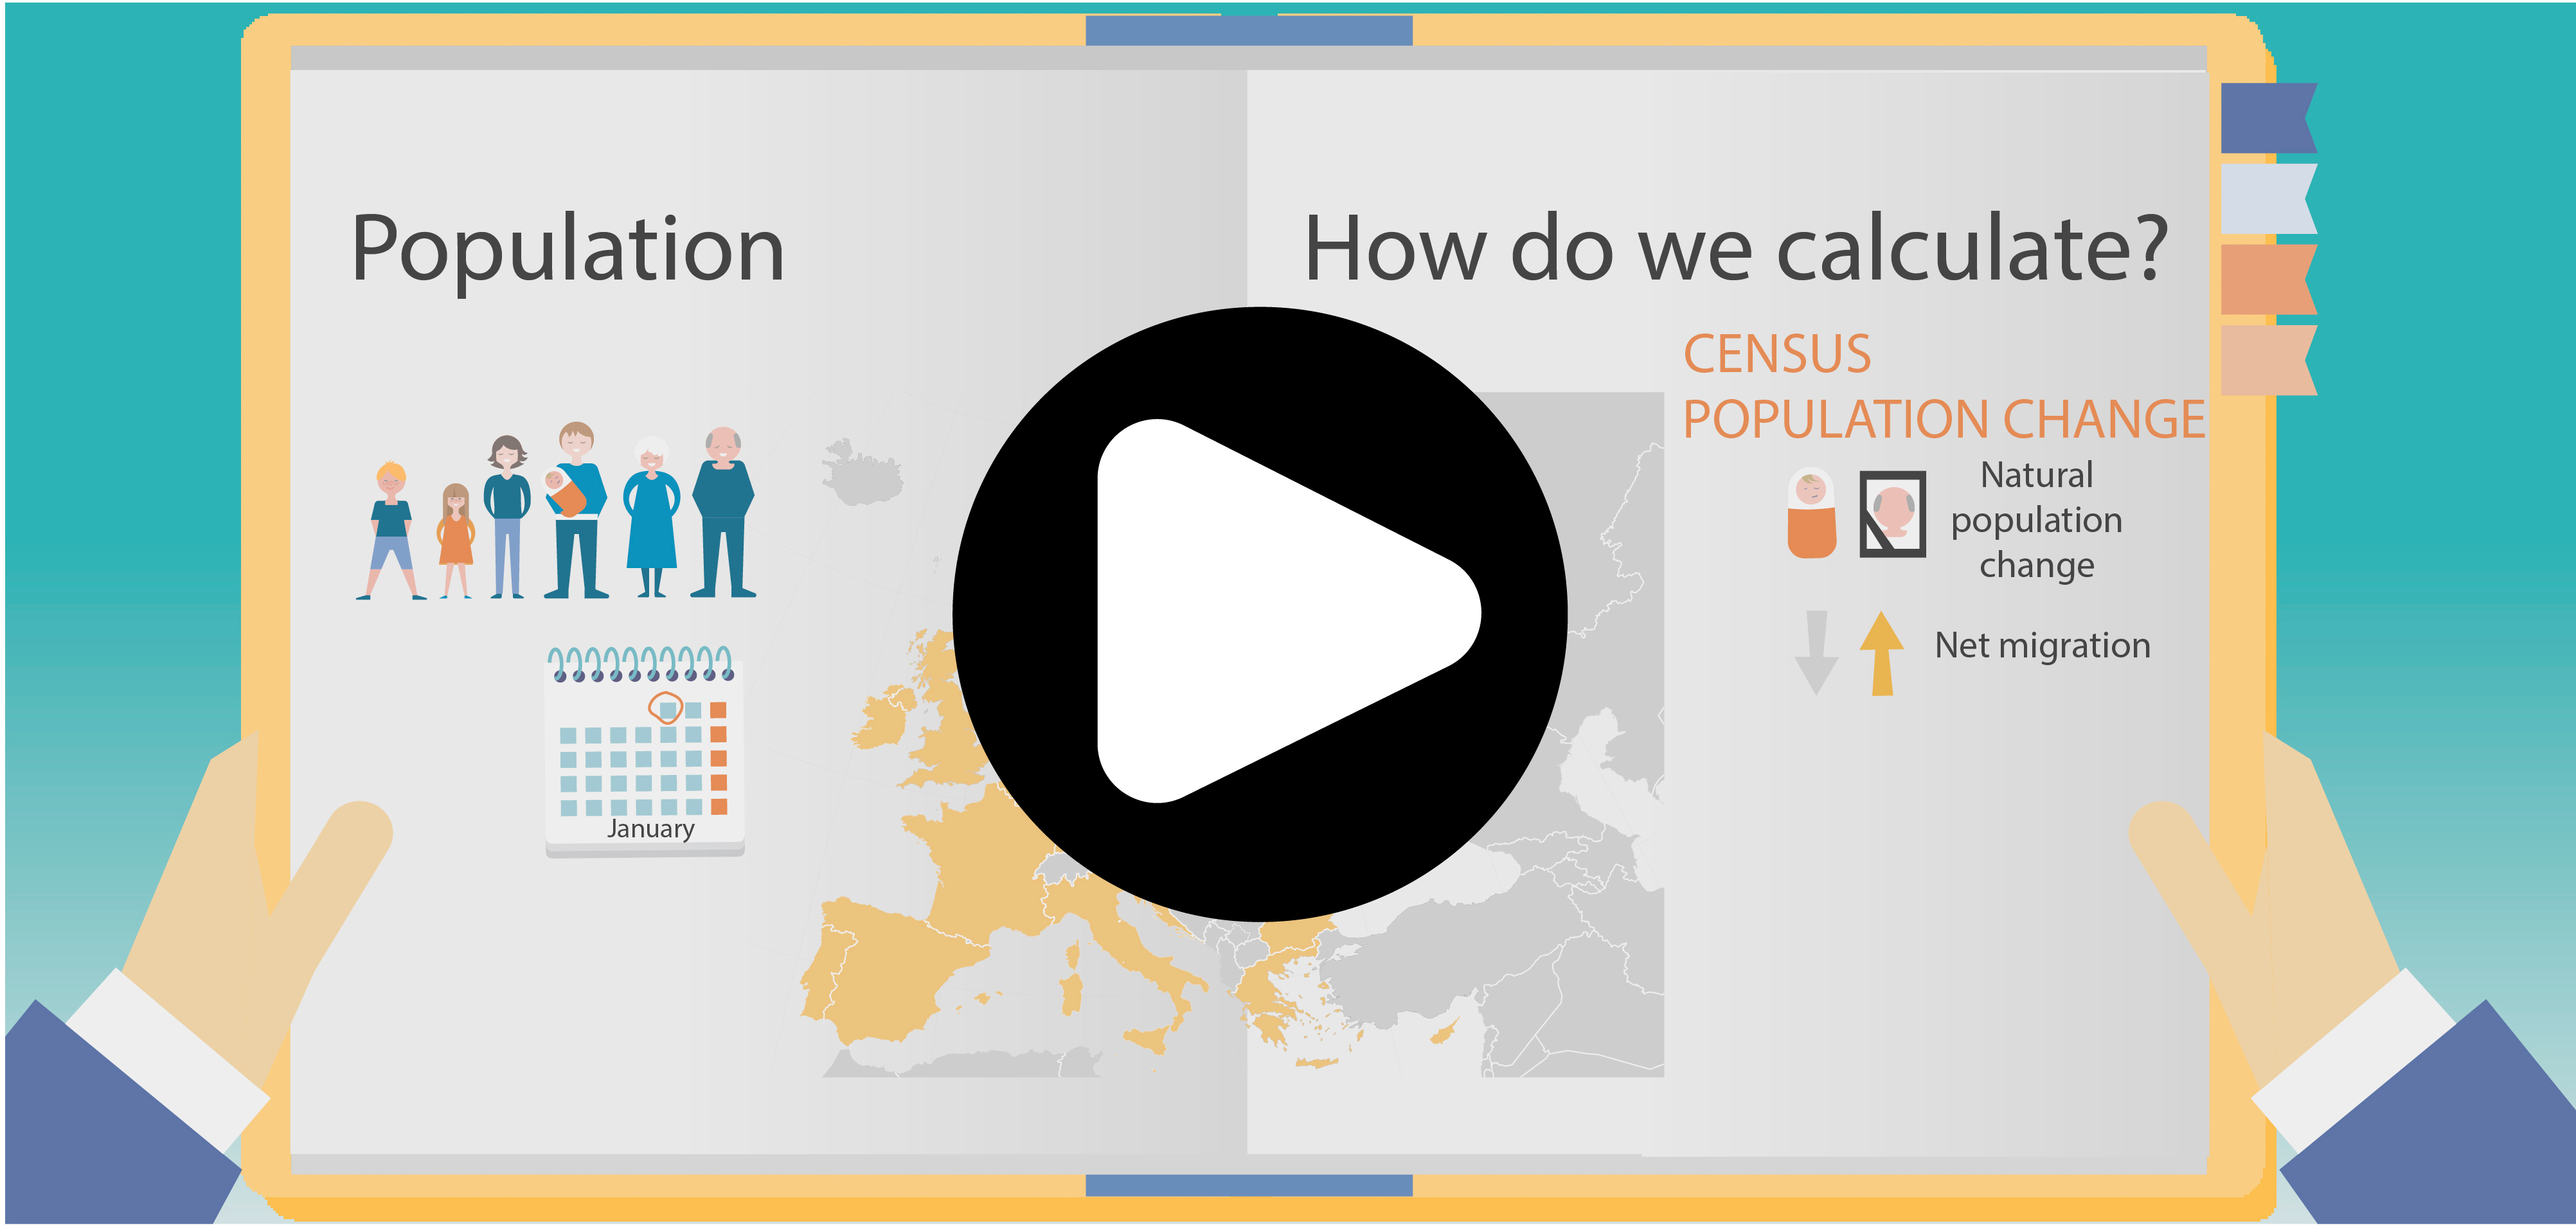
Stats4beginners Population Video 2.jpg
(
file
)
941 KB
1
14:24, 17 April 2018
Trade in high techV5.xlsx
(
file
)
8 KB
2
15:13, 16 April 2018
Trade EU US 2007 2017 3.xlsx
(
file
)
8 KB
2
11:36, 12 April 2018
Labellinechart.xlsx
(
file
)
8 KB
1
11:21, 12 April 2018
Line SE.xlsx
(
file
)
7 KB
1
16:13, 10 April 2018
Trade balance EU US 2017.xlsx
(
file
)
8 KB
6
13:25, 14 December 2016
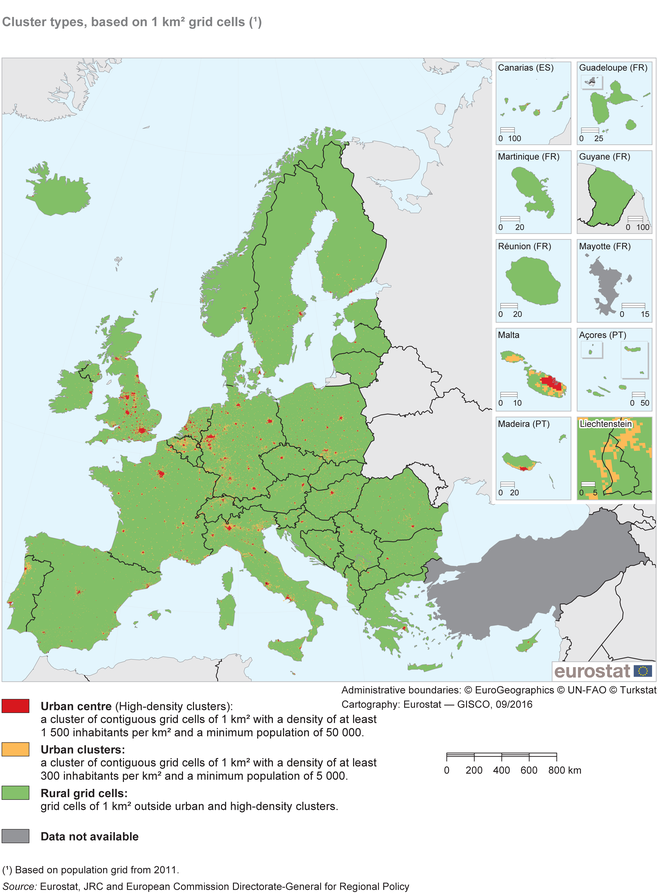
Type of clusters - Map 14.1.png
(
file
)
371 KB
2
First page
Previous page
Next page
Last page
Special page
ISSN 2443-8219


_AE2019.png)


