Tutorials
Log in
Statistics Explained
menu
search
search
Navigation
Main page
Statistical themes
Glossary
Categories
Statistics 4 beginners
Tutorials
Help
Eurostat home
Education corner
Online publications
Regional yearbook
Sustainable development
Full list
Tools
User contributions
Logs
View user groups
Special pages
search
Navigation
Main page
Statistical themes
Glossary
Categories
Statistics 4 beginners
Tutorials
Help
Eurostat home
Education corner
Online publications
Regional yearbook
Sustainable development
Full list
Tools
User contributions
Logs
View user groups
Special pages
Navigation
Main page
Statistical themes
Glossary
Categories
Statistics 4 beginners
Tutorials
Help
Eurostat home
Education corner
Online publications
Regional yearbook
Sustainable development
Full list
Tools
User contributions
Logs
View user groups
Special pages
Uploads by Kerneri
This special page shows all uploaded files.
File list
Items per page:
20
50
100
250
500
Search for media name:
Username:
Include old versions of files
Go
Date
Name
Thumbnail
Size
Description
Versions
16:14, 16 January 2018
STEC SE 2017 fin.xlsx
(
file
)
102 KB
1
15:56, 16 January 2018
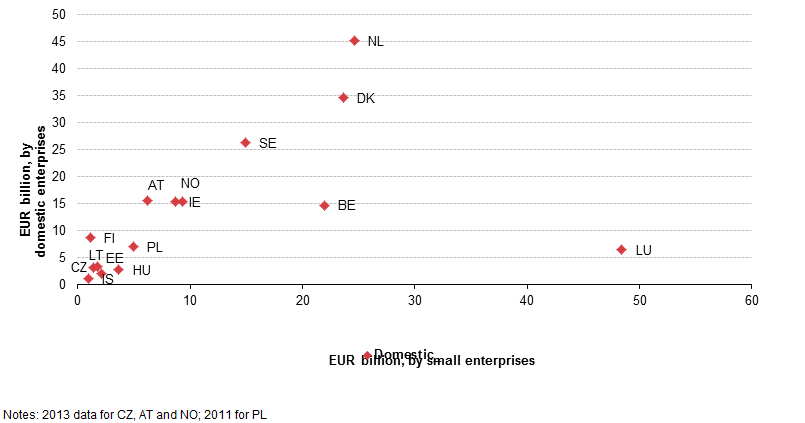
Correlation of services exports by small and domestic enterprises, 15 countries, 2014.png
(
file
)
12 KB
1
14:59, 6 April 2017
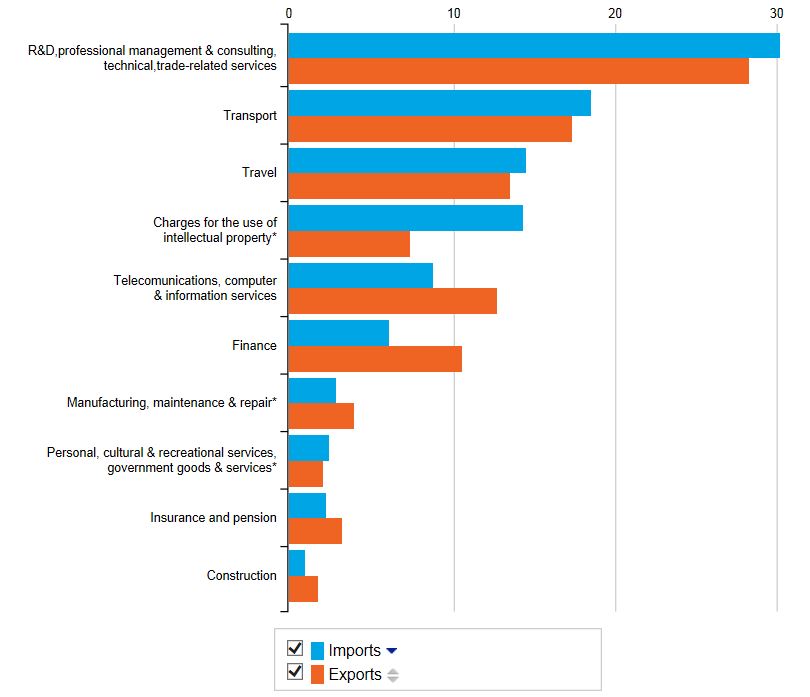
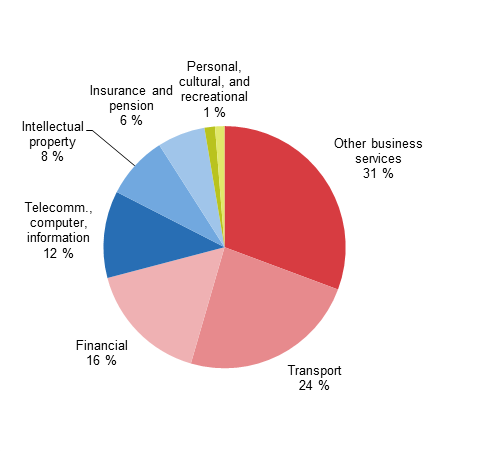
Services categories.JPG
(
file
)
54 KB
1
14:42, 6 April 2017
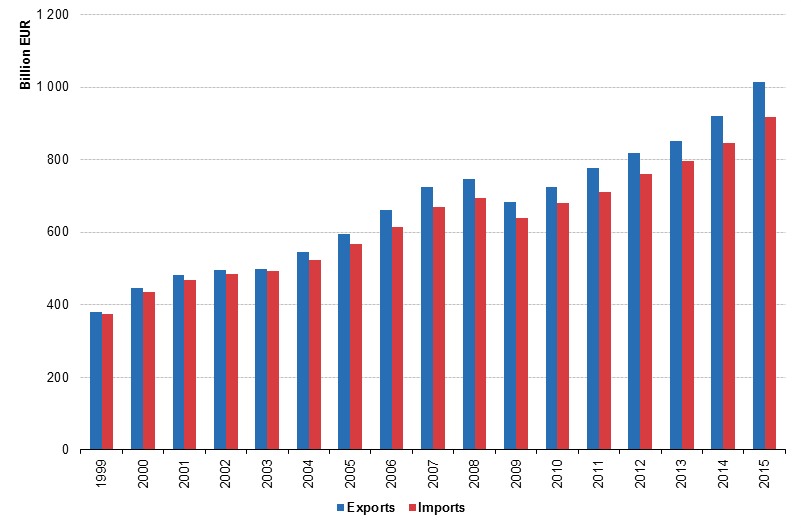
Intra-EU asymmetries (EU-28 exports into EU-28 compared to EU-28 imports from EU-28) in 1999-2015.png
(
file
)
31 KB
2
14:18, 3 April 2017
EU Asymmetries Evolution.xls
(
file
)
49 KB
1
13:10, 19 December 2016
Figure 4 EU28 services exports channelled by mode 1 (crossborder supply), partner extra-EU, 2013 .png
(
file
)
15 KB
1
13:09, 19 December 2016
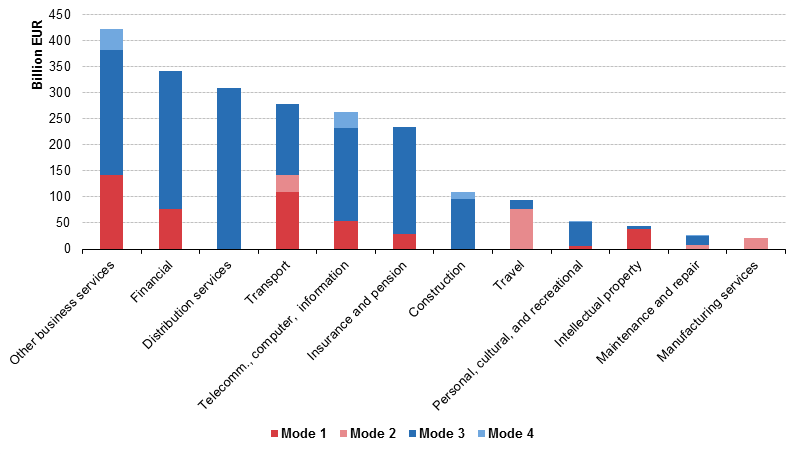
Figure 3 EU28 supply of services in volume by modes of supply, partner extra EU, billion EUR, 2013.png
(
file
)
26 KB
1
11:29, 19 December 2016
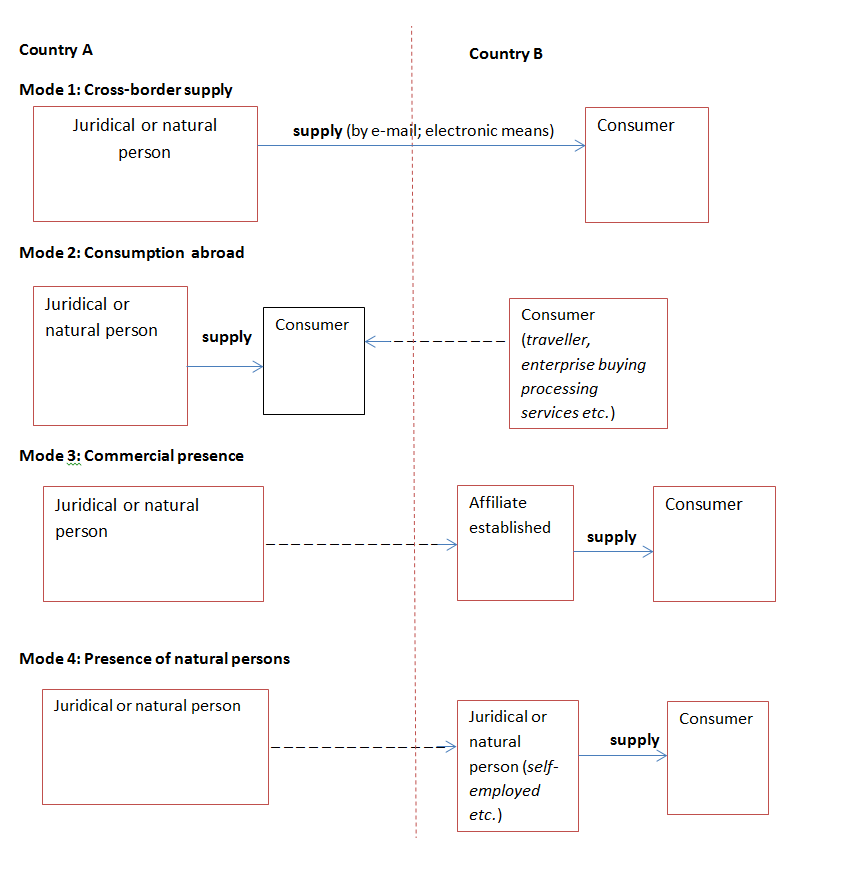
Annex 1 Simplified descriptions of how services are supplied, from country A to B Based on GATS provisions.png
(
file
)
32 KB
2
11:21, 16 December 2016
Annex 3 Average distribution for exports to be applied for EU countries.png
(
file
)
15 KB
2
11:15, 16 December 2016
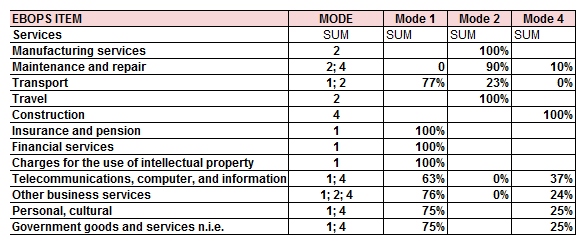
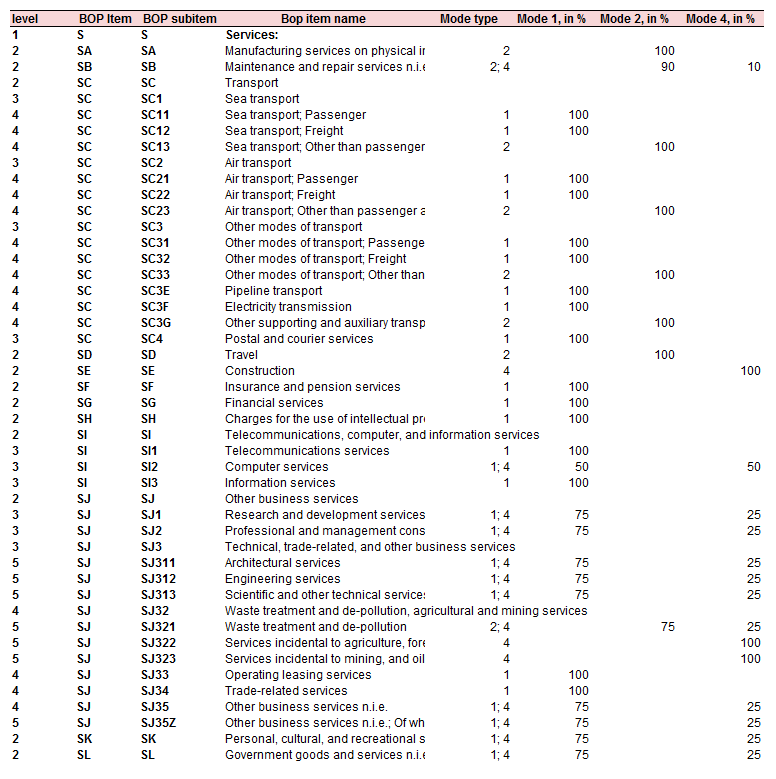
Annex 2 Proportional allocation of EBOPS categories by mode of supply.png
(
file
)
53 KB
1
11:14, 16 December 2016
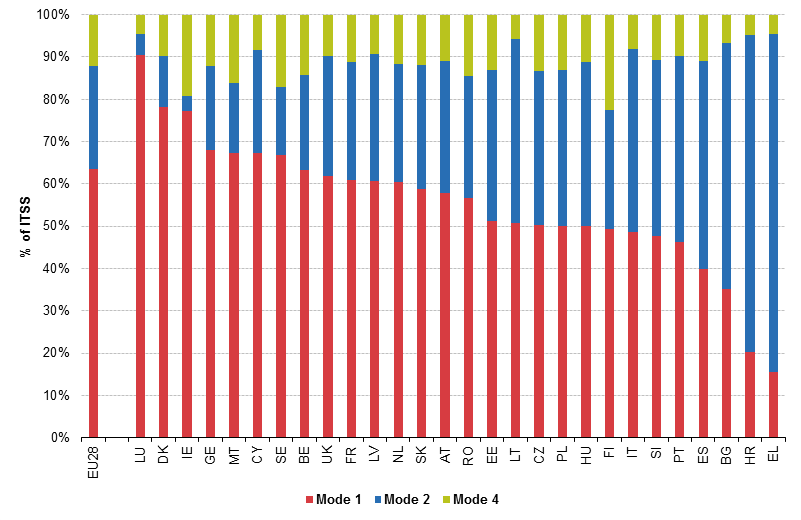
Figure 7 EU countries’ services imports by mode 1, 2 and 4 with rest of the world, 2013.png
(
file
)
39 KB
1
11:13, 16 December 2016
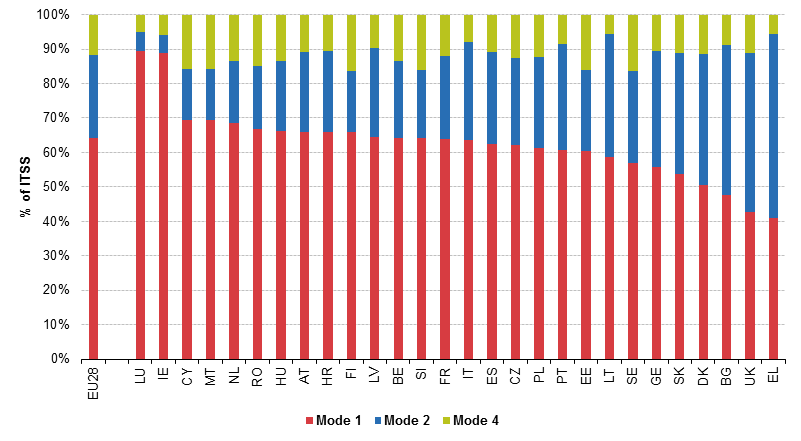
Figure 6 EU countries’ services exports by mode 1, 2 and 4 with the rest of the world, 2013.png
(
file
)
47 KB
1
11:12, 16 December 2016
Figure 5 EU-28 services exports channelled through mode 3 (commercial presence), partner extra-EU, 2013.png
(
file
)
16 KB
1
11:12, 16 December 2016
Figure 4 EU-28 services exports channelled by mode 1 (cross-border supply), partner extra-EU, 2013 .png
(
file
)
15 KB
1
11:11, 16 December 2016
Figure 3 EU-28 supply of services in volume by modes of supply, partner extra EU, billion EUR, 2013.png
(
file
)
26 KB
1
15:51, 15 December 2016
Figure 2 EU-28 supply of services, partner extra-EU, % of ITSS and FATS, 2013.png
(
file
)
36 KB
2
15:39, 15 December 2016
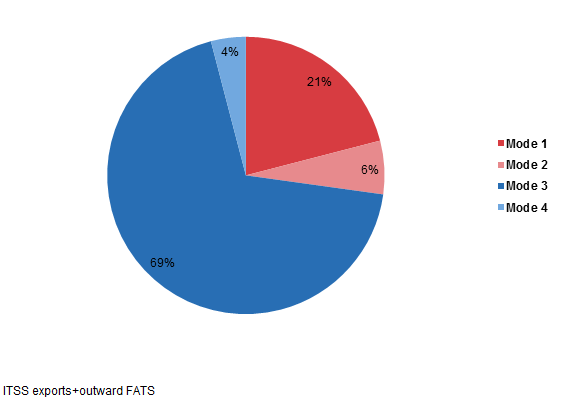
Figure 1 EU-28 outward supply of services, partner extra-EU, 2013.png
(
file
)
11 KB
1
12:03, 13 February 2015
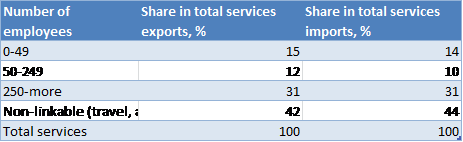
Table 3. Services exports and imports by enterprise's size class (weighted average of DK,CZ,PL,EE,LU,AT), 2011.png
(
file
)
7 KB
1
12:02, 13 February 2015
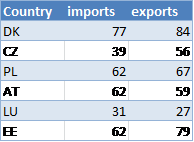
Table 2. Linking coverage by countries, %, 2011.png
(
file
)
3 KB
1
12:02, 13 February 2015
Table 1. Total services exports and imports by enterprise's main economic activity (NACE), 2011 (billion EUR).png
(
file
)
26 KB
1
12:02, 13 February 2015
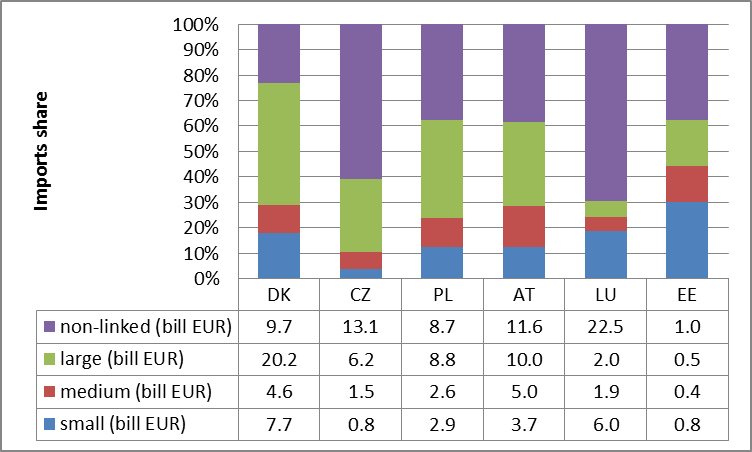
Figure 11. Imports of services by enterprise's size, by countries, %, 2011.png
(
file
)
28 KB
1
12:01, 13 February 2015
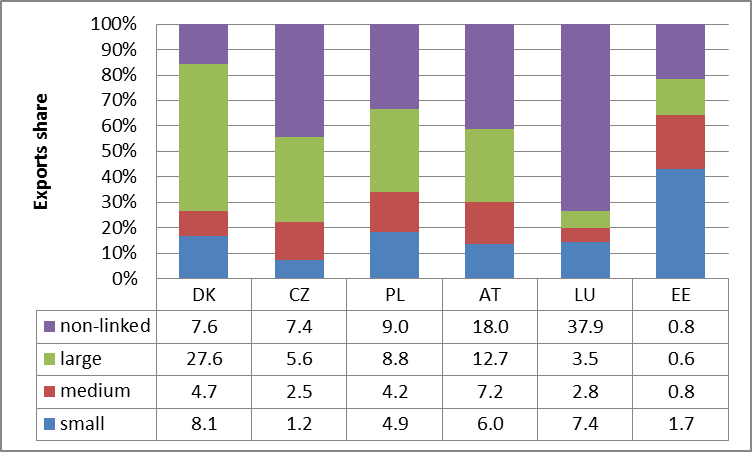
Figure 10. Exports of services by enterprise's size, by countries, %, 2011.png
(
file
)
30 KB
1
12:00, 13 February 2015
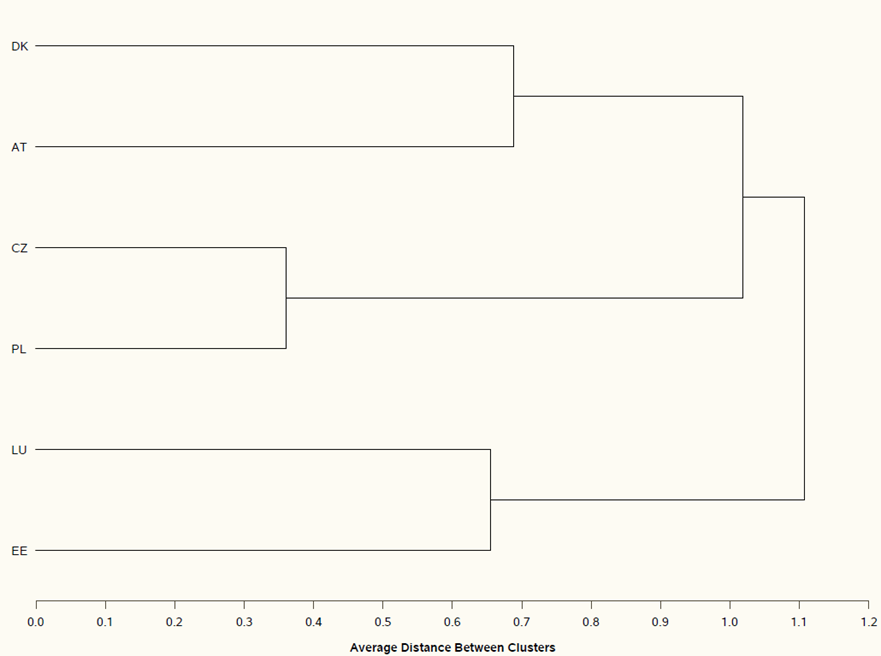
Figure 9. Countries in services trade by enterprise's characteristics (dendrogram), 2011.png
(
file
)
38 KB
1
11:28, 10 February 2015
Stec1.png
(
file
)
29 KB
1
11:24, 10 February 2015
Statistics Explained.xlsx
(
file
)
197 KB
1
Special page
ISSN 2443-8219


_in_1999-2015.png)
,_partner_extra-EU,_2013_.png)


,_partner_extra-EU,_2013.png)
,_partner_extra-EU,_2013_.png)


,_2011.png)

,_2011_(billion_EUR).png)


,_2011.png)
