Tutorials
Log in
Statistics Explained
menu
search
search
Navigation
Main page
Statistical themes
Glossary
Categories
Statistics 4 beginners
Tutorials
Help
Eurostat home
Education corner
Online publications
Regional yearbook
Sustainable development
Full list
Tools
User contributions
Logs
View user groups
Special pages
search
Navigation
Main page
Statistical themes
Glossary
Categories
Statistics 4 beginners
Tutorials
Help
Eurostat home
Education corner
Online publications
Regional yearbook
Sustainable development
Full list
Tools
User contributions
Logs
View user groups
Special pages
Navigation
Main page
Statistical themes
Glossary
Categories
Statistics 4 beginners
Tutorials
Help
Eurostat home
Education corner
Online publications
Regional yearbook
Sustainable development
Full list
Tools
User contributions
Logs
View user groups
Special pages
Uploads by Iscruda
This special page shows all uploaded files.
File list
Items per page:
20
50
100
250
500
Search for media name:
Username:
Include old versions of files
Go
First page
Previous page
Next page
Last page
Date
Name
Thumbnail
Size
Description
Versions
10:18, 17 June 2019
LCIinput tables newsrel famx copy LCI 20190613134533 LCI.xls
(
file
)
70 KB
1
10:16, 17 June 2019
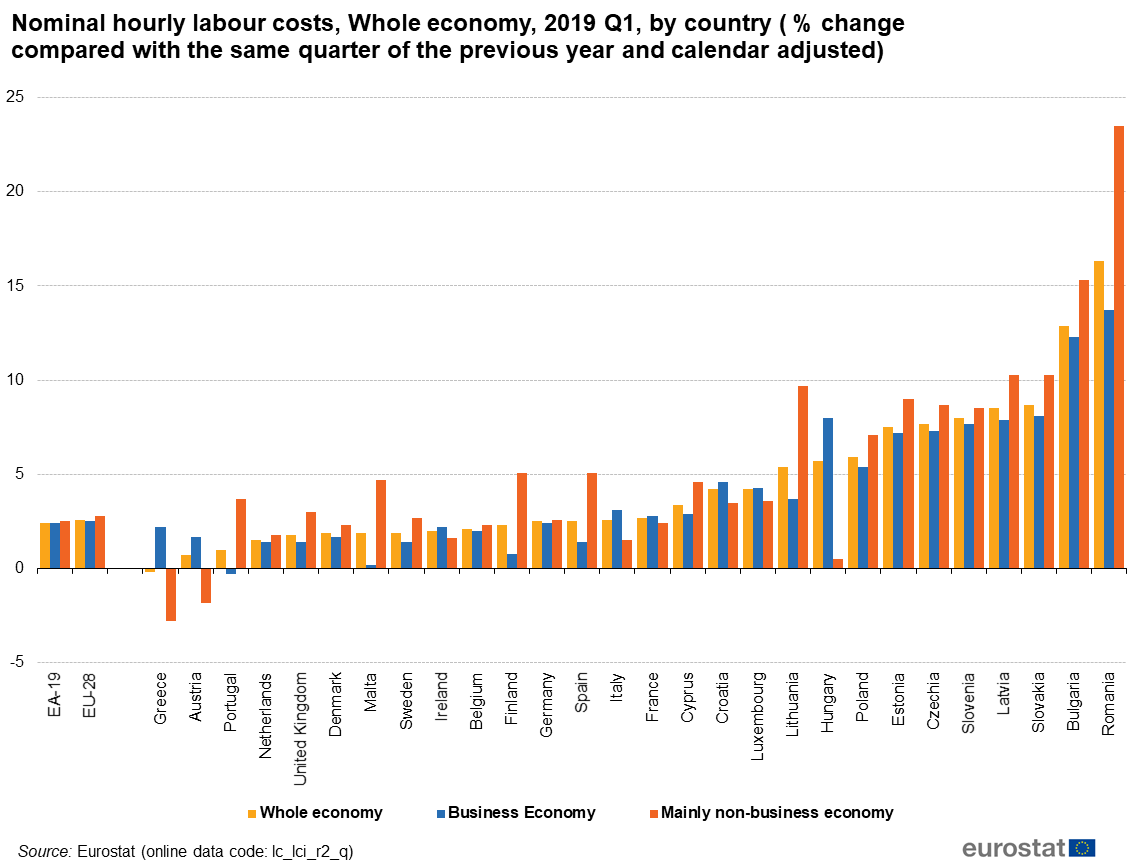
Nominal hourly labour costs, Whole economy, 2019 Q1, by country ( % change compared with the same quarter of the previous year and calendar adjusted).png
(
file
)
79 KB
1
10:14, 17 June 2019
Total nominal hourly labour costs, whole economy, 2019 Q1 (change compared to same quarter of previous year, calendar adjusted).png
(
file
)
65 KB
1
11:17, 4 June 2019
Unemployment rates by gender, EU, seasonally adjusted, January 2000 - April 2019.png
(
file
)
38 KB
1
11:14, 4 June 2019
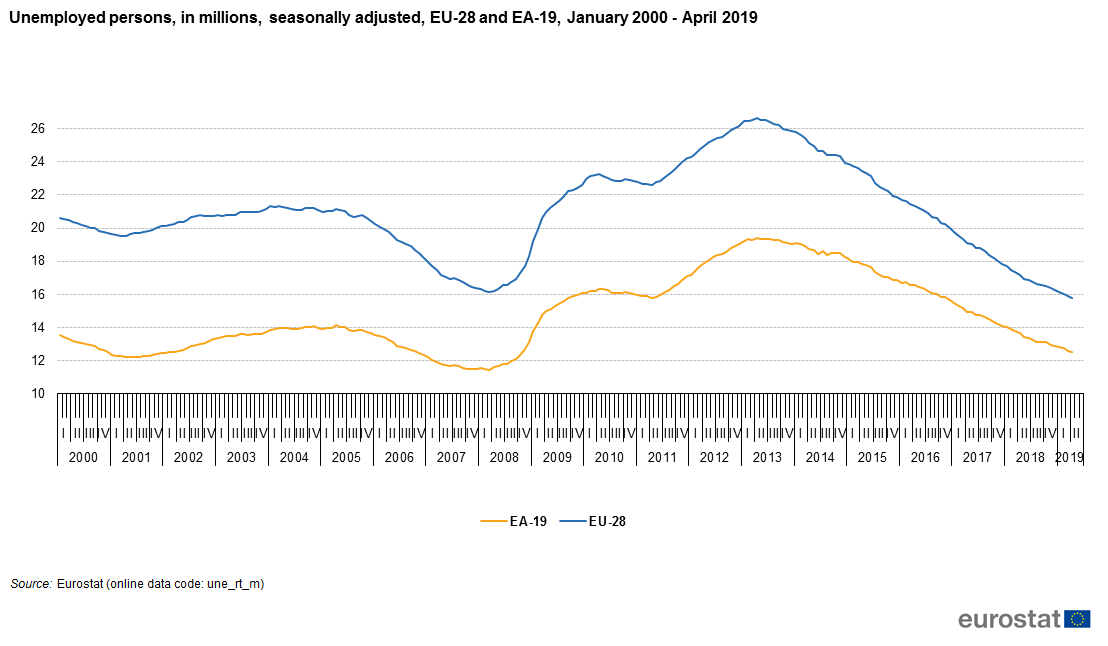
Unemployed persons, in millions, seasonally adjusted, EU-28 and EA-19, January 2000 - April 2019.png
(
file
)
33 KB
1
11:10, 4 June 2019
Youth unemployment rates, EU-28 and EA-19, seasonally adjusted, January 2000 - April 2019.png
(
file
)
47 KB
1
11:08, 4 June 2019
Unemployment rates EU-28, EA-19, US and Japan, seasonally adjusted, January 2000 - April 2019.png
(
file
)
52 KB
1
11:05, 4 June 2019
Unemployment rates, seasonally adjusted, April 2019.png
(
file
)
36 KB
1
11:03, 4 June 2019
Change in the number of unemployed persons (compared to previous month, in thousands), seasonally adjusted, January 2011 - April 2019.png
(
file
)
51 KB
1
11:02, 16 March 2018
Nominal hourly labour costs, Whole economy, 2017 Q4, by country (% change compared with the same quarter of the previous year and calendar adjusted).png
(
file
)
36 KB
1
11:00, 16 March 2018
Total nominal hourly labour costs, Whole economy, 2017 Q4 (% change compared to same quarter of previous year, calendar adjusted).png
(
file
)
27 KB
1
10:57, 16 March 2018
Total nominal hourly labour cost, Business economy, 2017 Q4 (% change compared to previous quarter, seasonal and calendar adjusted).png
(
file
)
35 KB
1
12:47, 22 February 2018
Minimum wage statistics 22.2.2018web.xlsx
(
file
)
52 KB
1
13:15, 16 February 2018
Minimum wage statistics 15.2.2018.xlsx
(
file
)
52 KB
1
11:59, 16 February 2018
Minimum wage statistics 14.2.2018.xlsx
(
file
)
52 KB
1
12:51, 7 February 2018
Minimum wages, January 2008 and January 2018.png
(
file
)
59 KB
1
11:53, 31 January 2018
Minimum wages, January 2018.png
(
file
)
50 KB
1
12:28, 16 June 2017
Nominal hourly labour costs, Whole economy, 2017 Q1, by country (% change compared with the same quarter of the previous year and calendar adjusted).png
(
file
)
6 KB
1
12:28, 16 June 2017
Total nominal hourly labour costs, Whole economy, 2017 Q1 (% change compared to same quarter of previous year, calendar adjusted).png
(
file
)
14 KB
1
12:26, 16 June 2017
Total nominal hourly labour cost, Business economy, 2017 Q1 (% change compared to previous quarter, seasonal and calendar adjusted).png
(
file
)
19 KB
1
12:23, 16 June 2017
Total nominal hourly labour cost, Business economy, 2016 Q4 (% change compared to previous quarter, seasonal and calendar adjusted) F1.png
(
file
)
33 KB
Reverted to version as of 11:06, 20 March 2017
3
11:03, 2 May 2017
Youth unemployment rates, EU-28 and EA-19, seasonally adjusted, January 2000 - February 2017 .png
(
file
)
25 KB
2
11:03, 2 May 2017
Unemployed persons, in millions, seasonally adjusted, EU-28 and EA-19, January 2000 - February 2017 .png
(
file
)
13 KB
2
11:02, 2 May 2017
Unemployment rates EU-28 EA-19 US and Japan seasonally adjusted January 2000 February 2017.png
(
file
)
27 KB
2
11:01, 2 May 2017
Unemployment rates, seasonally adjusted, February 2017 (%) F2.png
(
file
)
12 KB
2
10:58, 2 May 2017
Change in the number of unemployed persons (compared to previous month, in thousands), seasonally adjusted, January 2006 - February 2017.png
(
file
)
12 KB
2
12:08, 6 April 2017
Estimated hourly labour costs for the whole economy in euros, 2016 Enterprises with 10 or more employees F1.png
(
file
)
24 KB
5
11:34, 6 April 2017
Hourly labour costs 2016.xls
(
file
)
139 KB
1
11:23, 6 April 2017
Labour costs per hour in national currency for non-euro area Member States, breakdown by economic activity 2016.png
(
file
)
19 KB
1
11:23, 6 April 2017
Labour costs per hour in euro, breakdown by economic activity in 2016 T3.png
(
file
)
38 KB
1
11:22, 6 April 2017
Labour costs per hour in national currency for non-euro area countries whole economy (excluding agriculture and public administration) T2.png
(
file
)
19 KB
2
11:22, 6 April 2017
Labour costs per hour in euro, whole economy (excluding agriculture and public administration) T1.png
(
file
)
67 KB
2
11:22, 6 April 2017
Relative change in hourly labour costs 2016 2015 for the whole economy, in % F2.png
(
file
)
19 KB
1
11:13, 6 April 2017
Fig2 Relative change in hourly labour costs 2016-2015 for the whole economy, %.png
(
file
)
19 KB
1
11:12, 6 April 2017
Fig1 Estimated hourly labour costs for the whole economy, 2016, EUR, Enterprises with 10 or more employees.png
(
file
)
24 KB
1
11:10, 6 April 2017
Tab4 Labour costs per hour in national currency for non-euro area countries, 2016.png
(
file
)
19 KB
1
11:10, 6 April 2017
Tab3 Labour costs per hour in euro, breakdown by economic activity in 2016.png
(
file
)
38 KB
1
11:10, 6 April 2017
Tab2 Labour costs per hour in national currency for non-euro area countries.png
(
file
)
19 KB
2
11:08, 6 April 2017
Tab1 Labour costs per hour in euro, whole economy (excluding agriculture and public administration).png
(
file
)
67 KB
3
12:41, 19 December 2016
Total nominal hourly labour costs, % change compared to same quarter of previous year, working day adjusted 2016 Q3.png
(
file
)
21 KB
1
12:39, 19 December 2016
Total nominal hourly labour cost, Business economy, 2016 Q3 (% change compared to previous quarter, seasonal and calendar adjusted).png
(
file
)
22 KB
1
12:38, 19 December 2016
Total nominal hourly labour cost, Business economy, 2016 Q2 (% change compared to previous quarter, seasonal and calendar adjusted).png
(
file
)
22 KB
1
12:29, 19 December 2016
Nominal hourly labour costs, Whole economy, 2016 Q3, by country (% change compared with the same quarter of the previous year and calendar adjusted).png
(
file
)
17 KB
1
12:43, 29 November 2016
Figure 3 - minimum wages 2016 July.png
(
file
)
50 KB
1
13:23, 23 November 2016
Figure 3 - minimum wages 2015 January.png
(
file
)
17 KB
1
13:17, 23 November 2016
Minimum wage statistics YB2016S2fig4upd.xlsx
(
file
)
43 KB
1
13:14, 23 November 2016
Earn mw OCT1stReal.xls
(
file
)
46 KB
1
11:22, 1 April 2016
Labour costs per hour in EUR, breakdown by economic activity 2014.png
(
file
)
29 KB
2
11:19, 1 April 2016
Labour costs per hour in national currency for non-euro area Member States, whole economy excluding agriculture and public administration 2004-2014.png
(
file
)
15 KB
2
11:19, 1 April 2016
Labour costs per hour in EUR, 2004-2014 whole economy excluding agriculture and public administration.png
(
file
)
50 KB
2
First page
Previous page
Next page
Last page
Special page
ISSN 2443-8219
.png)
.png)


,_seasonally_adjusted,_January_2011_-_April_2019.png)
.png)
.png)
.png)


.png)
.png)
.png)
_F1.png)


_F2.png)
,_seasonally_adjusted,_January_2006_-_February_2017.png)


_T2.png)
_T1.png)


.png)

.png)
.png)
.png)


