Tutorials
Log in
Statistics Explained
menu
search
search
Navigation
Main page
Statistical themes
Glossary
Categories
Statistics 4 beginners
Tutorials
Help
Eurostat home
Education corner
Online publications
Regional yearbook
Sustainable development
Full list
Tools
User contributions
Logs
View user groups
Special pages
search
Navigation
Main page
Statistical themes
Glossary
Categories
Statistics 4 beginners
Tutorials
Help
Eurostat home
Education corner
Online publications
Regional yearbook
Sustainable development
Full list
Tools
User contributions
Logs
View user groups
Special pages
Navigation
Main page
Statistical themes
Glossary
Categories
Statistics 4 beginners
Tutorials
Help
Eurostat home
Education corner
Online publications
Regional yearbook
Sustainable development
Full list
Tools
User contributions
Logs
View user groups
Special pages
Uploads by Huartth
This special page shows all uploaded files.
File list
Items per page:
20
50
100
250
500
Search for media name:
Username:
Include old versions of files
Go
First page
Previous page
Next page
Last page
Date
Name
Thumbnail
Size
Description
Versions
15:38, 25 October 2018
T1 Employment in sport (1 000) and average annual growth rates in sport and in total employment (%), 2012–17.png
(
file
)
60 KB
3
16:25, 25 September 2018
Tab01 Cultural sectors covered by EU business statistics.png
(
file
)
39 KB
Reverted to version as of 10:22, 25 September 2018
4
15:25, 25 September 2018
Tab07 Survival rate after 1, 3 and 5 years of cultural enterprises.png
(
file
)
93 KB
1
15:03, 25 September 2018
Tab07 Survival rate after 1, 3 and 5 years of cultural enterprises born in 2011 (%).png
(
file
)
93 KB
1
15:03, 25 September 2018
Tab06 Key size-class indicators for enterprises in selected cultural sectors, EU-28.png
(
file
)
64 KB
4
12:09, 25 September 2018
Tab01 Cultural sectors covered by EU business statistics png.png
(
file
)
39 KB
2
16:32, 6 February 2018
Fig05 People with tertiary education employed in sport.png
(
file
)
36 KB
1
16:31, 6 February 2018
Fig04 People with tertiary education employed in sport and in total employment.png
(
file
)
39 KB
1
16:31, 6 February 2018
Fig03 People aged 15–29 employed in sport and in total employment.png
(
file
)
40 KB
1
13:50, 5 December 2017
Table 5 Cultural participation by country of birth, by cultural activity.png
(
file
)
50 KB
1
13:49, 5 December 2017
Figure 7 Cultural participation by country of birth.png
(
file
)
64 KB
2
12:57, 1 December 2017
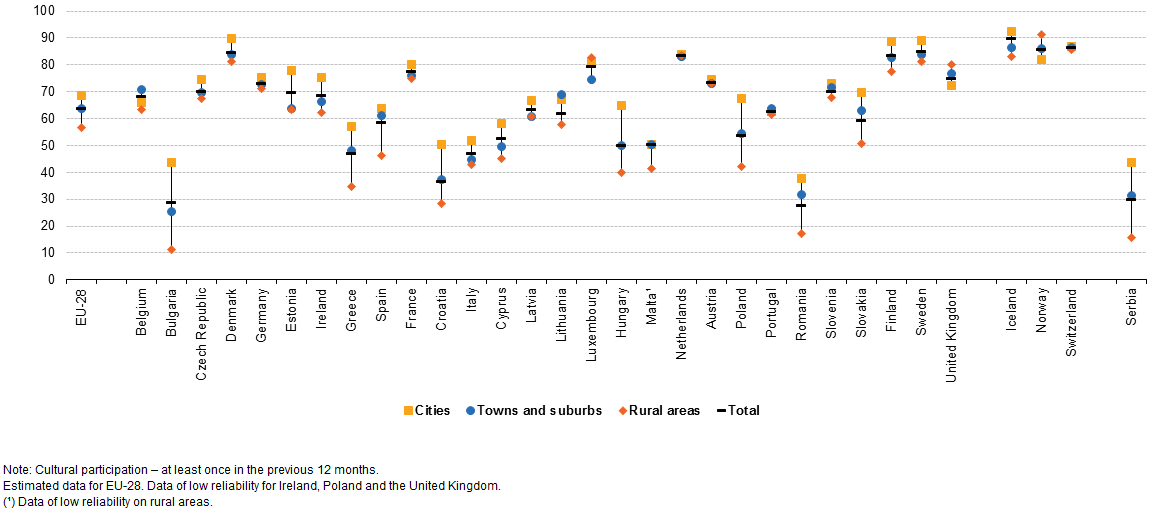
Figure 6 Cultural participation of people living in rural areas, by cultural activity.png
(
file
)
47 KB
1
12:57, 1 December 2017
Figure 5 Cultural participation, by degree of urbanisation.png
(
file
)
28 KB
1
15:19, 18 May 2017
Tab08 Survival rate after 1, 3 and 5 years of cultural enterprises (%).png
(
file
)
77 KB
6
15:19, 18 May 2017
Fig04 Survival rate after 1 and 5 years of enterprises in the sector 'Creative, arts and entertainment activities' (%).png
(
file
)
31 KB
2
12:47, 11 May 2017
Tab07 Apparent labour productivity in selected cultural sectors, by class-size of enterprise (thousand EUR per capita).png
(
file
)
59 KB
4
14:52, 31 March 2017
Tab05 Value added in cultural sectors (% of value added in total services).png
(
file
)
66 KB
3
16:11, 30 March 2017
Tab04 Value added in cultural sectors, EU-28 (million EUR).png
(
file
)
30 KB
2
16:11, 30 March 2017
Tab03 Turnover in cultural sectors over time (million EUR).png
(
file
)
35 KB
2
16:10, 30 March 2017
Tab02 Key indicators on cultural enterprises and those in total business economy services.png
(
file
)
72 KB
2
16:09, 30 March 2017
Fig02 Value added in cultural sectors (% of value added in total services).png
(
file
)
41 KB
2
07:17, 30 March 2017
Fig01 Number of cultural enterprises and generated turnover, as a percentage of total services (%).png
(
file
)
47 KB
1
15:48, 16 February 2017
Figure 9 Share of self-employed among 'creative and performing artists, authors, journalists and linguists', compared with total employment (%).png
(
file
)
34 KB
3
11:13, 10 February 2017
Figure 2 Cultural and total employment in the EU over time.png
(
file
)
20 KB
1
00:11, 10 February 2017
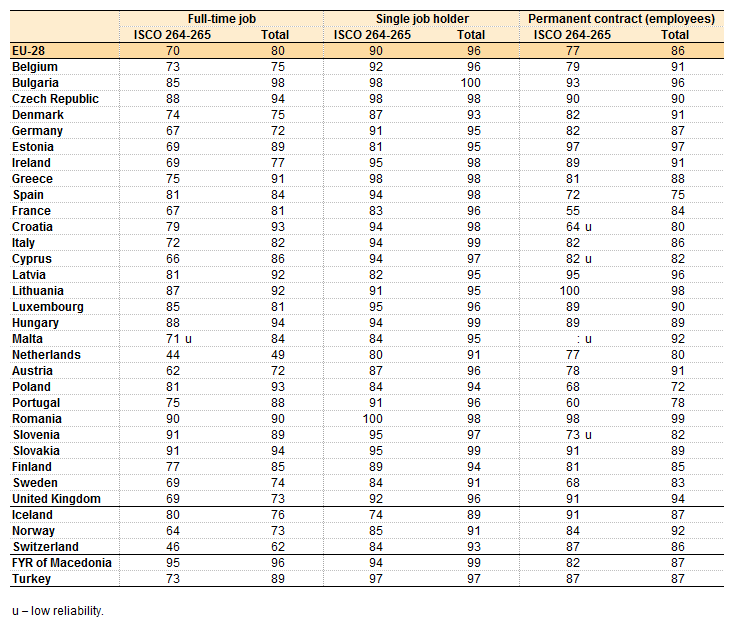
Table 3 Employment characteristics of ISCO 264-265, compared with total employment (%).png
(
file
)
34 KB
1
00:10, 10 February 2017
Table 2 AAGR of total and cultural employment.png
(
file
)
72 KB
1
00:09, 10 February 2017
Figure 8 Persons with tertiary educational attainment in cultural employment and in total employment (%).png
(
file
)
34 KB
1
00:09, 10 February 2017
Figure 7 Persons in cultural employment by educational attainment level.png
(
file
)
51 KB
1
00:08, 10 February 2017
Figure 6 Total unemployment rate by age group, EU.png
(
file
)
33 KB
1
00:07, 10 February 2017
Figure 5 Persons aged 15–29 in cultural employment over time (%).png
(
file
)
38 KB
1
00:07, 10 February 2017
Figure 4 Persons aged 15–29 in cultural employment and in total employment (%).png
(
file
)
34 KB
1
00:07, 10 February 2017
Figure 3 Women in cultural employment and in total employment (%).png
(
file
)
38 KB
1
00:06, 10 February 2017
Figure 2 Cultural and total employment in the EU over time.PNG
(
file
)
20 KB
1
18:45, 13 January 2017
Fig09Share of self-employed among 'creative and performing artists, authors, journalists and linguists', compared with total employment.png
(
file
)
34 KB
1
13:20, 13 January 2017
Tab03Employment characteristics of ISCO 264-265, compared with total employment.png
(
file
)
34 KB
1
13:20, 13 January 2017
Tab02AAGR of total and cultural employment.png
(
file
)
76 KB
1
13:19, 13 January 2017
Tab01Cultural employment.png
(
file
)
32 KB
1
13:19, 13 January 2017
Fig08Persons with tertiary educational attainment in cultural employment and in total employment.png
(
file
)
36 KB
1
13:19, 13 January 2017
Fig07Persons in cultural employment by educational attainment level.png
(
file
)
46 KB
1
13:18, 13 January 2017
Fig06Total unemployment rate by age group, EU-28.png
(
file
)
33 KB
1
13:18, 13 January 2017
Fig05Persons aged 15–29 in cultural employment.png
(
file
)
38 KB
1
13:18, 13 January 2017
Fig04Persons aged 15–29 in cultural employment and in total employment.png
(
file
)
34 KB
1
13:18, 13 January 2017
Fig03Women in cultural employment and in total employment.png
(
file
)
38 KB
1
13:10, 13 January 2017
Cultural employment 2015.xlsx
(
file
)
847 KB
11
12:05, 13 January 2017
Fig01Cultural employment (% of total employment).png
(
file
)
34 KB
1
09:44, 5 July 2016
Value added in cultural sectors, EU-28, 2011–13.png
(
file
)
23 KB
1
09:32, 5 July 2016
Cultural sectors covered by EU business statistics.png
(
file
)
23 KB
1
09:18, 5 July 2016
Annual growth rates and CAGR of total and cultural employment, 2008–10 versus 2011–14 (%).png
(
file
)
68 KB
1
08:36, 4 July 2016
Share of self-employed among 'creative and performing artists, authors, journalists and linguists', compared with total employment, 2014 (¹) (%).png
(
file
)
34 KB
1
16:52, 30 June 2016
Employment in newly born enterprises in 'Specialised design' and 'Creative, arts and entertainment' activities, 2013 (% of total employment in the sector of activity).png
(
file
)
31 KB
5
First page
Previous page
Next page
Last page
Special page
ISSN 2443-8219
_and_average_annual_growth_rates_in_sport_and_in_total_employment_(%25),_2012%E2%80%9317.png)


.png)


.png)
.png)
.png)
.png)
.png)
.png)

.png)
.png)
.png)

.png)

.png)


.png)
.png)
.png)


.png)


.png)
_(%25).png)
.png)