Tutorials
Log in
Statistics Explained
menu
search
search
Navigation
Main page
Statistical themes
Glossary
Categories
Statistics 4 beginners
Tutorials
Help
Eurostat home
Education corner
Online publications
Regional yearbook
Sustainable development
Full list
Tools
User contributions
Logs
View user groups
Special pages
search
Navigation
Main page
Statistical themes
Glossary
Categories
Statistics 4 beginners
Tutorials
Help
Eurostat home
Education corner
Online publications
Regional yearbook
Sustainable development
Full list
Tools
User contributions
Logs
View user groups
Special pages
Navigation
Main page
Statistical themes
Glossary
Categories
Statistics 4 beginners
Tutorials
Help
Eurostat home
Education corner
Online publications
Regional yearbook
Sustainable development
Full list
Tools
User contributions
Logs
View user groups
Special pages
Uploads by Horvaju
This special page shows all uploaded files.
File list
Items per page:
20
50
100
250
500
Search for media name:
Username:
Include old versions of files
Go
First page
Previous page
Next page
Last page
Date
Name
Thumbnail
Size
Description
Versions
11:31, 9 October 2024
2024-Air pollution-figures.xlsx
(
file
)
27 KB
1
11:18, 9 October 2024
Emissions of air pollutants, EU, 1990-2022 (Index 1990=100).png
(
file
)
54 KB
1
13:48, 8 August 2024
Quarterly GHG Figures for Q1 2024 SE article Aug2024.xlsx
(
file
)
352 KB
1
12:12, 8 August 2024
F1Greenhouse gas emissions by the economy and GDP, EU, Q1 2021 - Q1 2024.png
(
file
)
54 KB
1
12:06, 8 August 2024
F3Growth rates of greenhouse gas emissions by the economy and GDP, Q1 2024.png
(
file
)
53 KB
1
12:02, 8 August 2024
F2Growth rates of greenhouse gas emissions by the economy, EU, Q1 2024.png
(
file
)
32 KB
1
11:51, 8 August 2024
F1Greenhouse gas emissions by the economy and GDP, EU, 2021Q1 - 2024Q1.png
(
file
)
54 KB
1
15:57, 12 July 2024
Water statistics 2024 rev1.xlsx
(
file
)
302 KB
1
15:55, 12 July 2024
Share of the population connected to at least secondary urban wastewater treatment, 2000-2022 (%).png
(
file
)
47 KB
2
15:53, 12 July 2024
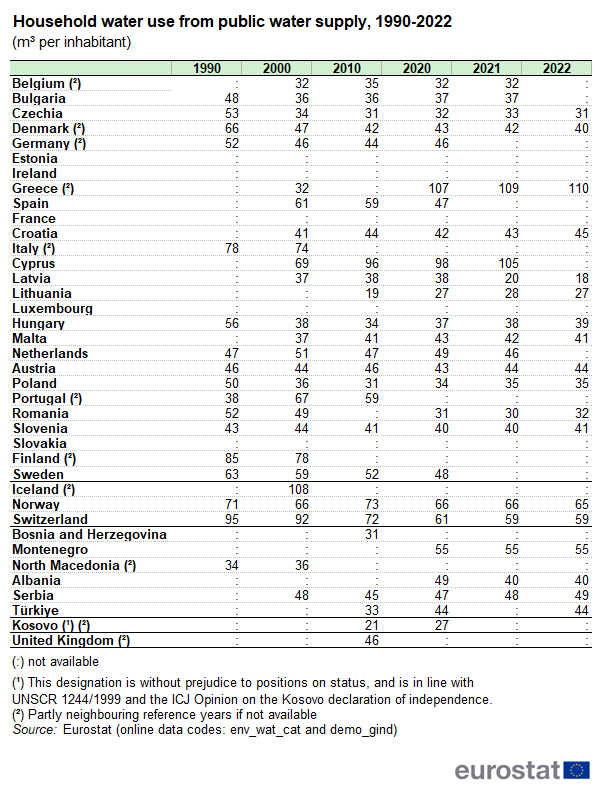
Household water use from public water supply, 1990-2022 (m³ per inhabitant).png
(
file
)
44 KB
2
15:51, 12 July 2024
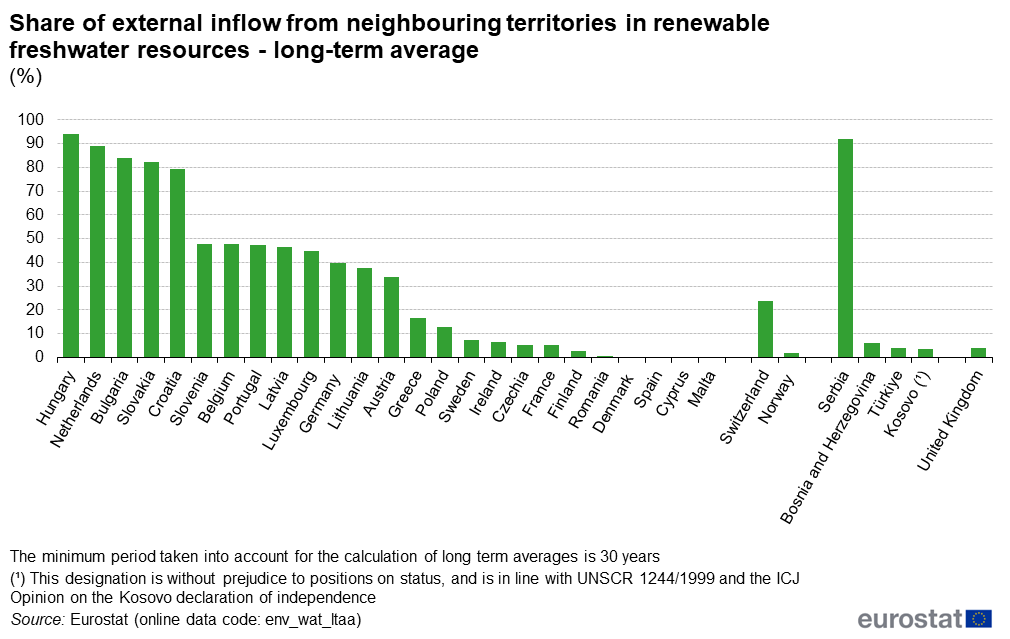
Share of external inflow from neighbouring territories in renewable freshwater resources - long-term average (%).png
(
file
)
60 KB
7
15:44, 12 July 2024
Share of external inflow from neighbouring territories in renewable freshwater resources - long-term average.png
(
file
)
60 KB
5
15:39, 12 July 2024
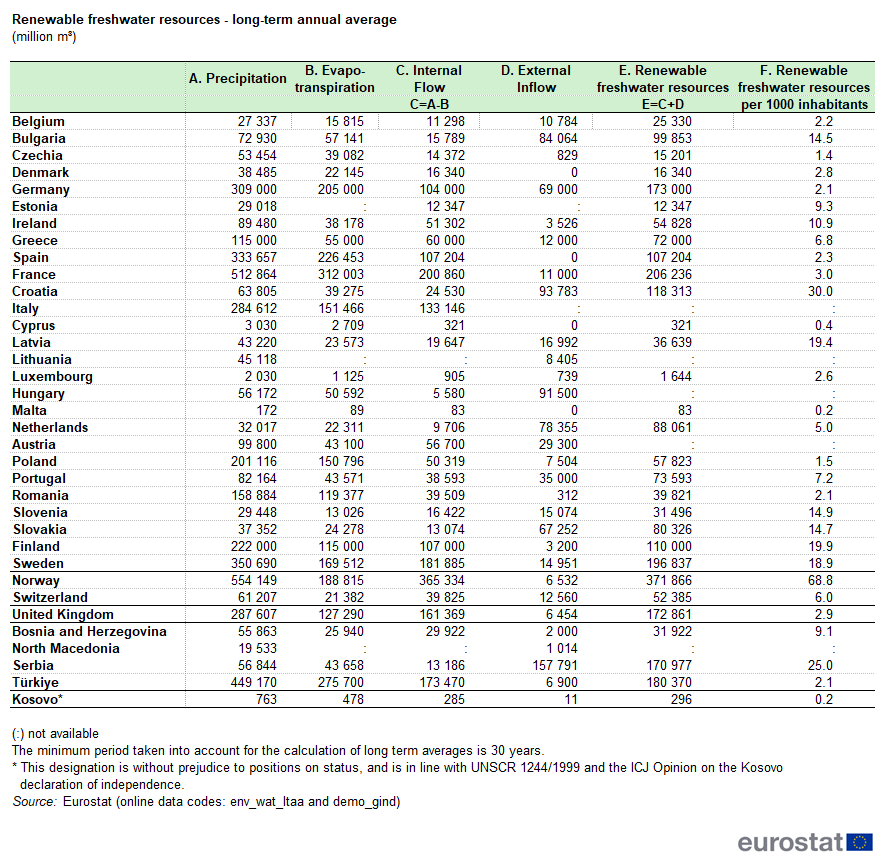
Renewable freshwater resources - long-term annual average.png
(
file
)
116 KB
4
09:53, 11 July 2024
Water statistics 2024.xlsx
(
file
)
302 KB
1
09:33, 11 July 2024
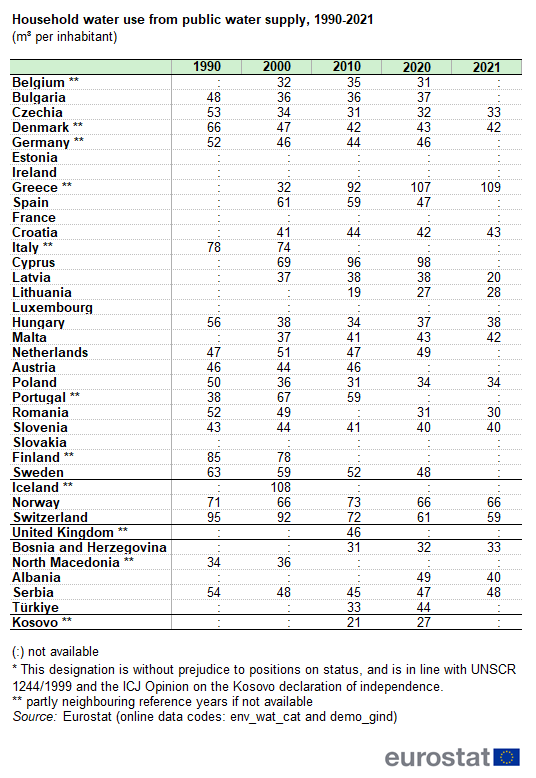
Household water use from public water supply, 1990-2021 (m³ per inhabitant).png
(
file
)
44 KB
4
09:26, 11 July 2024
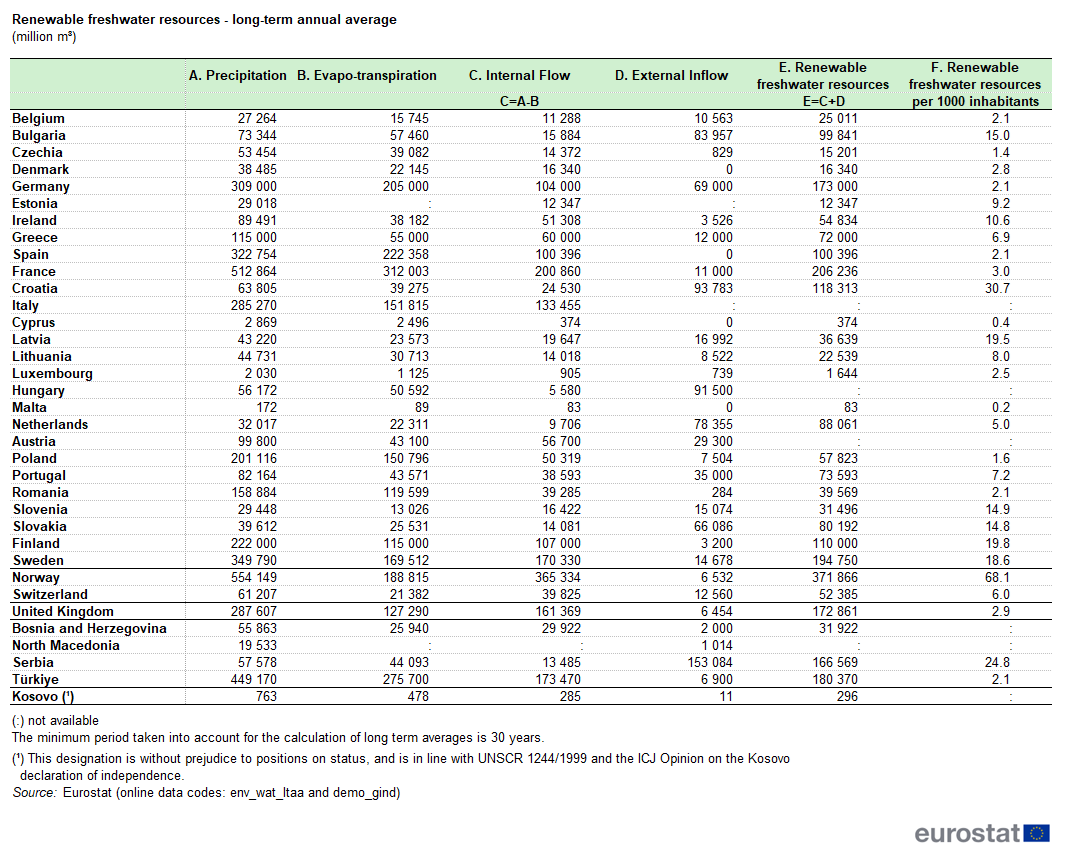
Renewable freshwater resources - long-term annual average (million m³).png
(
file
)
115 KB
10
10:46, 8 May 2024
Quarterly GHG Figures for Q4 2023 SE article May2024.xlsx
(
file
)
371 KB
1
09:50, 8 May 2024
F2Growth rates of greenhouse gas emissions by the economy, EU, Q4 2023.png
(
file
)
32 KB
1
09:48, 8 May 2024
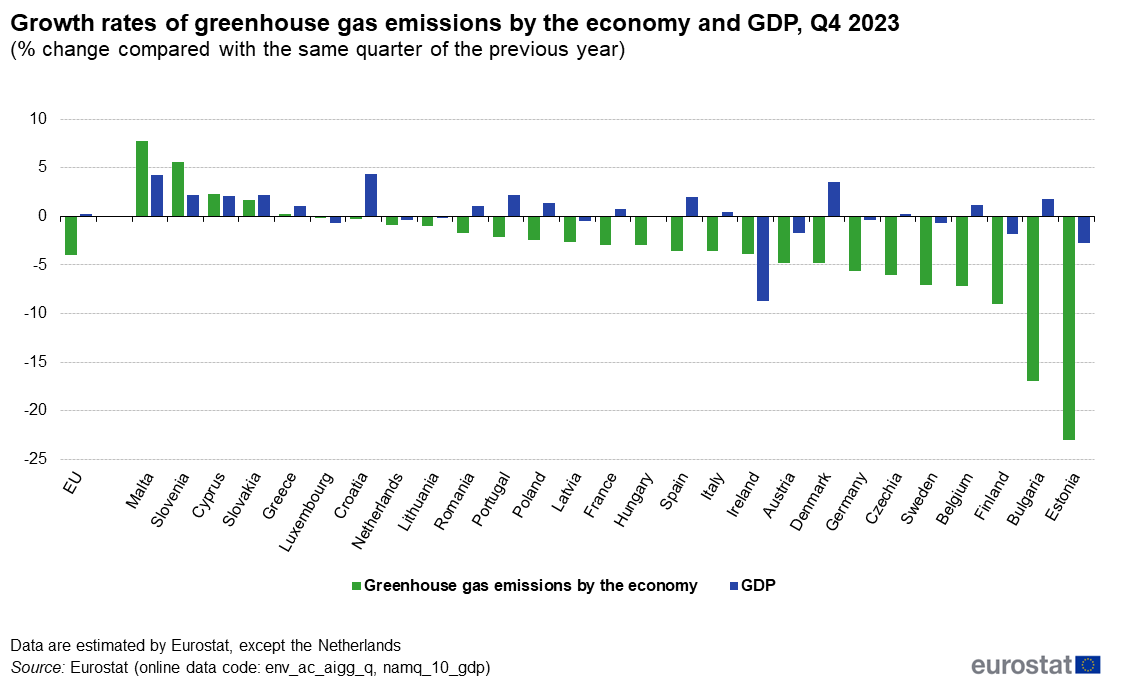
Growth rates of greenhouse gas emissions by the economy, EU, Q4 2023.png
(
file
)
32 KB
1
09:46, 8 May 2024
F3Growth rates of greenhouse gas emissions by the economy and GDP, Q4 2023.png
(
file
)
52 KB
1
09:38, 8 May 2024
F2Growth rates of greenhouse gas emissions by economic sector (% change compared with the same quarter of the previous year, EU, Q4 2023).png
(
file
)
32 KB
1
09:33, 8 May 2024
F1Greenhouse gas emissions by the economy and GDP, EU, 2020Q4 - 2023Q4.png
(
file
)
55 KB
1
11:34, 7 May 2024
Net greenhouse gas emissions (including international aviation, including LULUCF) trend, EU, 1990 - 2022V1.png
(
file
)
31 KB
2
11:30, 7 May 2024
Copy of 2024-GHG statistics tables and figuresREV.xlsx
(
file
)
31 KB
1
11:29, 7 May 2024
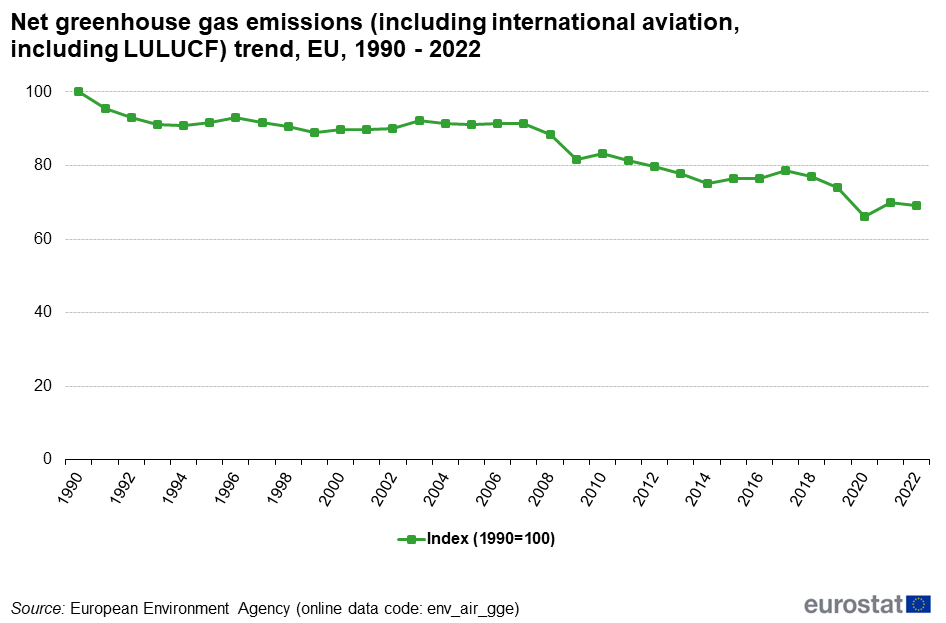
Net greenhouse gas emissions (including international aviation, including LULUCF) trend, EU, 1990 - 2022.png
(
file
)
31 KB
2
10:25, 6 May 2024
2024-GHG statistics tables and figures.xlsx
(
file
)
31 KB
1
10:15, 9 February 2024
Quarterly GHG Figures for Q3 2023 SE article Feb2024.xlsx
(
file
)
386 KB
1
13:05, 8 February 2024
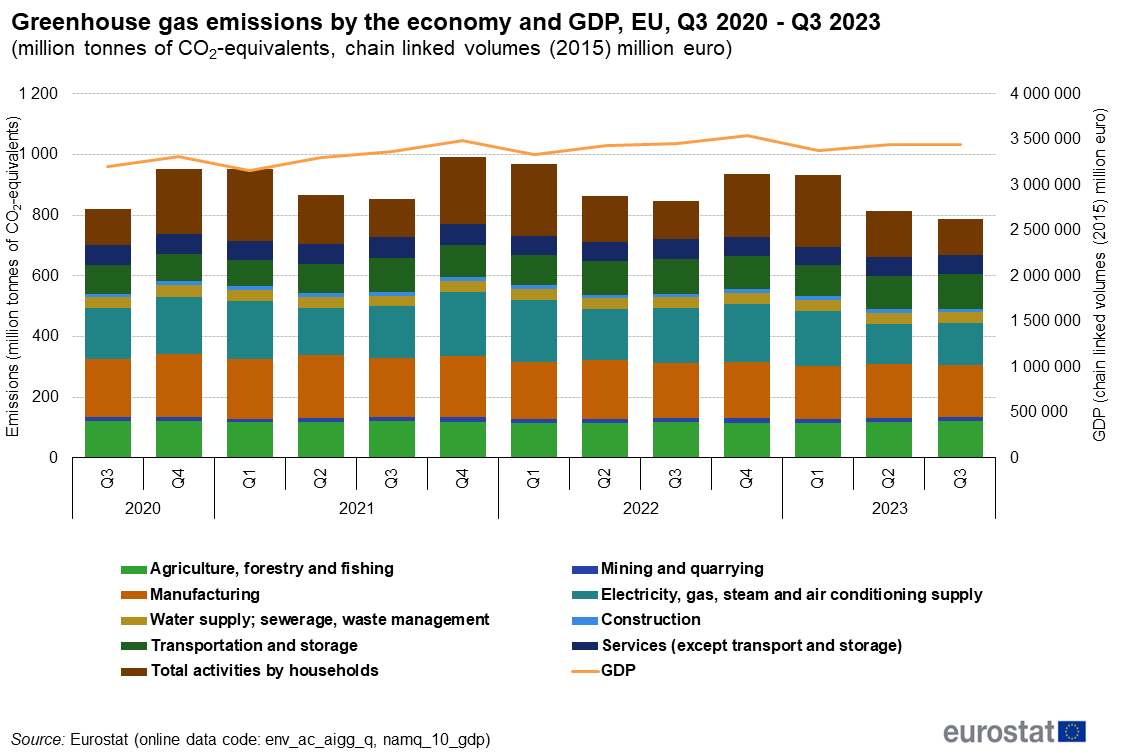
Greenhouse gas emissions by the economy and GDP, EU, Q3 2020 - Q3 2023.png
(
file
)
61 KB
1
13:00, 8 February 2024
F3Growth rates of greenhouse gas emissions by economy and GDP (% change compared with the same quarter of the previous year, Q3 2023).png
(
file
)
43 KB
1
12:58, 8 February 2024
F2Growth rates of greenhouse gas emissions by economic sector (% change compared with the same quarter of the previous year, EU, Q3 2023).png
(
file
)
33 KB
1
12:56, 8 February 2024
F1Greenhouse gas emissions by economic sector and GDP.png
(
file
)
61 KB
2
15:40, 23 January 2024
Industrial emission statistics-figures 2024-01.xlsx
(
file
)
134 KB
1
15:35, 23 January 2024
Air emissions, energy taxes, employment and gross value added in industry sectors (NACE B-E), EU, 2021.png
(
file
)
33 KB
1
14:40, 23 January 2024
Air emissions, gross value added and employment in industry sectors (NACE B - E), EU-27, 2010 - 2021 Index 2010=100.png
(
file
)
59 KB
1
10:48, 15 December 2023
Air pollution statistics - air emissions accounts DC2023.xlsx
(
file
)
698 KB
1
10:39, 15 December 2023
Greenhouse gas emission statistics - air emissions accounts DC2023.xlsx
(
file
)
11.55 MB
1
15:17, 14 December 2023
Ozone precursor emissions and gross value added by 64 production activities (NACE), EU, 2021 (cumulated %).png
(
file
)
66 KB
1
15:15, 14 December 2023
Ozone precursor emissions by economic activity and chemical compound, EU, 2021 (thousand tonnes of NMVOC equivalents).png
(
file
)
38 KB
1
15:14, 14 December 2023
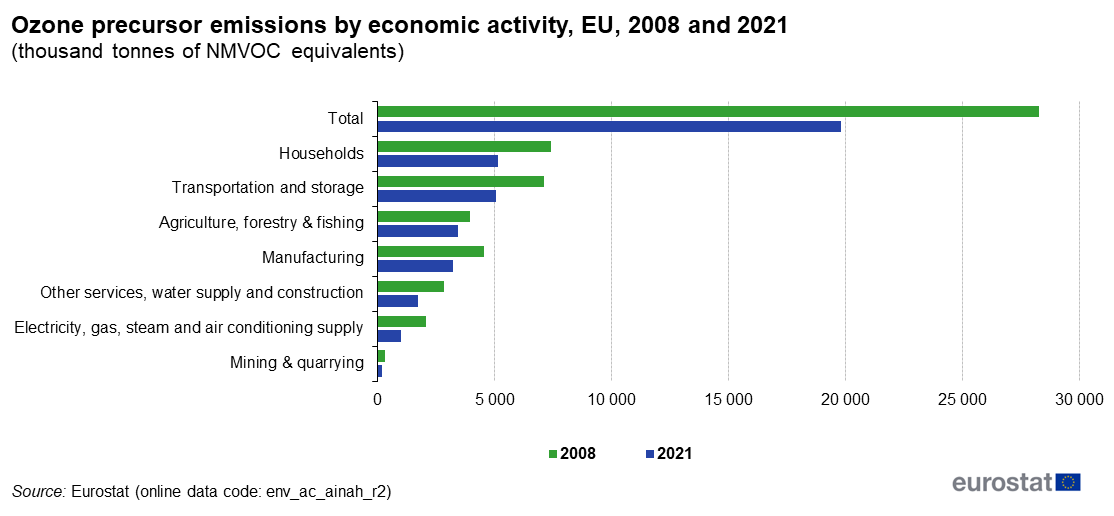
Ozone precursor emissions by economic activity, EU, 2008 and 2021 (thousand tonnes of NMVOC equivalents).png
(
file
)
31 KB
1
15:12, 14 December 2023
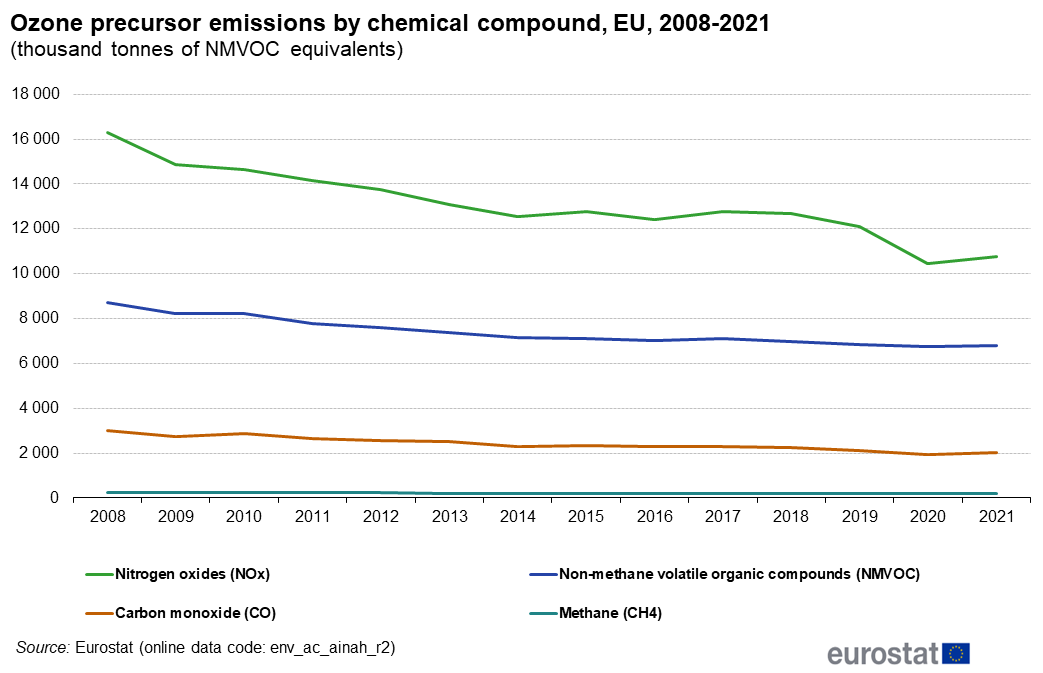
Ozone precursor emissions by chemical compound, EU, 2008-2021 (thousand tonnes of NMVOC equivalents).png
(
file
)
33 KB
1
15:10, 14 December 2023
Acidifying gas emissions and gross value added by 64 production activities (NACE), EU, 2021 (cumulated %).png
(
file
)
85 KB
1
15:09, 14 December 2023
Acidifying gas emissions by economic activity and chemical compound, EU, 2021 (thousand tonnes of SO2 equivalents).png
(
file
)
35 KB
1
15:07, 14 December 2023
Acidifying gas emissions by economic activity, EU, 2008 and 2021 (thousand tonnes of SO2 equivalents).png
(
file
)
32 KB
1
13:20, 14 December 2023
Acidifying gas emissions by chemical compound, EU, 2008-2021 (thousand tonnes of SO2 equivalents).png
(
file
)
34 KB
2
11:10, 14 December 2023
Greenhouse gas emissions by economic activity, 2022 (thousand tonnes of CO2 equivalents).png
(
file
)
70 KB
1
10:46, 14 December 2023
Greenhouse gas emissions and gross value added by 64 production activities (NACE), EU, 2021 (cumulated %).png
(
file
)
177 KB
1
09:00, 14 December 2023
Greenhouse gas emissions and gross value added by 64 production activities (NACE), EU-27, 2021 (cumulated %).png
(
file
)
177 KB
2
14:44, 13 December 2023
Figure 2 Greenhouse gas emissions by economic activity and by pollutant, EU, 2022 (thousand tonnes of CO2 equivalents).png
(
file
)
38 KB
1
14:04, 13 December 2023
Figure 1 Greenhouse gas emissions by economic activity, EU-27, 2008 and 2022.png
(
file
)
35 KB
1
17:40, 9 November 2023
Quarterly GHG Figures for Q2 2023 SE article Nov2023.xlsx
(
file
)
381 KB
1
First page
Previous page
Next page
Last page
Special page
ISSN 2443-8219
.png)


.png)
.png)
.png)


.png)
.png)


.png)

_trend,_EU,_1990_-_2022V1.png)
_trend,_EU,_1990_-_2022.png)

.png)
.png)

,_EU,_2021.png)
,_EU-27,_2010_-_2021_Index_2010%3D100.png)
,_EU,_2021_(cumulated_%25).png)
.png)
.png)
.png)
,_EU,_2021_(cumulated_%25).png)
.png)
.png)
.png)
.png)
,_EU,_2021_(cumulated_%25).png)
,_EU-27,_2021_(cumulated_%25).png)
.png)
