Tutorials
Log in
Statistics Explained
menu
search
search
Navigation
Main page
Statistical themes
Glossary
Categories
Statistics 4 beginners
Tutorials
Help
Eurostat home
Education corner
Online publications
Regional yearbook
Sustainable development
Full list
Tools
User contributions
Logs
View user groups
Special pages
search
Navigation
Main page
Statistical themes
Glossary
Categories
Statistics 4 beginners
Tutorials
Help
Eurostat home
Education corner
Online publications
Regional yearbook
Sustainable development
Full list
Tools
User contributions
Logs
View user groups
Special pages
Navigation
Main page
Statistical themes
Glossary
Categories
Statistics 4 beginners
Tutorials
Help
Eurostat home
Education corner
Online publications
Regional yearbook
Sustainable development
Full list
Tools
User contributions
Logs
View user groups
Special pages
Uploads by Gwenaelle.lecoroller
This special page shows all uploaded files.
File list
Items per page:
20
50
100
250
500
Search for media name:
Username:
Include old versions of files
Go
First page
Previous page
Next page
Last page
Date
Name
Thumbnail
Size
Description
Versions
11:07, 18 December 2015
HRST Stocks tables figures.xlsx
(
file
)
799 KB
1
12:56, 17 December 2015
The 20 NUTS 1 regions with the highest shares of women working in science and technology occupations (HRSTO), 2013.png
(
file
)
24 KB
4
12:56, 17 December 2015
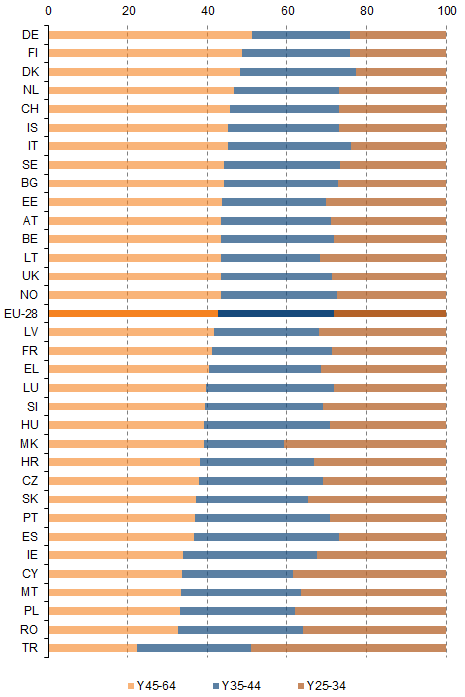
HRST aged 25- 64 years, by age groups, 2013.png
(
file
)
12 KB
3
12:55, 17 December 2015
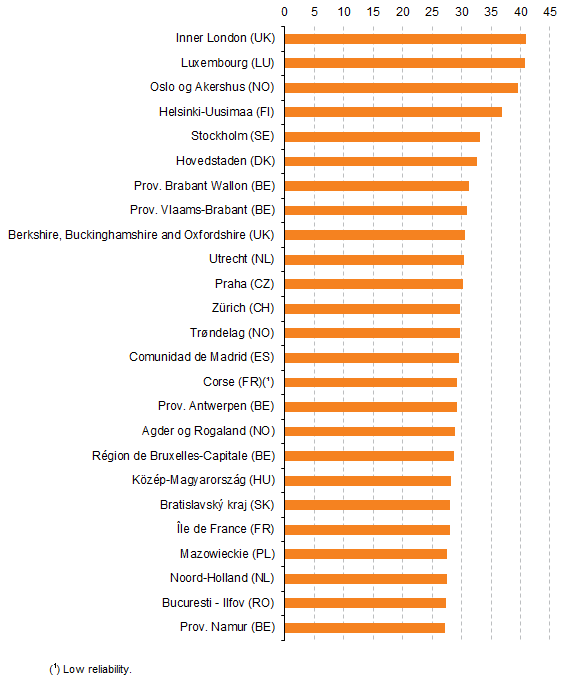
The 25 NUTS 2 regions with the highest shares of HRST core in the active population, 2013.png
(
file
)
22 KB
3
12:55, 17 December 2015
HRST by occupation 2013.png
(
file
)
15 KB
4
15:51, 3 March 2015
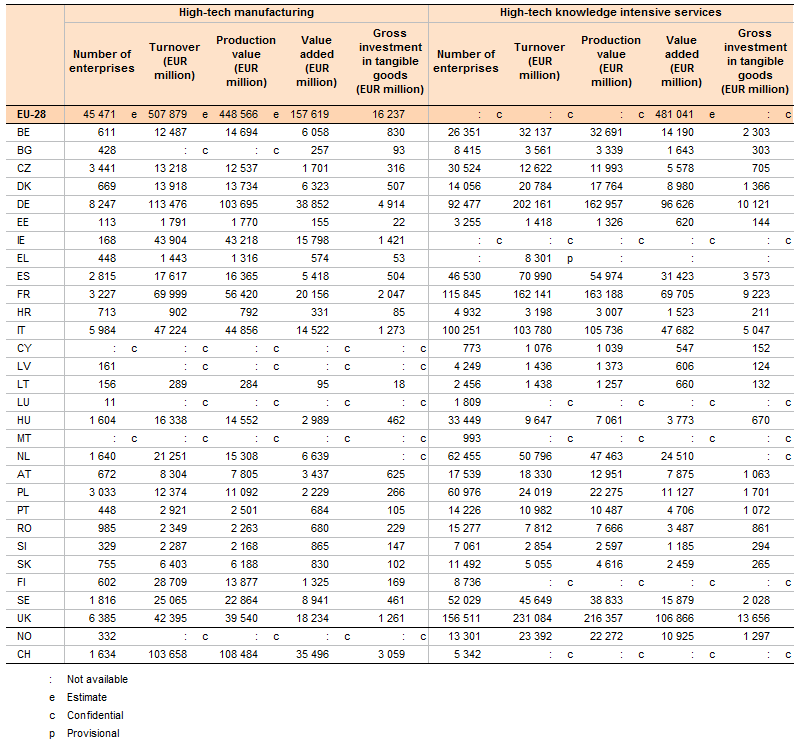
Economic statistics on high tech sectors, EU28, 2012.png
(
file
)
42 KB
3
16:23, 11 February 2015
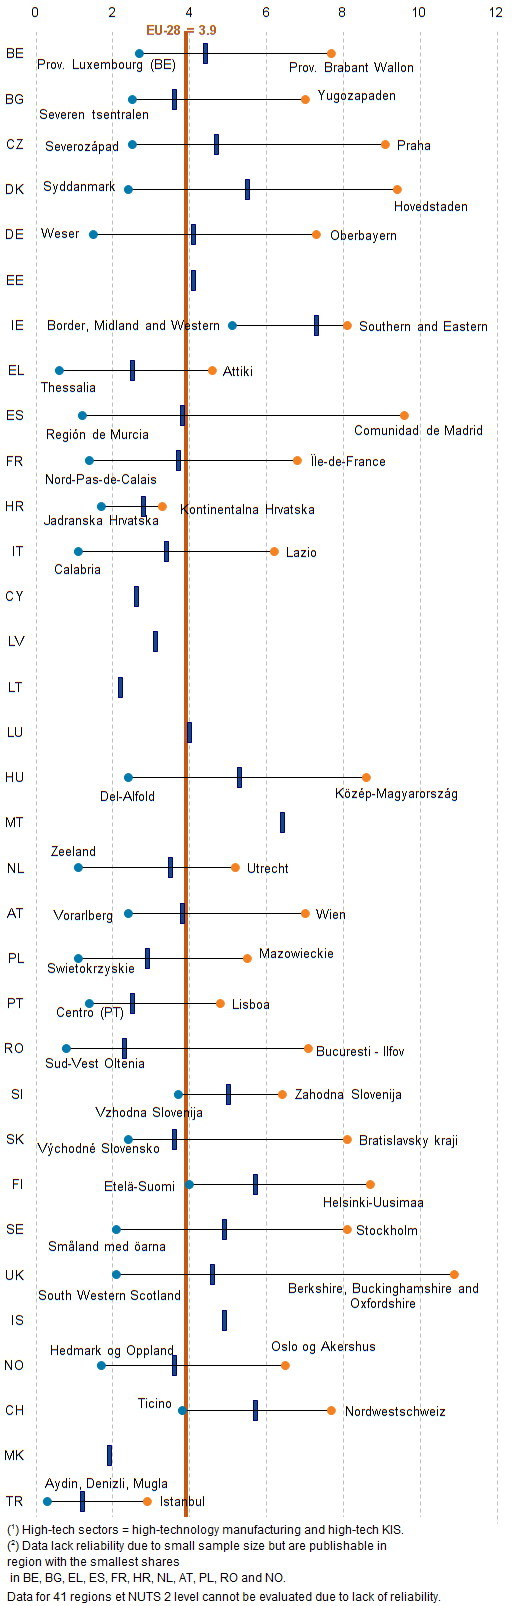
Regional disparities in employment in high-tech sectors as a percentage of total employment (NUTS 2 level), 2012.png
(
file
)
74 KB
4
15:55, 11 February 2015
Statistics on employment in high - tech sectors, EU-27 and selected countries, 2013.png
(
file
)
46 KB
2
18:19, 9 February 2015
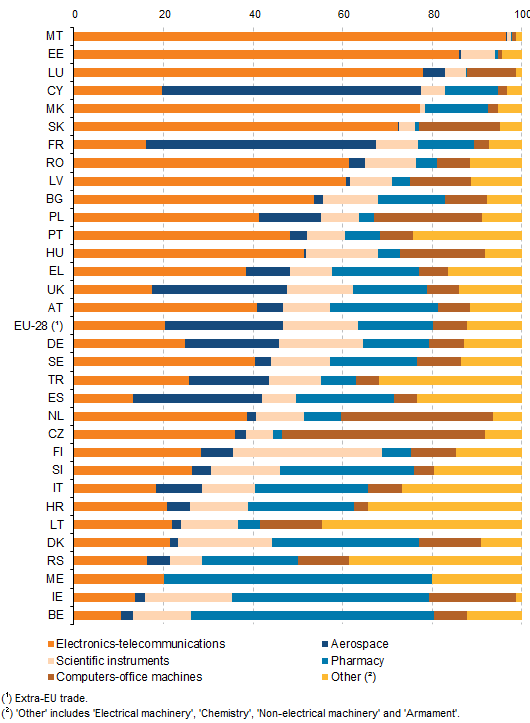
High-tech exports by high-technology group of products, EU-27 and selected countries, 2013.png
(
file
)
19 KB
1
16:20, 29 January 2015
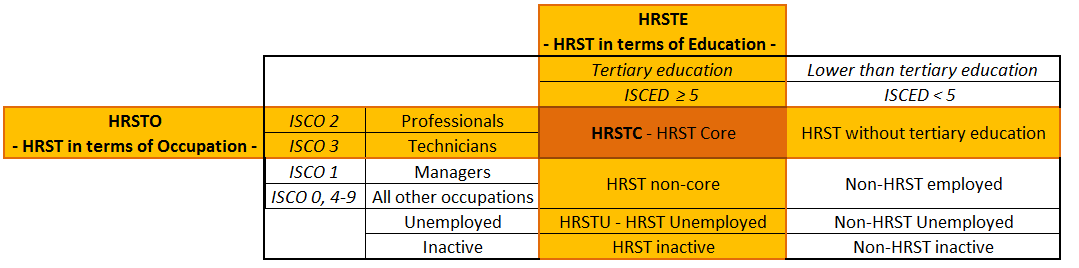
HRST categories.PNG
(
file
)
20 KB
1
17:03, 15 September 2014
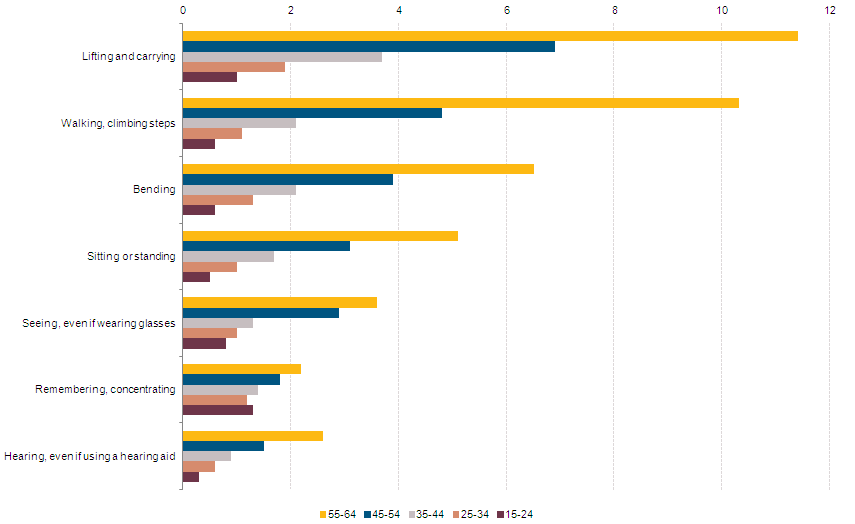
Prevalence of main basic activity difficulties in people aged 15-64, by age group in the EU, 2011 (number of cases per 100 people).PNG
(
file
)
19 KB
1
17:01, 15 September 2014
Prevalence of main basic activity difficulties in people aged 15-64, by sex, in the EU, 2011 (number of cases per 100 people).PNG
(
file
)
13 KB
1
16:58, 15 September 2014
Prevalence of longstanding health problems or diseases in people aged 15-64, by age group, in the EU, 2011 (number of cases per 100 people).PNG
(
file
)
17 KB
1
16:58, 15 September 2014
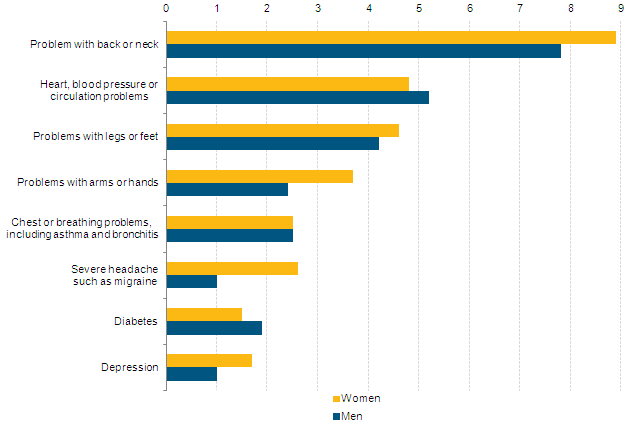
Prevalence of longstanding health problems in people aged 15-64 in the EU, by sex, 2011 (number of cases per 100 people).PNG
(
file
)
16 KB
1
11:24, 10 September 2014
Distribution of demographic characteristics by proxy use, in percentages.jpg
(
file
)
212 KB
4
10:19, 10 September 2014
Non-response rate among those who completed the core LFS, based on target population aged 15-64, calculated using micro-data, in %.PNG
(
file
)
24 KB
2
15:27, 9 September 2014
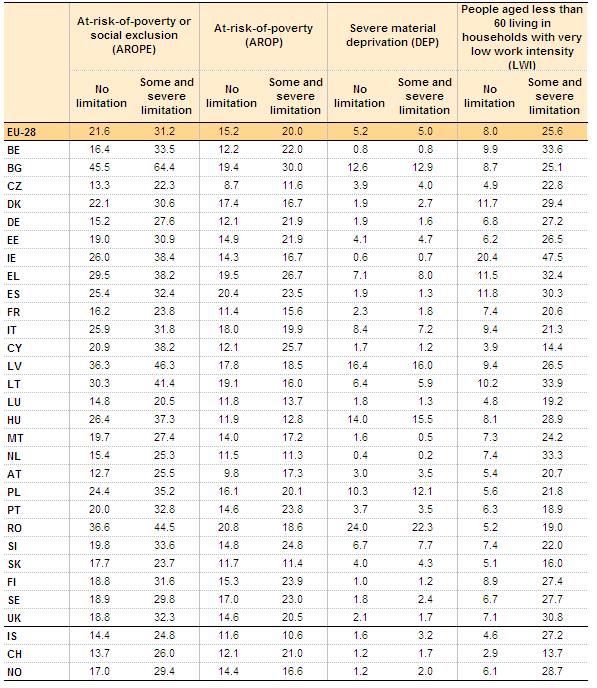
Tab1 People at-risk-of-poverty.JPG
(
file
)
102 KB
1
15:07, 9 September 2014
People with a basic activity difficulty (Definition 1), by type of household, 2011 (%) .JPG
(
file
)
79 KB
1
15:05, 9 September 2014
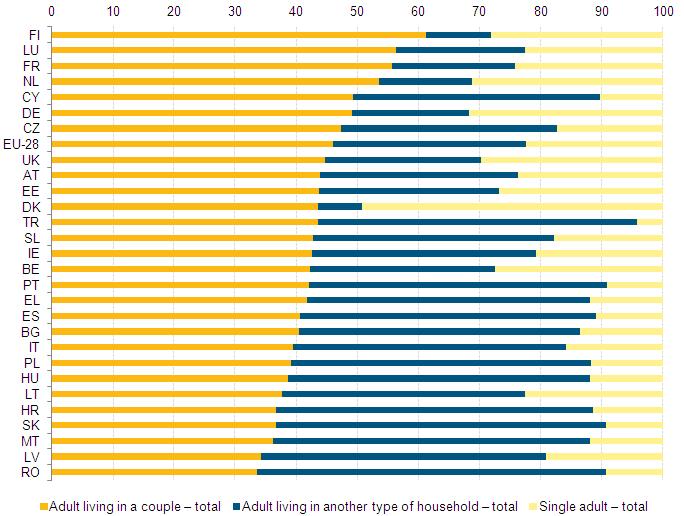
Fig2 composition household disabled.PNG
(
file
)
208 KB
6
17:27, 8 September 2014
Odds ratios of being a direct participant.jpg
(
file
)
88 KB
2
15:20, 8 September 2014
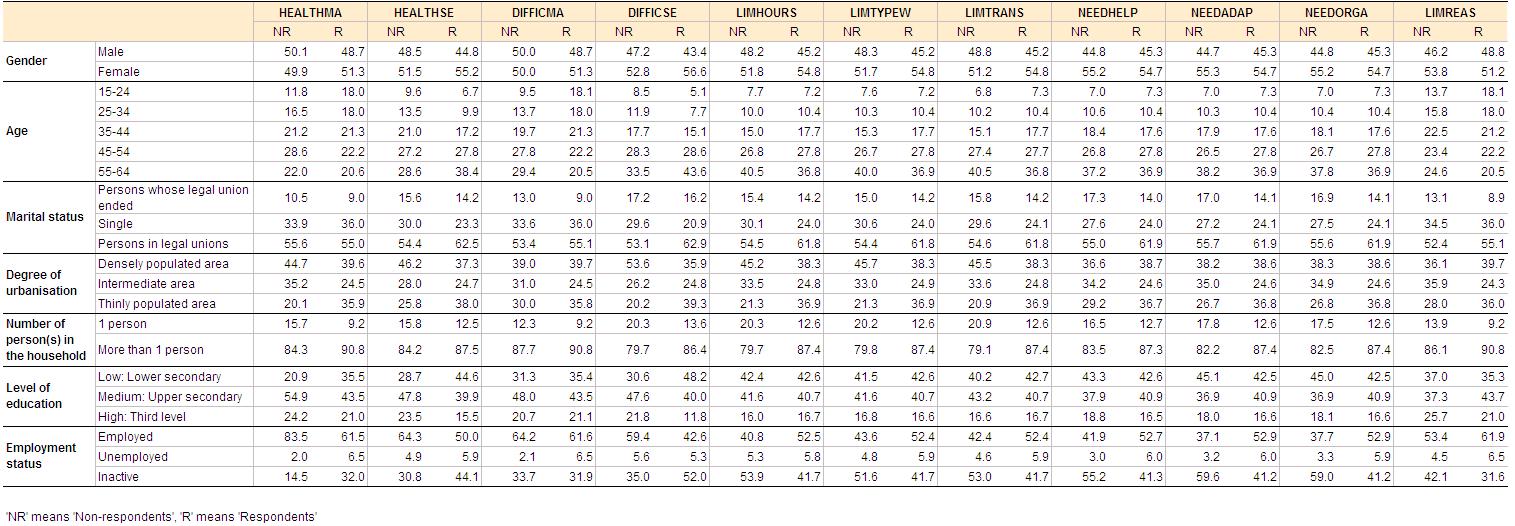
Profiles of respondents and non-respondents broken down by ad-hoc module variables, in percentages.jpg
(
file
)
196 KB
2
14:37, 8 September 2014
Tertiary educational attainment (age group 30-34), by disability status, by country, in %, 2011.JPG
(
file
)
79 KB
1
14:32, 8 September 2014
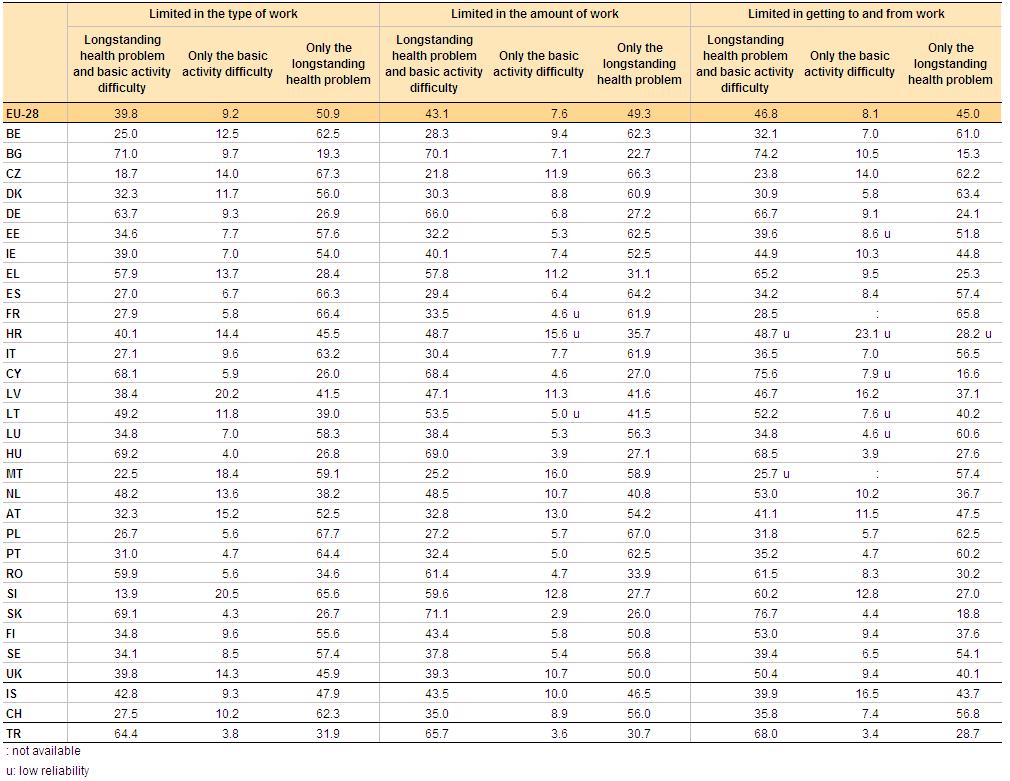
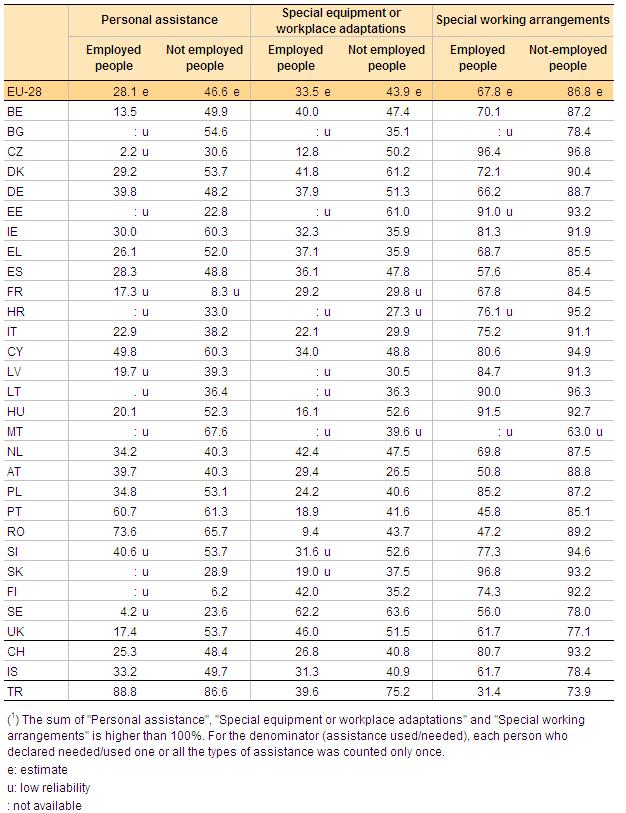
Tab2 kind work limitation.JPG
(
file
)
158 KB
2
14:32, 8 September 2014
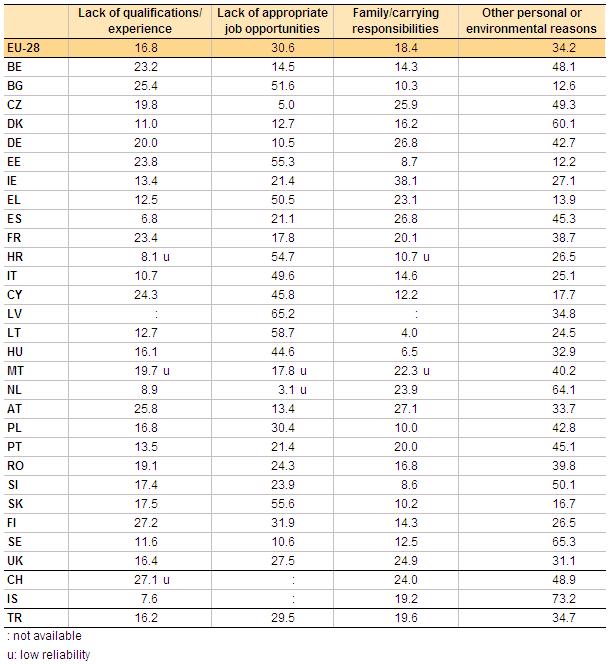
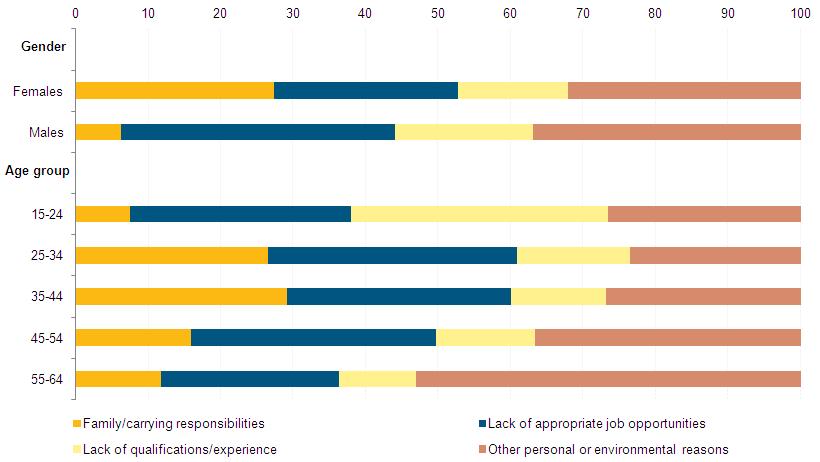
Main personal or environmental reasons for limitations on work, declared by people aged between 15 and 64, 2011 (%).JPG
(
file
)
75 KB
3
14:20, 8 September 2014
Percentage of employed people aged 15-64 who work from home, 2011 (%).JPG
(
file
)
78 KB
2
11:52, 8 September 2014
Tab1 unemployment rate disabled.JPG
(
file
)
63 KB
2
11:37, 8 September 2014
Tab1 Type assistance.JPG
(
file
)
111 KB
1
17:02, 4 September 2014
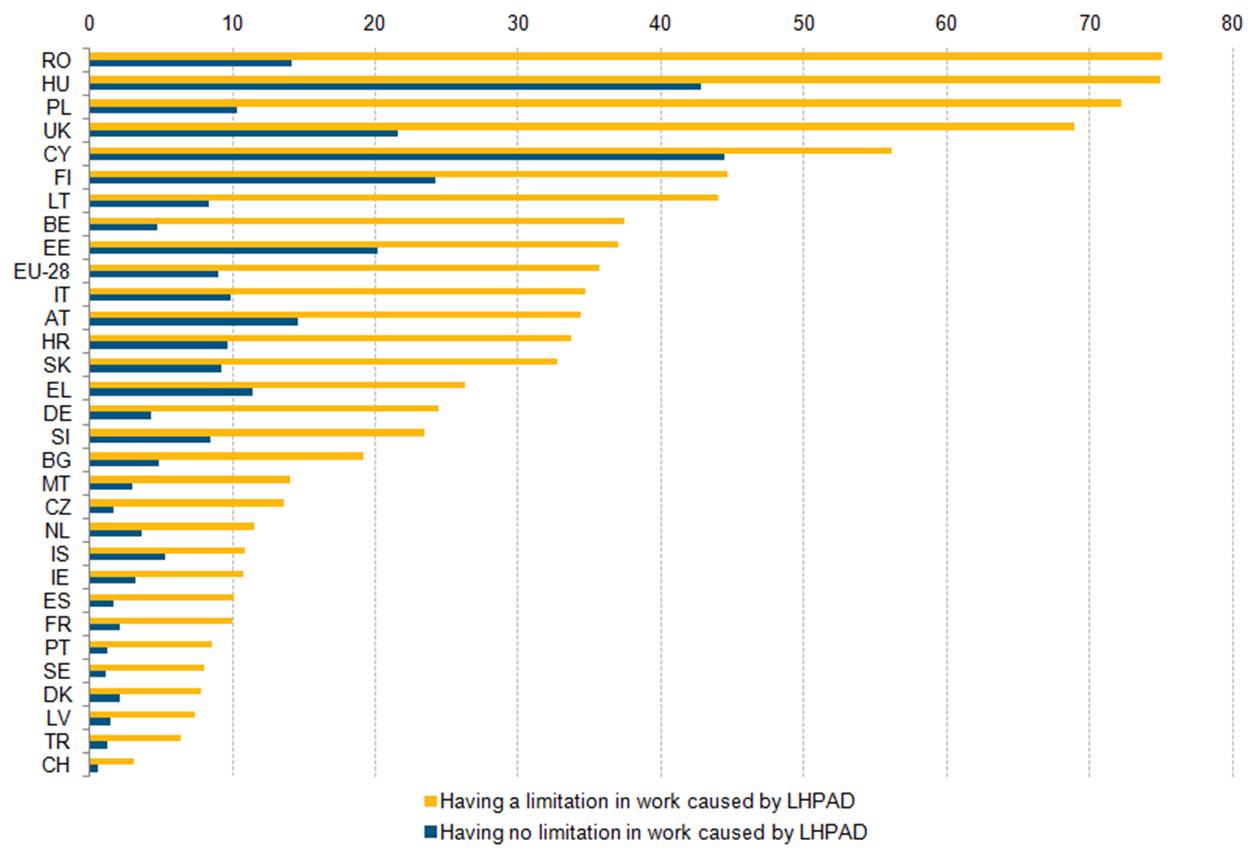
Fig2 limitation work.JPG
(
file
)
167 KB
2
16:58, 4 September 2014
Personal environmental disability.JPG
(
file
)
90 KB
2
16:45, 27 August 2014
Persons aged 15-64 participating in education and training, by country and disability status (1), in %, 2011.JPG
(
file
)
131 KB
1
16:45, 27 August 2014
Highest level of education attained (1) for EU-28, by disability status, in %, 2011.JPG
(
file
)
51 KB
1
16:45, 27 August 2014
Young people (aged 15-34) not in employment and not in any education, by country and disability status, in %, 2011.JPG
(
file
)
112 KB
1
16:45, 27 August 2014
Early school leavers, by country and disability status, in %, 2011.jpg
(
file
)
127 KB
1
15:33, 27 August 2014
Fig3 type assistance gender.JPG
(
file
)
22 KB
1
15:33, 27 August 2014
Fig2 Need use assistance LHPAD.JPG
(
file
)
116 KB
1
15:33, 27 August 2014
Fig1 Need use assistance.JPG
(
file
)
72 KB
1
12:04, 27 August 2014
People aged 15-64 reporting a limitation, for personal or environmental reasons, on the work they can do, broken down by sex and age group, 2011 (%).JPG
(
file
)
42 KB
1
11:39, 27 August 2014
Percentage of skilled manual workers, 2011 (%).JPG
(
file
)
124 KB
1
11:39, 27 August 2014
Percentage of employed people aged 15-64 working part-time, 2011 (%).JPG
(
file
)
113 KB
1
11:39, 27 August 2014
Percentage of employed people aged 15-64 who have supervisory responsibilities, 2011 (%).JPG
(
file
)
120 KB
1
10:18, 27 August 2014
Main reason for leaving last job for not employed persons aged 15-64 having a previous work experience, EU-28, 2011 (in %; missing answers not included).JPG
(
file
)
55 KB
1
10:18, 27 August 2014
Main reason for not seeking employment for inactive persons aged 15-64, EU-28, 2011 (in %; missing answers not included).JPG
(
file
)
58 KB
1
10:16, 27 August 2014
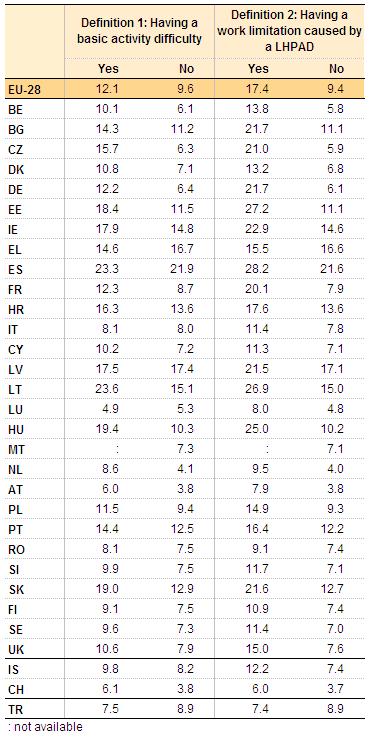
Inactivity rate of persons aged 15-64, by country and disability definition, 2011 (in %) .JPG
(
file
)
111 KB
1
10:15, 27 August 2014
Employment rate of persons aged 15-64, by country and disability definition, 2011 (in %).JPG
(
file
)
115 KB
1
16:03, 26 August 2014
Fig3 employed risk poverty.JPG
(
file
)
58 KB
1
16:02, 26 August 2014
Fig2 At-risk-of-poverty rate.JPG
(
file
)
57 KB
1
16:02, 26 August 2014
The Europe-2020 indicator of at-risk-of-poverty or social exclusion (AROPE).JPG
(
file
)
15 KB
1
15:34, 26 August 2014
Tab1 Arrears.JPG
(
file
)
63 KB
1
15:33, 26 August 2014
Fig4 unable to face financial expenses.JPG
(
file
)
61 KB
1
15:33, 26 August 2014
Fig3 unable to afford a meal with meat.JPG
(
file
)
50 KB
1
First page
Previous page
Next page
Last page
Special page
ISSN 2443-8219
,_2013.png)


,_2012.png)


.PNG)
.PNG)
.PNG)
.PNG)


,_by_type_of_household,_2011_(%25)_.JPG)


,_by_disability_status,_by_country,_in_%25,_2011.JPG)

.JPG)
.JPG)


,_in_%25,_2011.JPG)
_for_EU-28,_by_disability_status,_in_%25,_2011.JPG)
_not_in_employment_and_not_in_any_education,_by_country_and_disability_status,_in_%25,_2011.JPG)


.JPG)
.JPG)
.JPG)
.JPG)
.JPG)
.JPG)
_.JPG)
.JPG)


.JPG)


