Tutorials
Log in
Statistics Explained
menu
search
search
Navigation
Main page
Statistical themes
Glossary
Categories
Statistics 4 beginners
Tutorials
Help
Eurostat home
Education corner
Online publications
Regional yearbook
Sustainable development
Full list
Tools
User contributions
Logs
View user groups
Special pages
search
Navigation
Main page
Statistical themes
Glossary
Categories
Statistics 4 beginners
Tutorials
Help
Eurostat home
Education corner
Online publications
Regional yearbook
Sustainable development
Full list
Tools
User contributions
Logs
View user groups
Special pages
Navigation
Main page
Statistical themes
Glossary
Categories
Statistics 4 beginners
Tutorials
Help
Eurostat home
Education corner
Online publications
Regional yearbook
Sustainable development
Full list
Tools
User contributions
Logs
View user groups
Special pages
Uploads by Gmossuti
This special page shows all uploaded files.
File list
Items per page:
20
50
100
250
500
Search for media name:
Username:
Include old versions of files
Go
First page
Previous page
Next page
Last page
Date
Name
Thumbnail
Size
Description
Versions
15:32, 25 January 2017
Distribution of job-to-job mobility in total KIS sector and in total NACE activities, 2015, in % update v2.PNG
(
file
)
18 KB
1
15:31, 25 January 2017
Distribution of job-to-job mobility by age group, 2015, in % update v2.PNG
(
file
)
19 KB
1
17:32, 10 January 2017
Distribution of job-to-job mobility in total KIS sector and in total NACE activities, 2015, in % update.PNG
(
file
)
19 KB
1
17:31, 10 January 2017
Distribution of job-to-job mobility by age group, 2015, in % update.PNG
(
file
)
19 KB
1
17:30, 10 January 2017
Share of female students in tertiary education, 2012, in % 2 - 2017 update.PNG
(
file
)
22 KB
1
17:29, 10 January 2017
Students in tertiary education for 2012 - 012017 update.PNG
(
file
)
29 KB
1
17:14, 10 January 2017
Total venture capital investment (VCI), in millions of euros until 2015.PNG
(
file
)
27 KB
1
17:13, 10 January 2017
Average annual growth rate of R&D expenditure in business enterprises, 2005-2014 (1)(2) update.PNG
(
file
)
28 KB
1
17:11, 10 January 2017
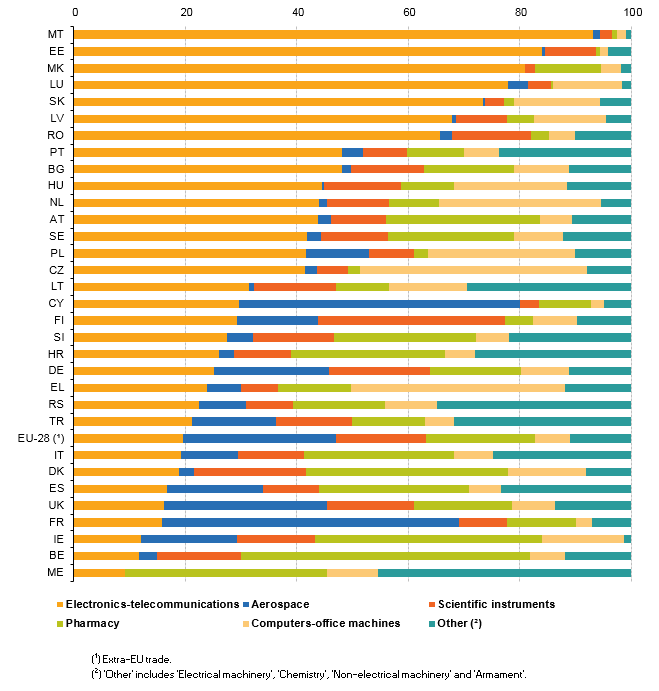
High-tech exports by high-technology group of products, EU-28 and selected countries, 2015, in % update.PNG
(
file
)
20 KB
1
17:10, 10 January 2017
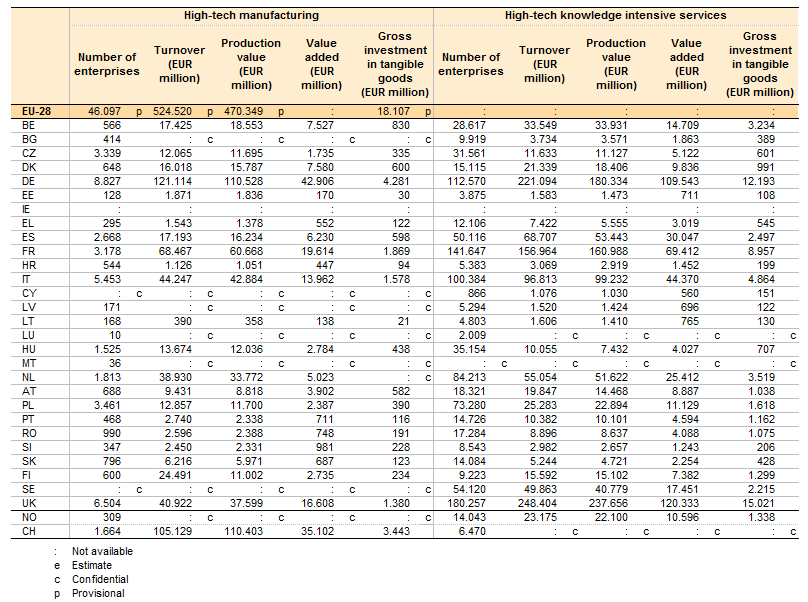
Economic statistics on high-tech sectors in 2014 update.PNG
(
file
)
43 KB
1
09:58, 4 September 2013
Table Organic farming number of holdings and utilised agricultural area UK 2010.PNG
(
file
)
7 KB
2
11:04, 6 August 2013
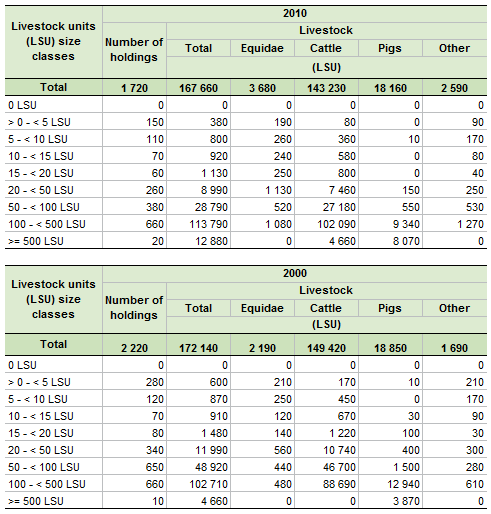
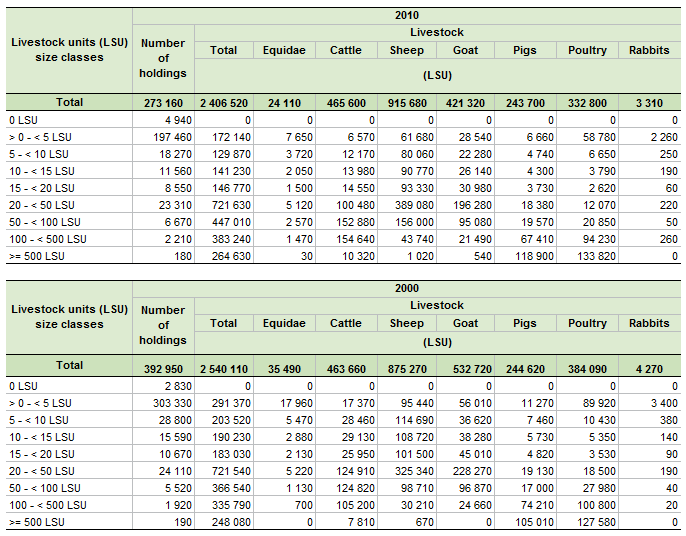
Table Number of holdings with livestock by LSU size class LU 2000 and 2010.PNG
(
file
)
29 KB
2
10:30, 6 August 2013
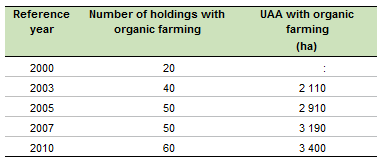
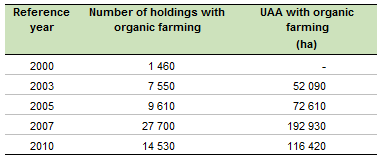
Table Organic farming number of holdings and utilised agricultural area LU 2010.PNG
(
file
)
5 KB
1
10:30, 6 August 2013
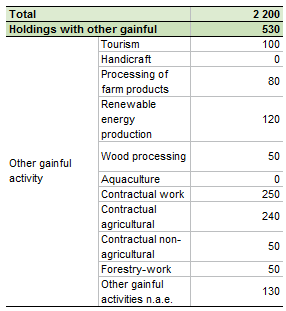
Table Number of holdings by other gainful activities by NUTS 2 regions LU 2010.PNG
(
file
)
11 KB
1
10:30, 6 August 2013
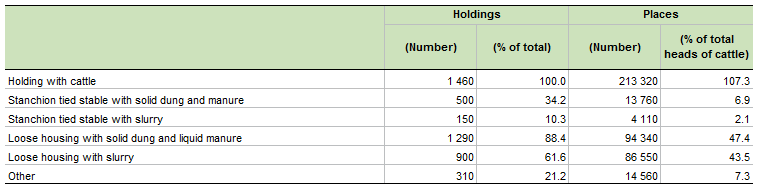
Table Number of holdings with cattle and places by type of animal housing LU 2010.PNG
(
file
)
13 KB
1
10:29, 6 August 2013
Figure Sole Holders by Gender LU 2003 and 2010.PNG
(
file
)
15 KB
1
10:29, 6 August 2013
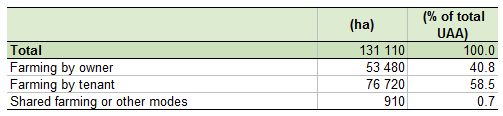
Table Utilised agricultural area by type of tenure by NUTS 2 regions LU 2010.PNG
(
file
)
6 KB
1
10:29, 6 August 2013
Table Agricultural labour force LU 2003 and 2010.PNG
(
file
)
13 KB
1
10:28, 6 August 2013
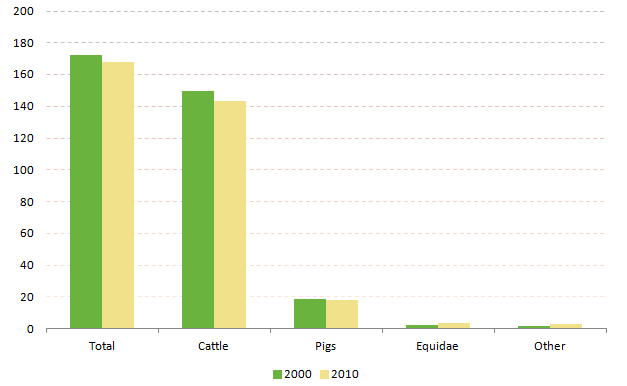
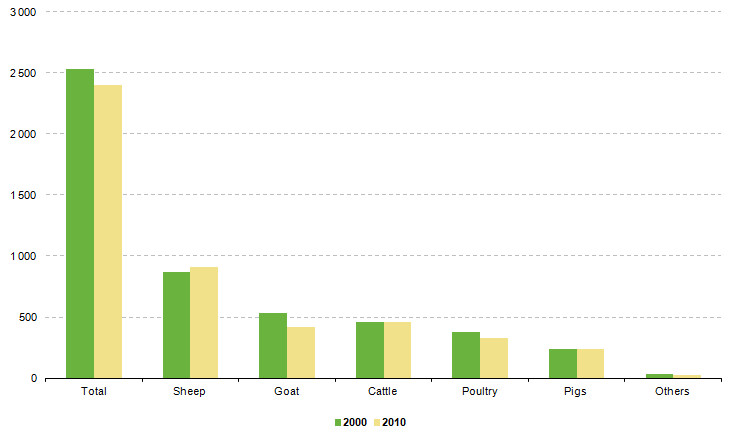
Figure Livestock by main types LU 2000 and 2010.PNG
(
file
)
12 KB
1
10:28, 6 August 2013
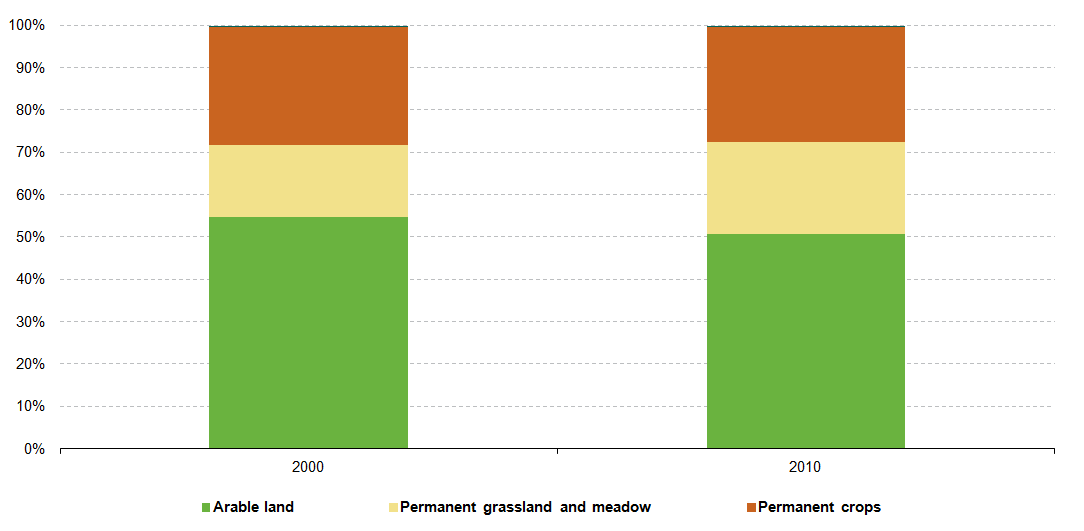
Figure Utilised Agricultural Area by land use LU 2000 and 2010.PNG
(
file
)
18 KB
1
10:28, 6 August 2013
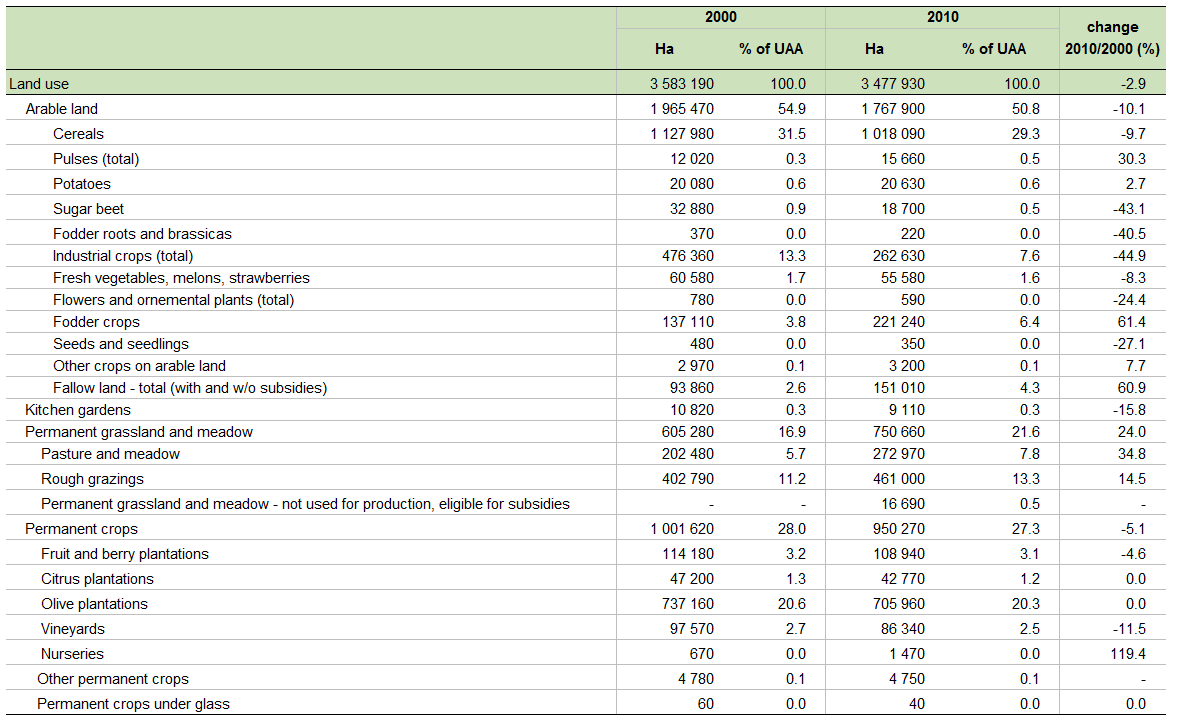
Table Utilised Agricultural Area by land use LU 2000 and 2010.PNG
(
file
)
58 KB
1
10:27, 6 August 2013
Figure Standard output by main type of farming LU 2010.PNG
(
file
)
23 KB
1
10:27, 6 August 2013
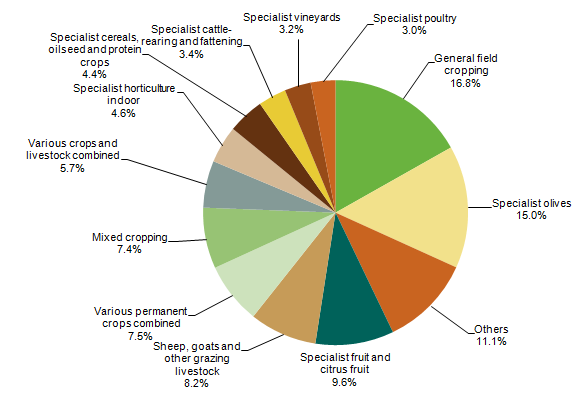
Figure Number of holdings by main type of farming LU 2010.PNG
(
file
)
23 KB
1
10:27, 6 August 2013
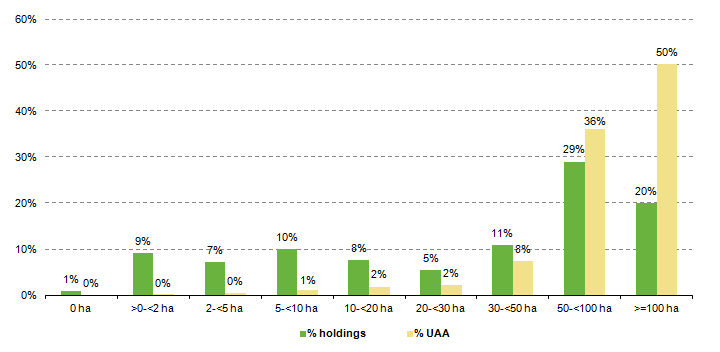
Figure Number of holdings and Utilised Agriculture Area (UAA) by UAA size classes LU 2010.PNG
(
file
)
13 KB
1
10:26, 6 August 2013
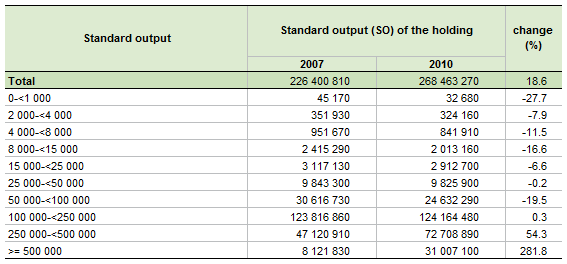
Table Economic size of the farm by standard output size classes LU 2007 and 2010.PNG
(
file
)
15 KB
1
10:26, 6 August 2013
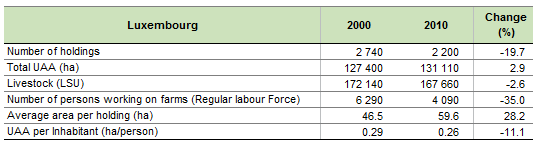
Table Farm Structure key indicators LU 2000 2010.PNG
(
file
)
10 KB
1
11:18, 31 July 2013
TAB OGA GR 2000.xls
(
file
)
3.46 MB
1
11:17, 31 July 2013
TAB LABOUR FORCE 2 GR.xls
(
file
)
27 KB
1
11:17, 31 July 2013
TAB LABOUR FORCE GR.xls
(
file
)
64 KB
1
11:17, 31 July 2013
TAB LIVESTOCK GR.xls
(
file
)
67 KB
1
10:51, 31 July 2013
Table Organic farming number of holdings and utilised agricultural area GR 2010.PNG
(
file
)
5 KB
1
10:51, 31 July 2013
Table Number of holdings by other gainful activities by NUTS 2 regions GR 2010.PNG
(
file
)
39 KB
1
10:51, 31 July 2013
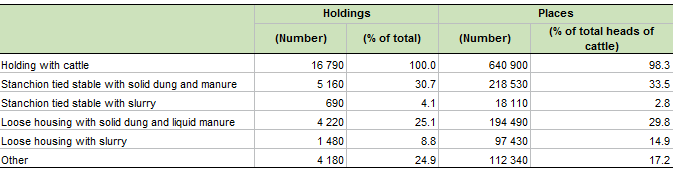
Table Number of holdings with cattle and places by type of animal housing GR 2010.PNG
(
file
)
13 KB
1
10:50, 31 July 2013
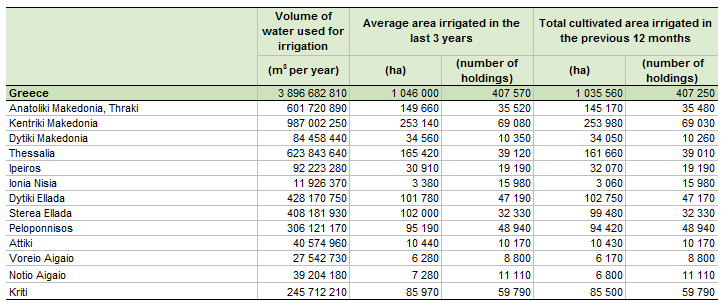
Table Key figures on irrigation GR 2010.PNG
(
file
)
26 KB
1
10:50, 31 July 2013
Figure Irrigated area by type of crops GR 2010.PNG
(
file
)
24 KB
1
10:50, 31 July 2013
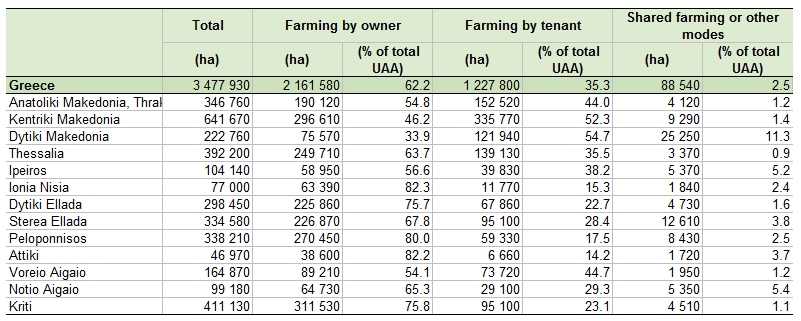
Table Utilised agricultural area by type of tenure by NUTS 2 regions GR 2010.PNG
(
file
)
32 KB
1
10:49, 31 July 2013
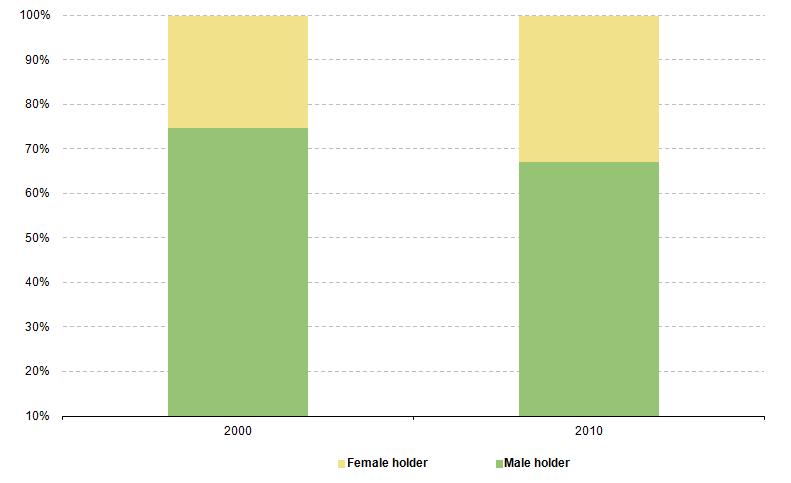
Figure Sole Holders by Gender GR 2003 and 2010.PNG
(
file
)
18 KB
1
10:48, 31 July 2013
Table Agricultural labour force GR 2003 and 2010.PNG
(
file
)
17 KB
1
10:48, 31 July 2013
Figure Livestock by main types GR 2000 and 2010.PNG
(
file
)
12 KB
1
10:48, 31 July 2013
Table Number of holdings with livestock by LSU size class GR 2000 and 2010.PNG
(
file
)
44 KB
1
10:47, 31 July 2013
Table Utilised Agricultural Area by land use GR 2000 and 2010.PNG
(
file
)
69 KB
1
10:47, 31 July 2013
Figure Utilised Agricultural Area by land use GR 2000 and 2010.PNG
(
file
)
24 KB
1
10:47, 31 July 2013
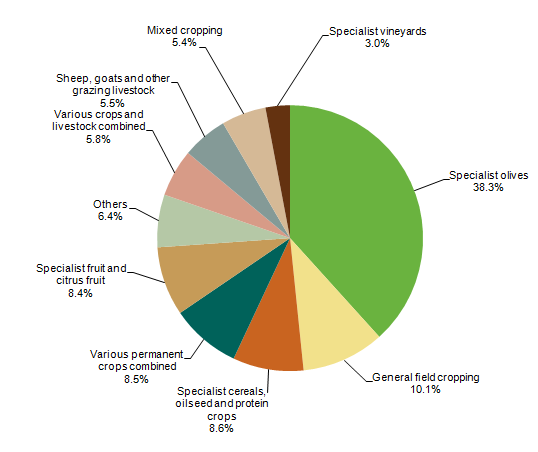
Figure Standard output by main type of farming GR 2010.PNG
(
file
)
30 KB
1
10:46, 31 July 2013
Figure Number of holdings by main type of farming GR 2010.PNG
(
file
)
26 KB
1
10:46, 31 July 2013
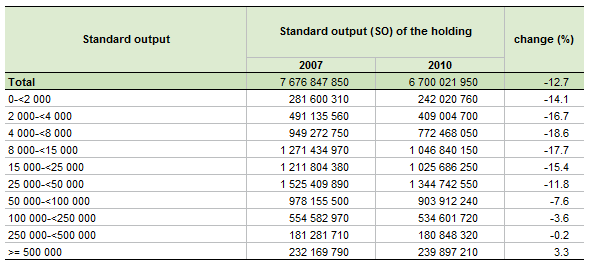
Table Economic size of the farm by standard output size classes GR 2007 and 2010.PNG
(
file
)
17 KB
1
10:45, 31 July 2013
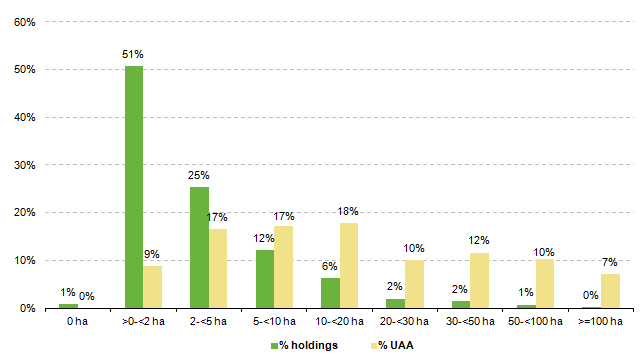
Figure Number of holdings and Utilised Agriculture Area (UAA) by UAA size classes GR 2010.PNG
(
file
)
12 KB
1
10:45, 31 July 2013
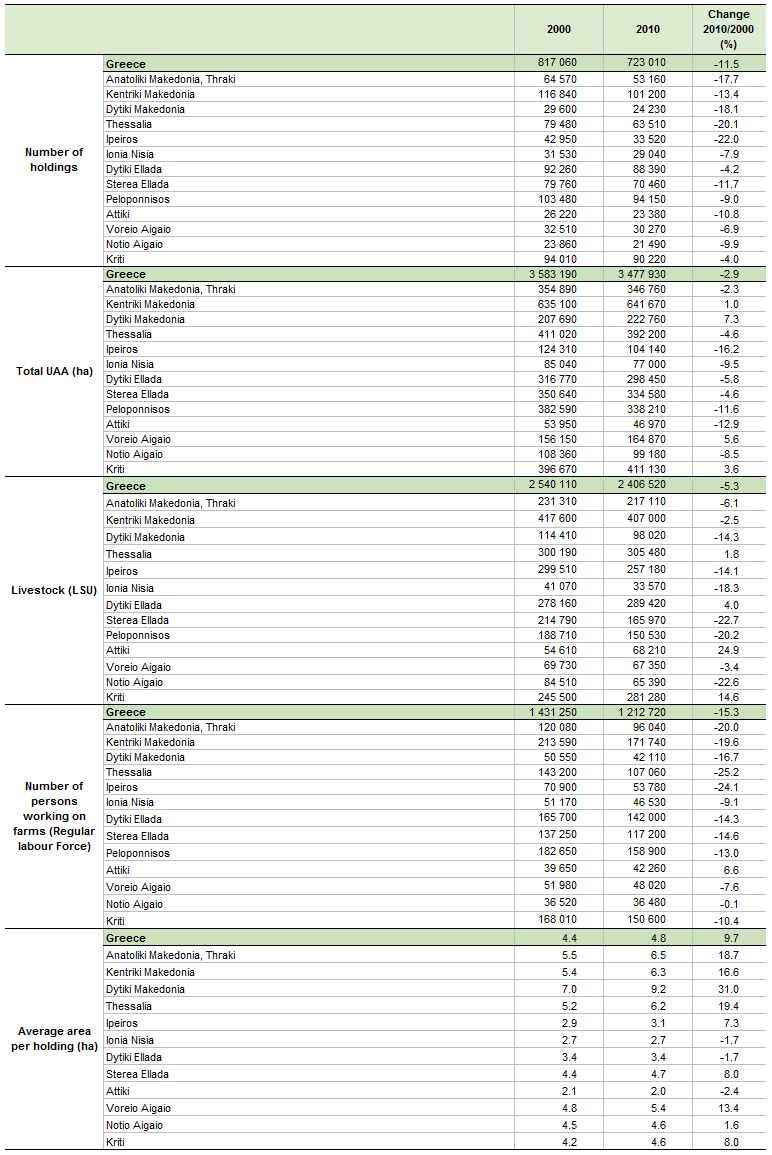
Table Farm structure key indicators by NUTS 2 regions GR 2000 and 2010.PNG
(
file
)
113 KB
1
10:45, 31 July 2013
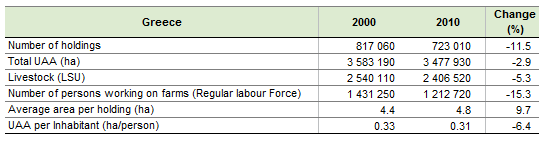
Table Farm Structure key indicators GR 2000 2010.PNG
(
file
)
10 KB
2
11:27, 26 July 2013
TAB LIVESTOCK SK.xls
(
file
)
50 KB
2
11:24, 26 July 2013
TAB OGA SK 2000.xls
(
file
)
3.45 MB
1
First page
Previous page
Next page
Last page
Special page
ISSN 2443-8219


,_in_millions_of_euros_until_2015.PNG)
(2)_update.PNG)


_by_UAA_size_classes_LU_2010.PNG)


_by_UAA_size_classes_GR_2010.PNG)

