Tutorials
Log in
Statistics Explained
menu
search
search
Navigation
Main page
Statistical themes
Glossary
Categories
Statistics 4 beginners
Tutorials
Help
Eurostat home
Education corner
Online publications
Regional yearbook
Sustainable development
Full list
Tools
User contributions
Logs
View user groups
Special pages
search
Navigation
Main page
Statistical themes
Glossary
Categories
Statistics 4 beginners
Tutorials
Help
Eurostat home
Education corner
Online publications
Regional yearbook
Sustainable development
Full list
Tools
User contributions
Logs
View user groups
Special pages
Navigation
Main page
Statistical themes
Glossary
Categories
Statistics 4 beginners
Tutorials
Help
Eurostat home
Education corner
Online publications
Regional yearbook
Sustainable development
Full list
Tools
User contributions
Logs
View user groups
Special pages
Uploads by Gerstch
This special page shows all uploaded files.
File list
Items per page:
20
50
100
250
500
Search for media name:
Username:
Include old versions of files
Go
Date
Name
Thumbnail
Size
Description
Versions
13:29, 10 April 2019
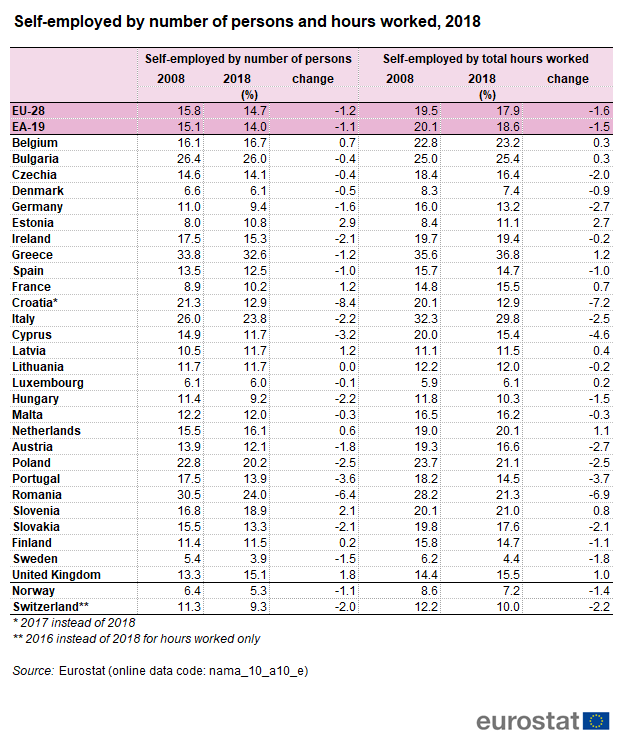
Self-employed by number of persons and hours worked, 2018.png
(
file
)
63 KB
3
11:44, 10 April 2019
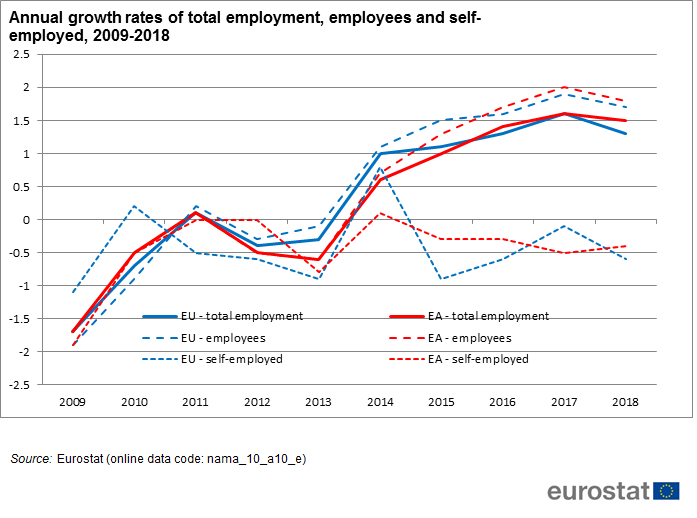
Annual growth rates of total employment, employees and self-employed, 2009-2018.png
(
file
)
33 KB
2
20:19, 10 January 2019
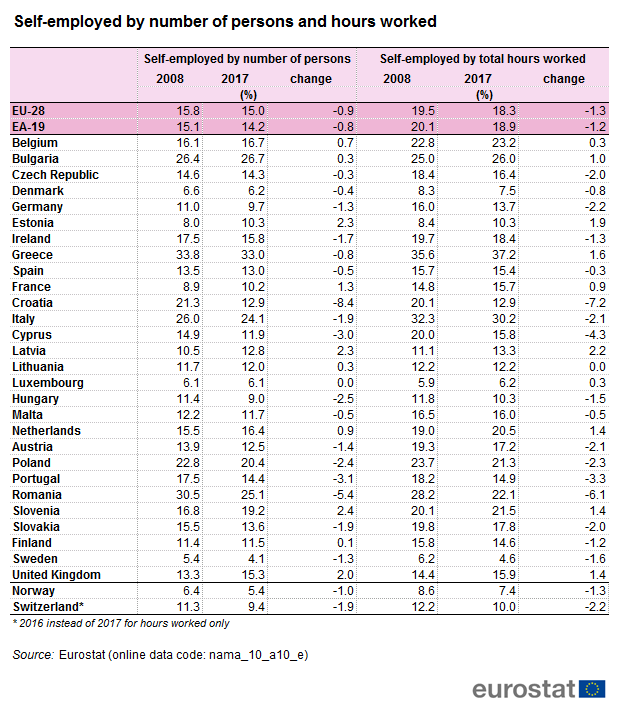
Self-employed by number of persons and hours worked.png
(
file
)
44 KB
3
20:12, 10 January 2019
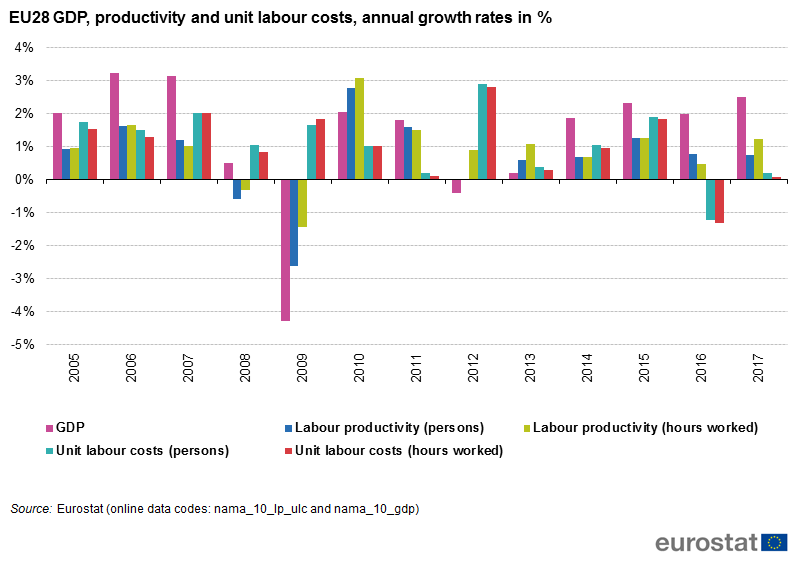
EU28 GDP, productivity and unit labour costs, annual growth rates in %.png
(
file
)
28 KB
3
19:06, 10 January 2019
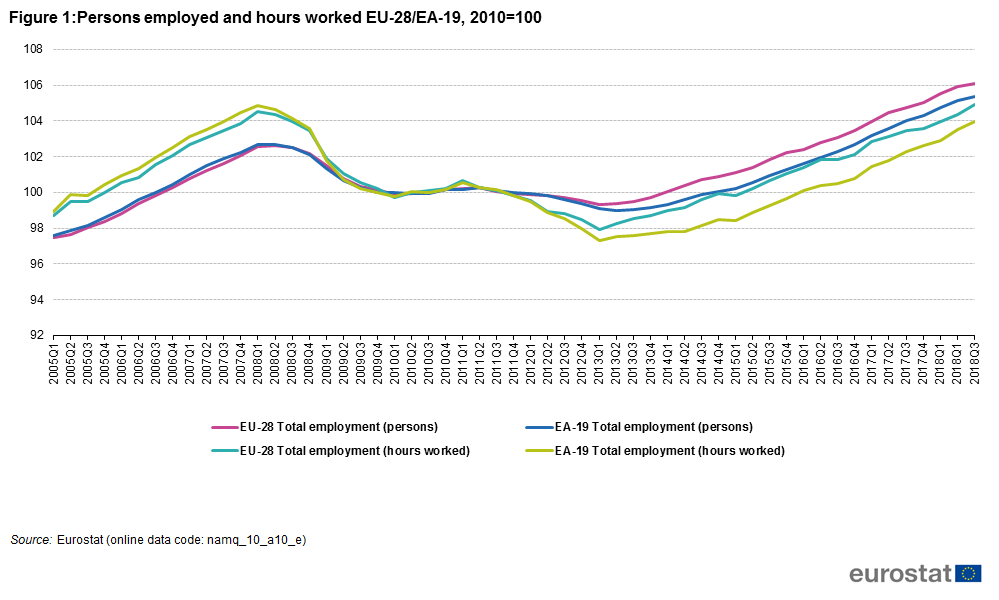
Figure 1 Persons employed and hours worked EU-28 EA-19, 2010=100.png
(
file
)
39 KB
1
15:15, 10 January 2019
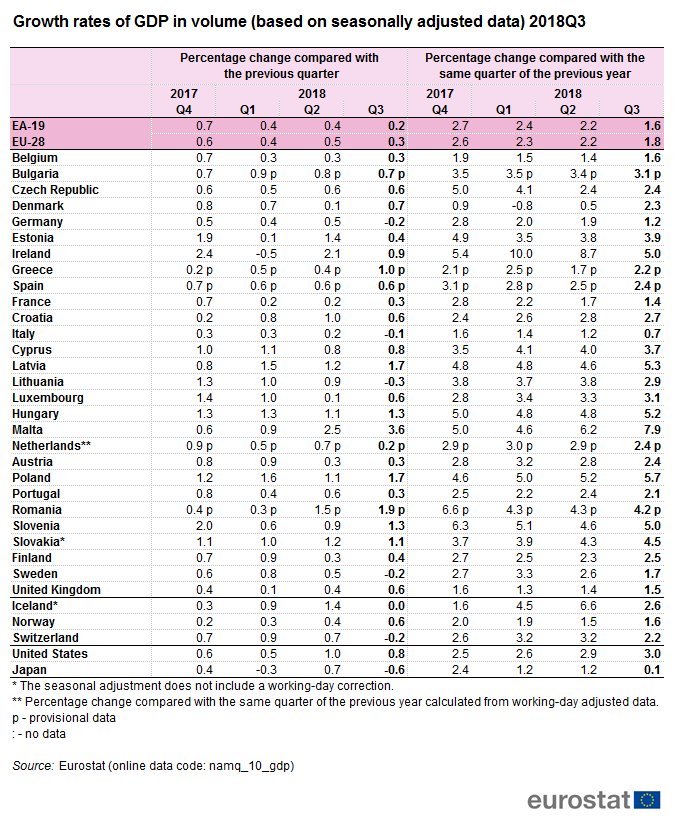
Growth rates of GDP in volume (based on seasonally adjusted data) 2018Q3.png
(
file
)
54 KB
1
15:12, 10 January 2019
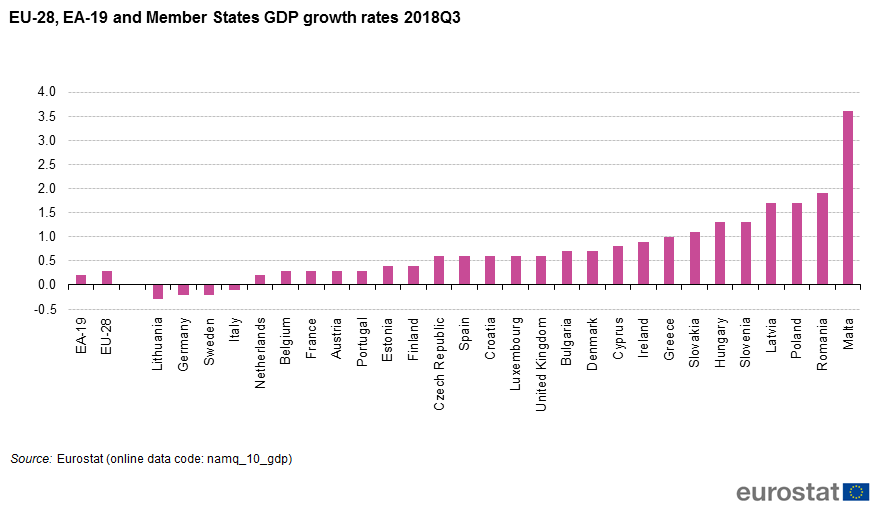
EU-28, EA-19 and Member States GDP growth rates 2018Q3.png
(
file
)
23 KB
1
15:07, 10 January 2019
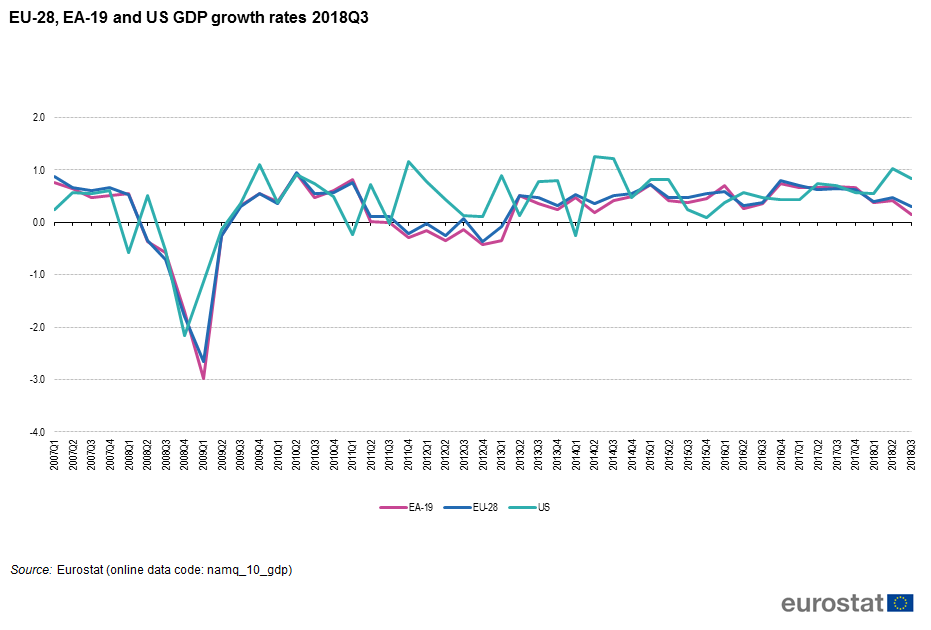
EU-28, EA-19 and US GDP growth rates 2018Q3.png
(
file
)
36 KB
1
17:48, 4 April 2013
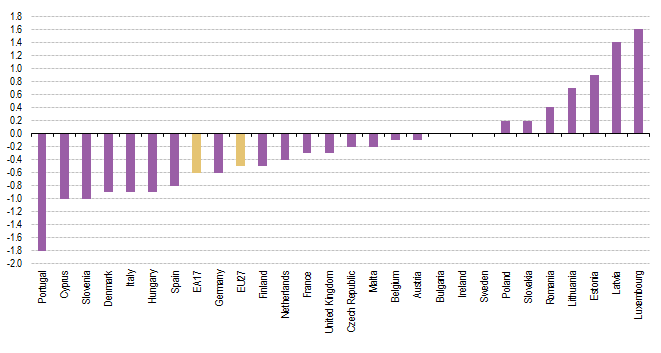
EU27, EA17 and Member States GDP growth rates in the fourth quarter of 2012.png
(
file
)
6 KB
Reverted to version as of 13:26, 4 April 2013
1
16:18, 22 August 2011
SU EU27 2006.xls
(
file
)
58 KB
1
16:14, 22 August 2011
IO EU27 2006.xls
(
file
)
52 KB
1
16:05, 22 August 2011
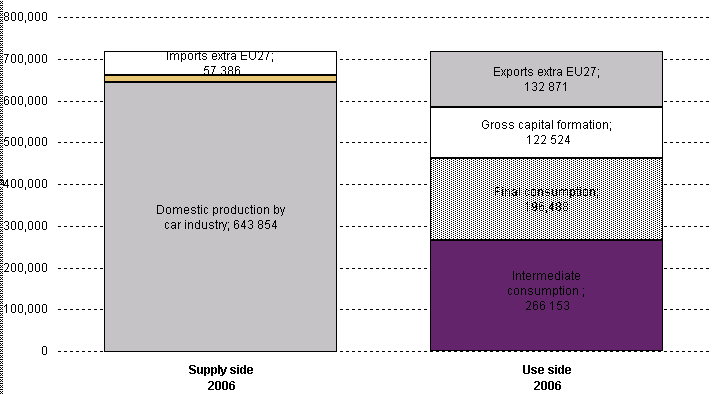
SU car industry within EU27 2006.png
(
file
)
7 KB
1
15:19, 27 January 2011
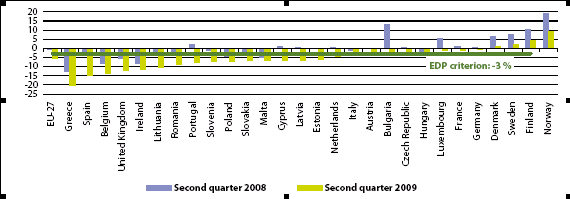
Government deficit, net borrowing (-) lending (+) as a percentage of GDP.png
(
file
)
9 KB
1
15:10, 27 January 2011
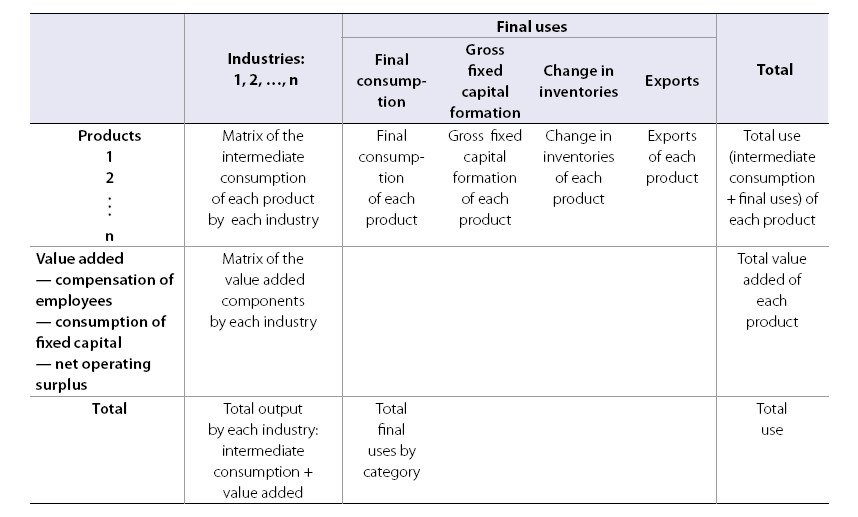
Simplified use table.png
(
file
)
26 KB
Reverted to version as of 15:55, 2 December 2010
4
18:21, 24 November 2010
GDP per inhabitant PPS by NUTS 2 region 2007.png
(
file
)
236 KB
1
13:13, 11 January 2010
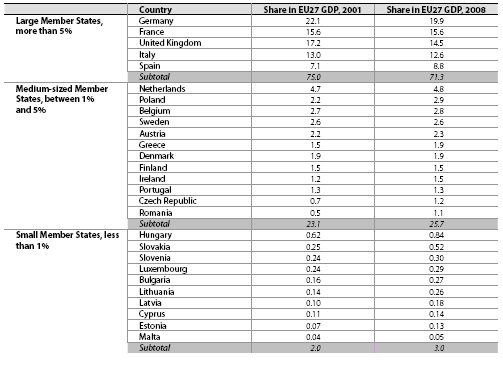
Member States relative economic size.PNG
(
file
)
21 KB
1
Special page
ISSN 2443-8219


_2018Q3.png)


_lending_(%2B)_as_a_percentage_of_GDP.png)


