Tutorials
Log in
Statistics Explained
menu
search
search
Navigation
Main page
Statistical themes
Glossary
Categories
Statistics 4 beginners
Tutorials
Help
Eurostat home
Education corner
Online publications
Regional yearbook
Sustainable development
Full list
Tools
User contributions
Logs
View user groups
Special pages
search
Navigation
Main page
Statistical themes
Glossary
Categories
Statistics 4 beginners
Tutorials
Help
Eurostat home
Education corner
Online publications
Regional yearbook
Sustainable development
Full list
Tools
User contributions
Logs
View user groups
Special pages
Navigation
Main page
Statistical themes
Glossary
Categories
Statistics 4 beginners
Tutorials
Help
Eurostat home
Education corner
Online publications
Regional yearbook
Sustainable development
Full list
Tools
User contributions
Logs
View user groups
Special pages
Uploads by Floreda
This special page shows all uploaded files.
File list
Items per page:
20
50
100
250
500
Search for media name:
Username:
Include old versions of files
Go
Date
Name
Thumbnail
Size
Description
Versions
16:28, 12 September 2017
FSS survey coverage.xlsx
(
file
)
137 KB
1
16:26, 12 September 2017
Tables.xlsx
(
file
)
137 KB
1
12:17, 12 September 2017
Table 19. Evolution of main characteristics for United Kingdom, 2000-2013.png
(
file
)
50 KB
1
12:16, 12 September 2017
Table 18. Evolution of main characteristics for Sweden, 2000-2013.png
(
file
)
48 KB
1
12:16, 12 September 2017
Table 17. Evolution of main characteristics for Finland, 2000-2013.png
(
file
)
64 KB
1
12:16, 12 September 2017
Table 16. Evolution of main characteristics for Slovakia, 2000-2013.png
(
file
)
50 KB
1
12:15, 12 September 2017
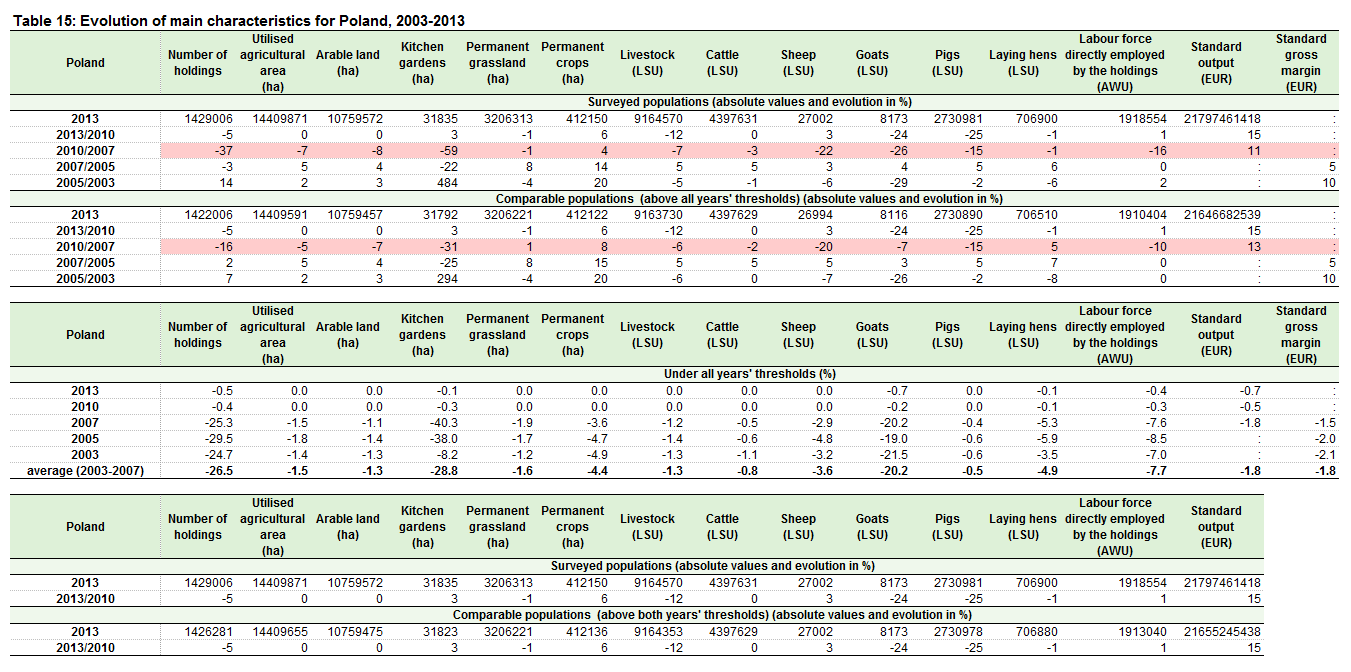
Table 15. Evolution of main characteristics for Poland, 2003-2013.png
(
file
)
65 KB
1
12:15, 12 September 2017
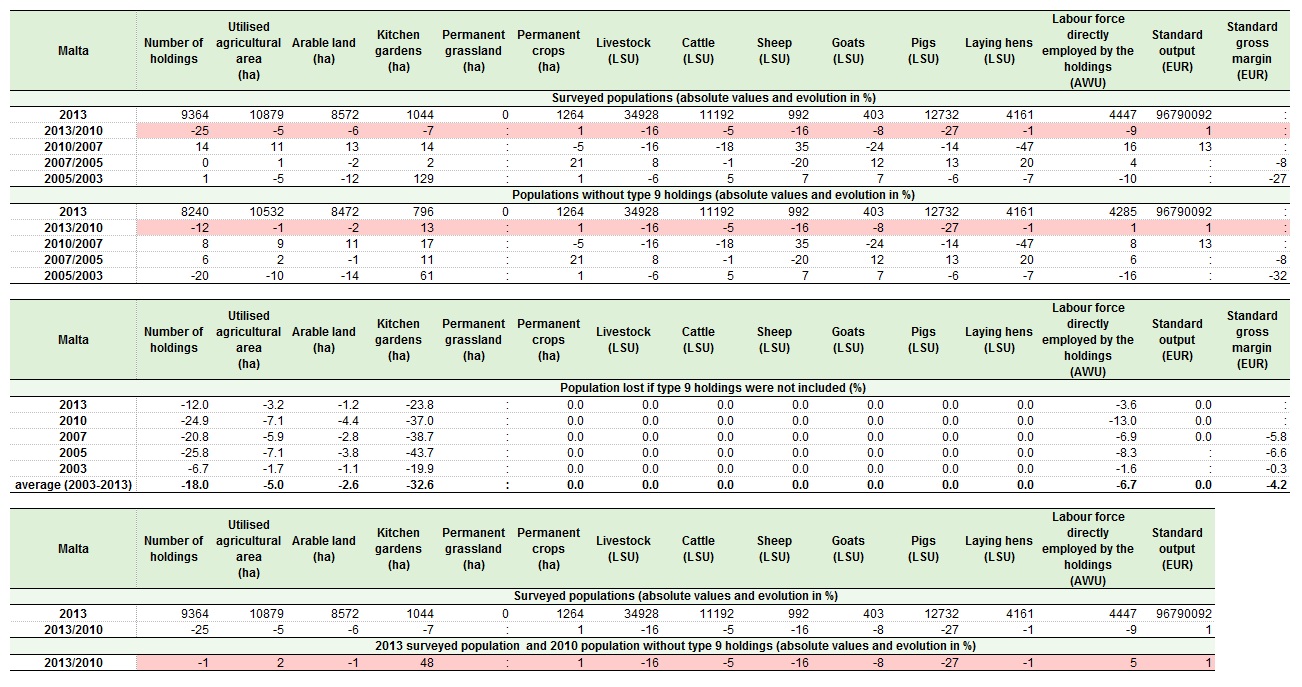
Table 14. Evolution of main characteristics for Malta, 2003-2013.png
(
file
)
61 KB
1
12:15, 12 September 2017
Table 13. Evolution of main characteristics for Luxembourg, 2000-2013.png
(
file
)
65 KB
1
12:14, 12 September 2017
Table 12. Evolution of main characteristics for Latvia, 2001-2013.png
(
file
)
48 KB
1
12:14, 12 September 2017
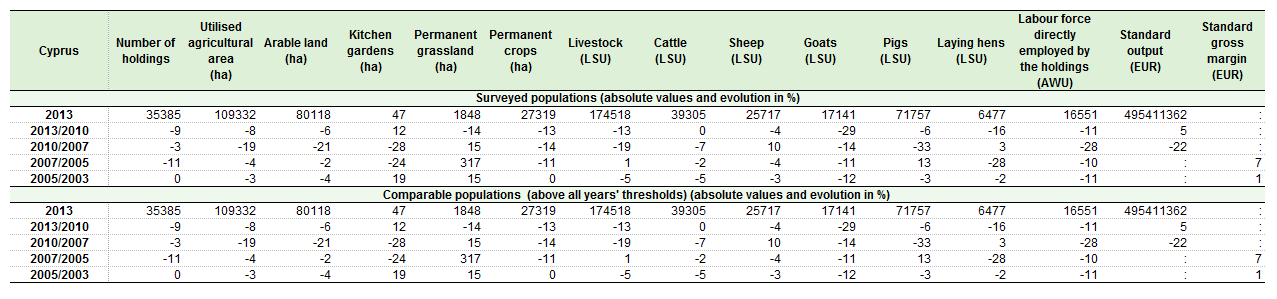
Table 11. Evolution of main characteristics for Cyprus, 2003-2013.png
(
file
)
27 KB
1
12:14, 12 September 2017
Table 10. Evolution of main characteristics for Italy, 2000-2013.png
(
file
)
66 KB
1
12:14, 12 September 2017
Table 9. Evolution of main characteristics for Croatia, 2007-2013.png
(
file
)
55 KB
1
12:13, 12 September 2017
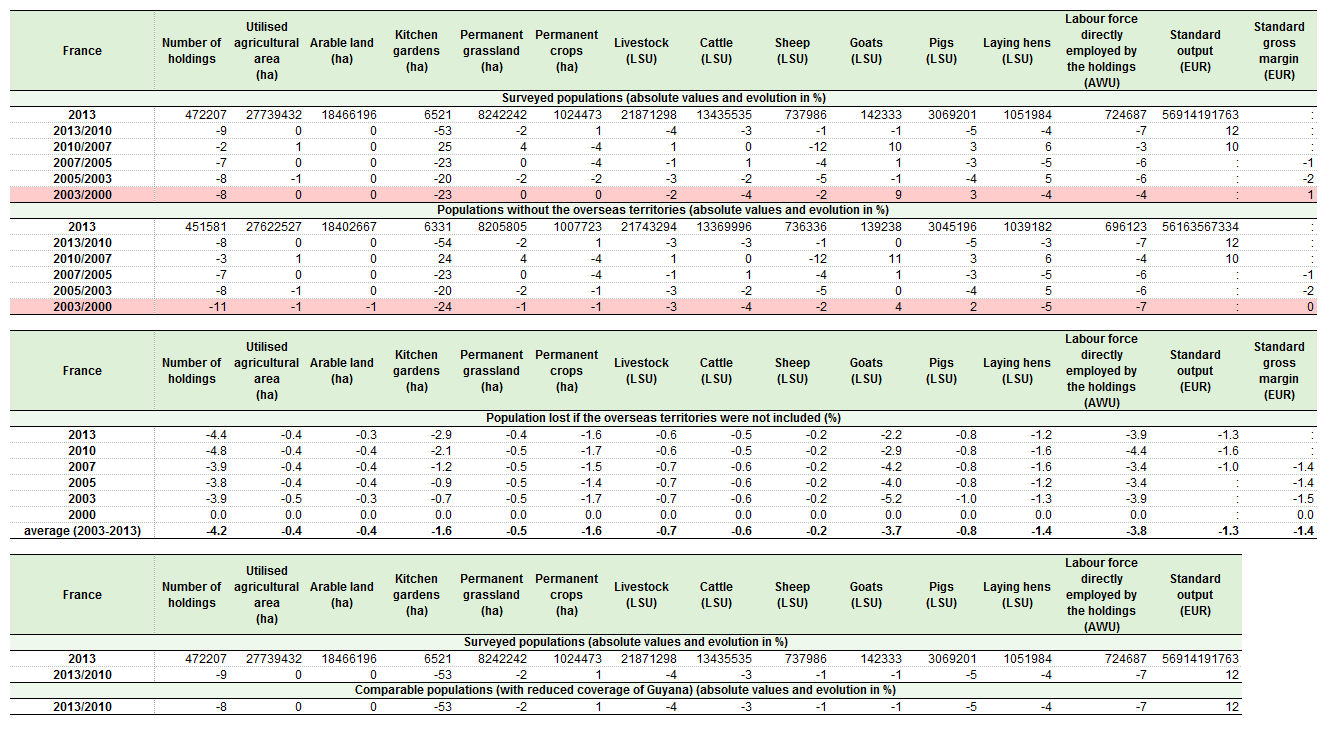
Table 8. Evolution of main characteristics for France, 2000-2013.png
(
file
)
67 KB
1
12:13, 12 September 2017
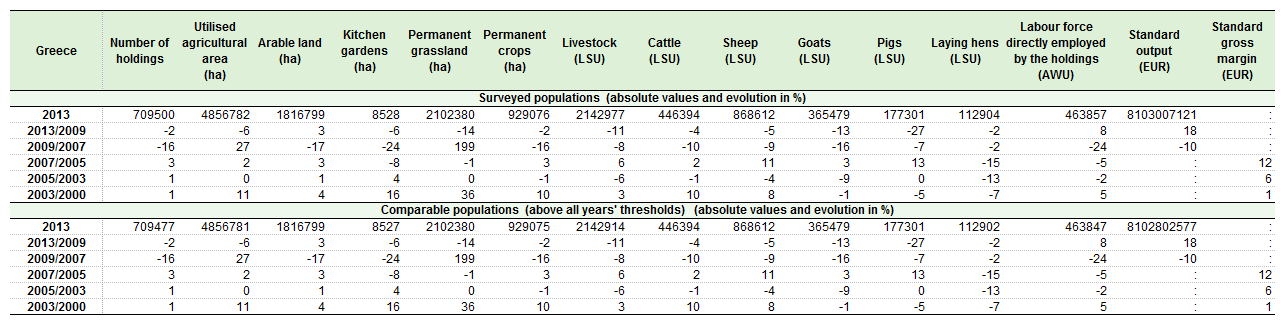
Table 7. Evolution of main characteristics for Greece, 2000-2013.png
(
file
)
30 KB
1
12:13, 12 September 2017
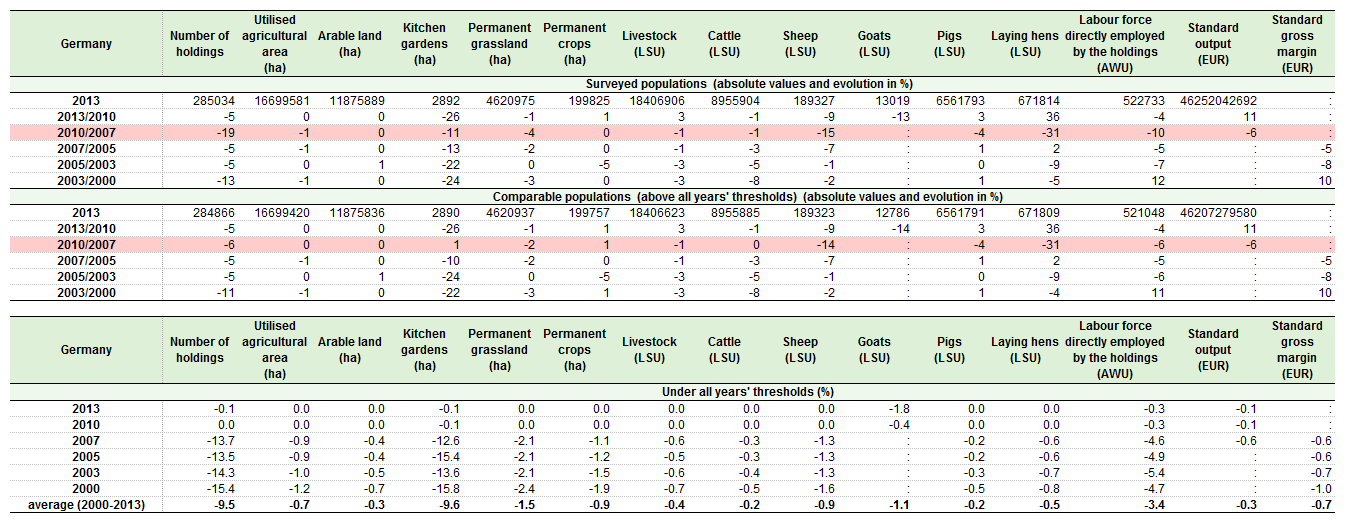
Table 6. Evolution of main characteristics for Germany, 2000-2013.png
(
file
)
48 KB
1
12:12, 12 September 2017
Table 5. Evolution of main characteristics for Denmark, 2000-2013.png
(
file
)
47 KB
1
12:12, 12 September 2017
Table 4. Evolution of main characteristics for Czech Republic, 2003-2013.png
(
file
)
45 KB
1
11:17, 12 September 2017
Table 3. Impact of the modifications of survey coverage on national populations.png
(
file
)
56 KB
1
11:09, 12 September 2017
Table 3. Impact of the modification of thresholds on national populations.png
(
file
)
58 KB
2
10:45, 12 September 2017
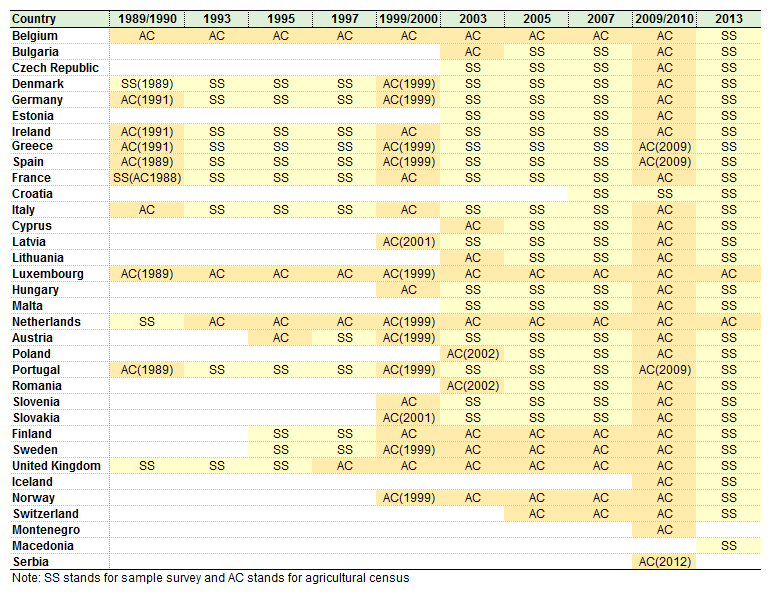
Table 2. Overview of the survey coverage in countries, for FSS 2007-2013.png
(
file
)
829 KB
1
10:42, 12 September 2017
Table 1. Thresholds used in FSS legislation.png
(
file
)
19 KB
2
18:23, 29 August 2017
Purpose of use of administrative data sources in FSS 2013.png
(
file
)
547 KB
1
18:21, 29 August 2017
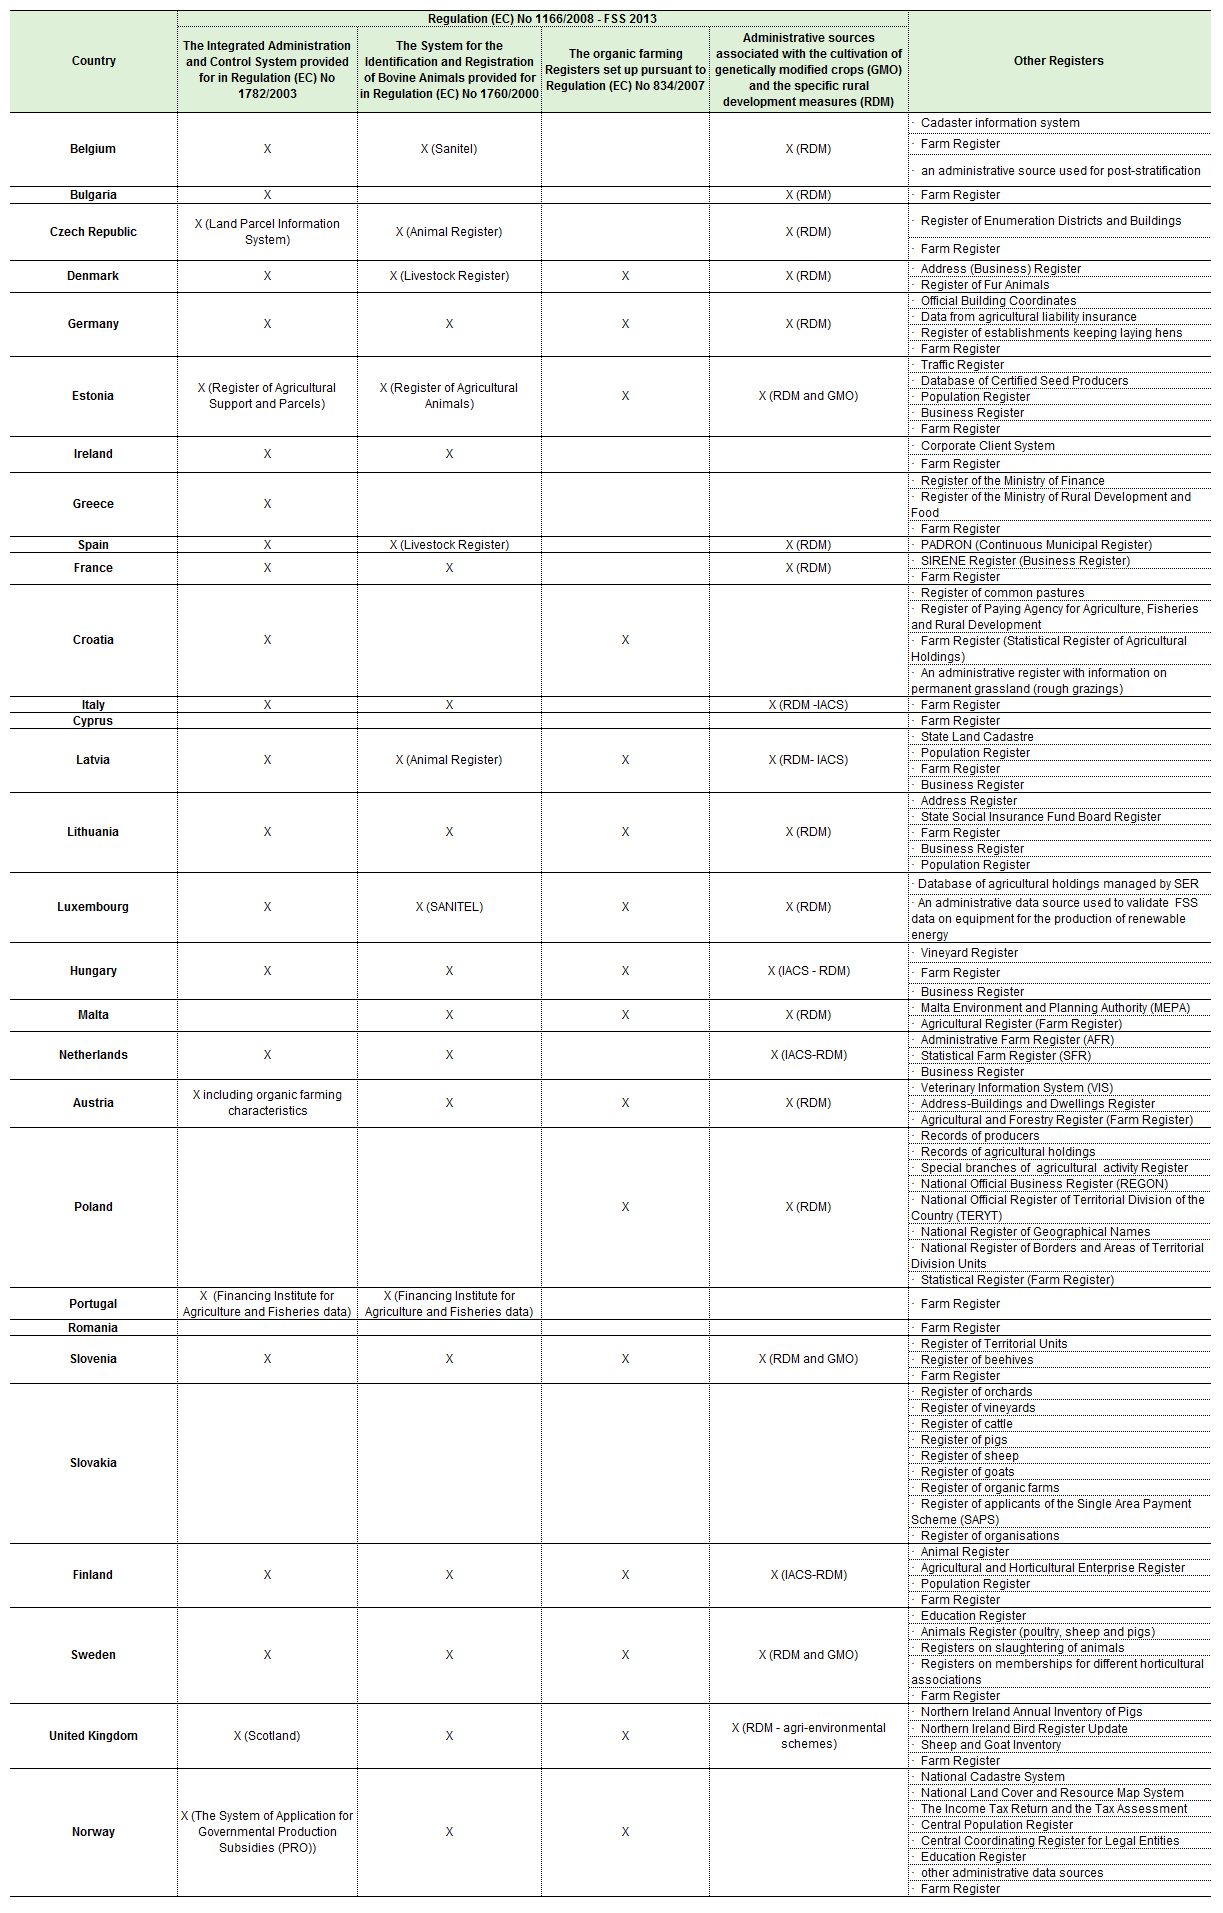
Administrative data sources used in FSS 2013.png
(
file
)
147 KB
1
18:15, 29 August 2017
FSS-administrative sources.xlsx
(
file
)
32 KB
2
18:14, 29 August 2017
Use of administrative data sources in the FSS 2013.png
(
file
)
147 KB
4
16:58, 18 August 2017
FSS-common land.xlsx
(
file
)
21 KB
11
16:57, 18 August 2017
T1 Methods to include common land in FSS 2013.png
(
file
)
28 KB
6
09:35, 17 July 2017
FSS-measurement errors.xlsx
(
file
)
19 KB
3
09:34, 17 July 2017
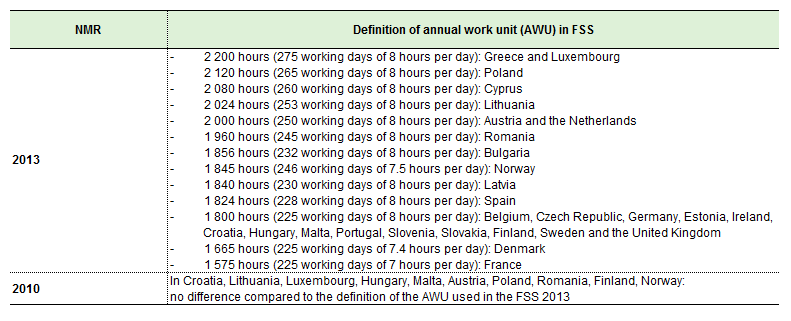
T2 Definition of Annual work unit (AWU) in farm structure surveys.png
(
file
)
29 KB
2
09:34, 17 July 2017
T1 Characteristics with significant measurement errors in the FSS 2013.png
(
file
)
49 KB
2
17:16, 10 July 2017
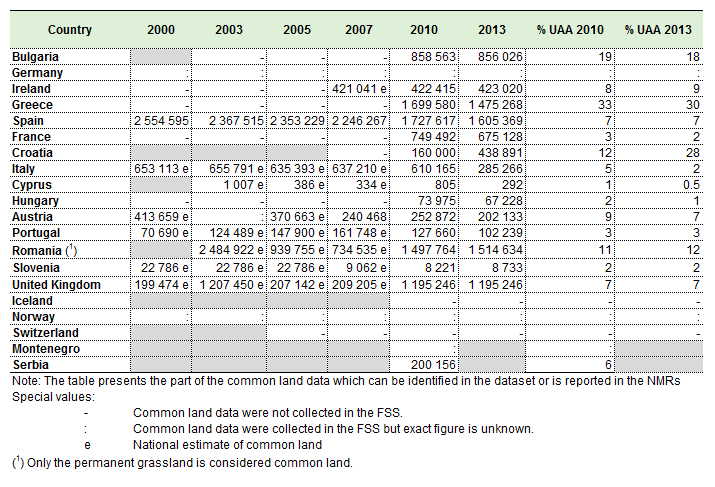
T2 Common land (recorded using Method B), 2000-2013 (hectares).png
(
file
)
33 KB
3
10:58, 10 July 2017
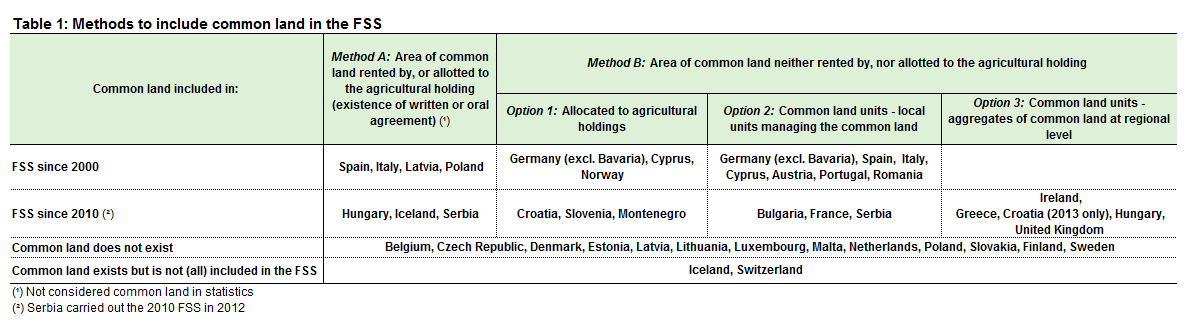
T1 Methods to include common land in the FSS 2013.png
(
file
)
28 KB
1
10:54, 10 July 2017
T1 Methods to include common land in the FSS.png
(
file
)
28 KB
3
14:45, 4 May 2017
Table 2 - Survey coverage in FSS between 2000 and 2013.png
(
file
)
832 KB
2
12:44, 6 March 2017
Table 1.Online data available for Farm Structure Survey by country.png
(
file
)
40 KB
4
12:10, 20 February 2017
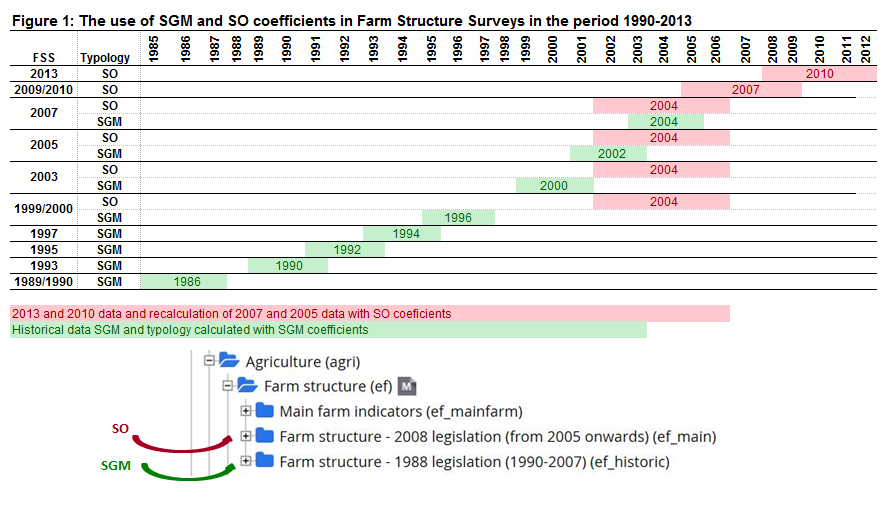
Figure 1.The use of SO and SGM coefficients in Farm Structure Surveys in the period 1990-2013.png
(
file
)
101 KB
1
17:15, 10 February 2017
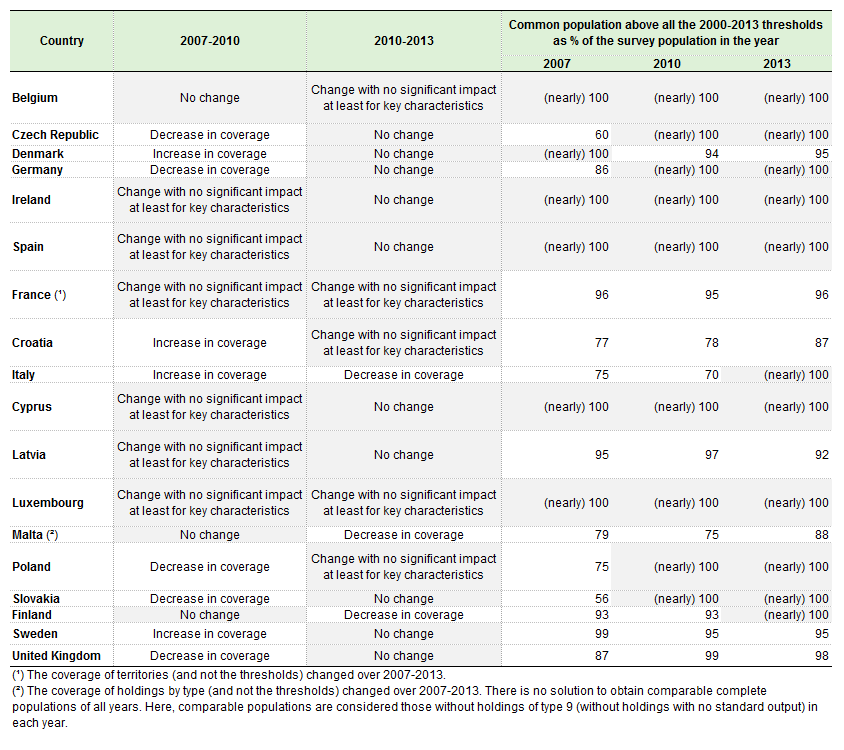
Table 3 - Common populations above all the 2000-2013 thresholds.png
(
file
)
60 KB
2
16:37, 10 February 2017
Table 15 - Evolution of main characteristics for Poland, 2003-2013.png
(
file
)
67 KB
3
13:02, 3 February 2017
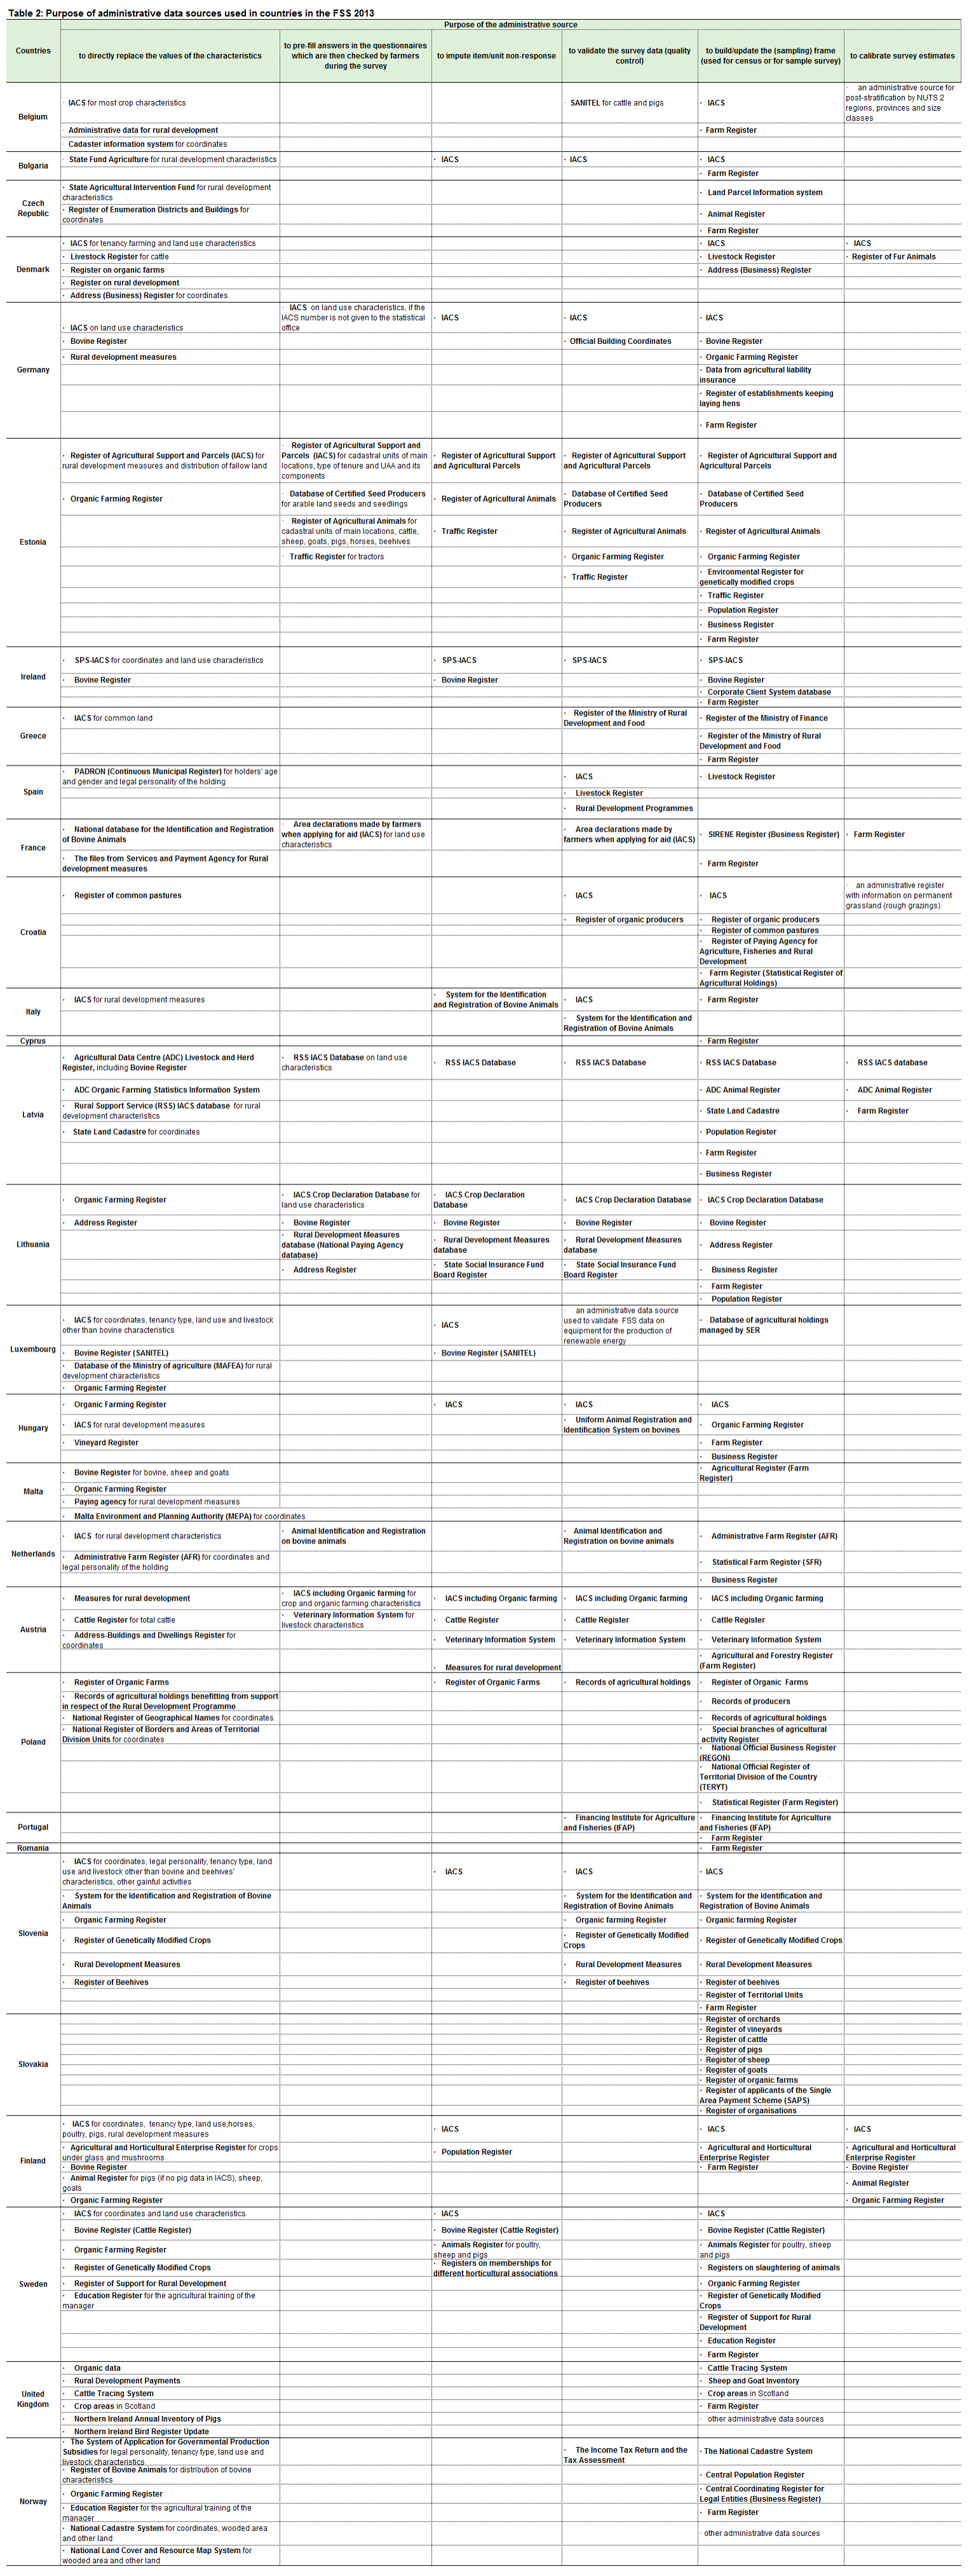
Purpose of administrative data sources used in countries in the FSS 2013.png
(
file
)
550 KB
4
17:47, 2 February 2017
Table 2. Purpose of the administrative sources used in countries in FSS 2013.xlsx
(
file
)
23 KB
1
15:04, 2 February 2017
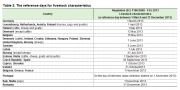
The reference periods for land characteristics.png
(
file
)
30 KB
2
15:03, 2 February 2017
Table 1. The reference periods for land characteristics.xlsx
(
file
)
11 KB
1
14:41, 2 February 2017
The reference days for livestock characteristics.png
(
file
)
28 KB
1
14:35, 2 February 2017
Table 2. The reference days for livestock characteristics.xlsx
(
file
)
28 KB
2
16:07, 31 January 2017
Methods to include common land in the FSS.png
(
file
)
30 KB
2
15:21, 31 January 2017
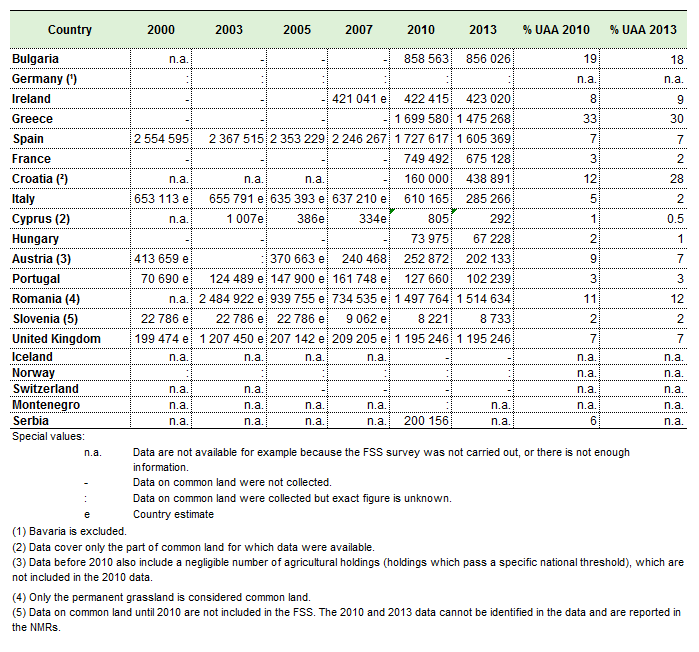
Common land (recorded using Method B), 2000-2013 .png
(
file
)
44 KB
1
13:00, 31 January 2017
Common land area, 2000-2013 (hectares).png
(
file
)
41 KB
1
09:04, 29 April 2014
SGM SO.png
(
file
)
165 KB
8
Special page
ISSN 2443-8219


_in_farm_structure_surveys.png)

,_2000-2013_(hectares).png)


,_2000-2013_.png)
.png)
